
Abstract
SUMMARY: Radiologic assessment of cochlear implants can be limited because of metallic streak artifacts and the high attenuation of the temporal bones. We report on 14 patients with 18 cochlear implants (17 Med-El standard 31.5-mm arrays, 1 Med-El medium 24-mm array) who underwent flat panel CT with the use of high-resolution secondary reconstruction techniques. Flat panel CT depicted the insertion site, cochlear implant course, and all 216 individual electrode contacts. The calculated mean angular insertion depth for standard arrays was 591.9° (SD = 70.9; range, 280°). High-resolution secondary reconstructions of the initial flat panel CT dataset, by use of a manually generated field of view, Hounsfield unit kernel type, and sharp image characteristics, provided high-quality images with improved spatial resolution. Flat panel CT is a promising imaging tool for the postoperative evaluation of cochlear implant placement.
ABBREVIATIONS:
- CI
- cochlear implant
- EE
- edge enhancement
- FPCT
- flat panel CT
- HU
- Hounsfield units
- MSCT
- multisection CT
- RW
- round window
Cochlear implants (CIs) can provide functional restoration of hearing in individuals with profound hearing impairment. Clinical outcomes after implantation vary considerably, however, in the degree and quality of hearing recovery. To assess factors potentially related to CI outcomes, much attention has been devoted to characterizing the CI electrode location,1,2 insertion depth,3 scalar localization,4 and relationship to the facial nerve canal.2,5 These data carry important prognostic information and have implications for surgical approaches, insertion techniques, and programming strategies for optimal auditory nerve stimulation. Although CT is considered the current reference standard method for characterizing CI position,6 metallic artifact significantly limits the postoperative imaging evaluation of the electrode array and cochlear anatomy.
Flat panel CT (FPCT) is a relatively new imaging technique that provides CT-like images acquired with a C-arm x-ray system with the use of flat panel image detectors. This technique provides excellent visualization of high-contrast structures with superior spatial resolution in comparison to multisection CT (MSCT).7 Furthermore, secondary reconstruction of the initial FPCT dataset by use of a smaller field of view produces higher-resolution images than can be obtained by standard FPCT reconstructions.
We sought to determine the effectiveness of high-resolution secondary reconstructions of initial FPCT datasets for postoperative CI imaging. We compared 4 different types of image characteristics (very smooth, normal, auto, and sharp) and 2 different kernel types (Hounsfield units [HU] and edge enhancement [EE]) used in the creation of secondary reconstructions to identify the specific reconstruction parameters that lead to optimal CI visualization.
Subjects
A total of 14 patients with sensorineural hearing loss who underwent previous cochlear implantation with 17 Med-El standard 12-electrode contact arrays (31.5-mm linear insertion length, 2.4 mm between contacts) and 1 Med-El medium 12-electrode contact array (24-mm linear insertion length, 1.9 mm between contacts) (Med-El, Innsbruck, Austria) were included (Table 1). Subjects included 8 men and 6 women with a mean age of 53 years (range, 21–62 years). A standard posterior tympanotomy approach was used in all cases. The implantation approaches were mixed and included pure round window (RW) insertions as well as cochleostomies just anterior to the RW with or without extension into the RW.
Demographic information for patients with cochlear implants
All patients gave written informed consent to participate in this institutional review board–approved study.
FPCT Imaging Protocol
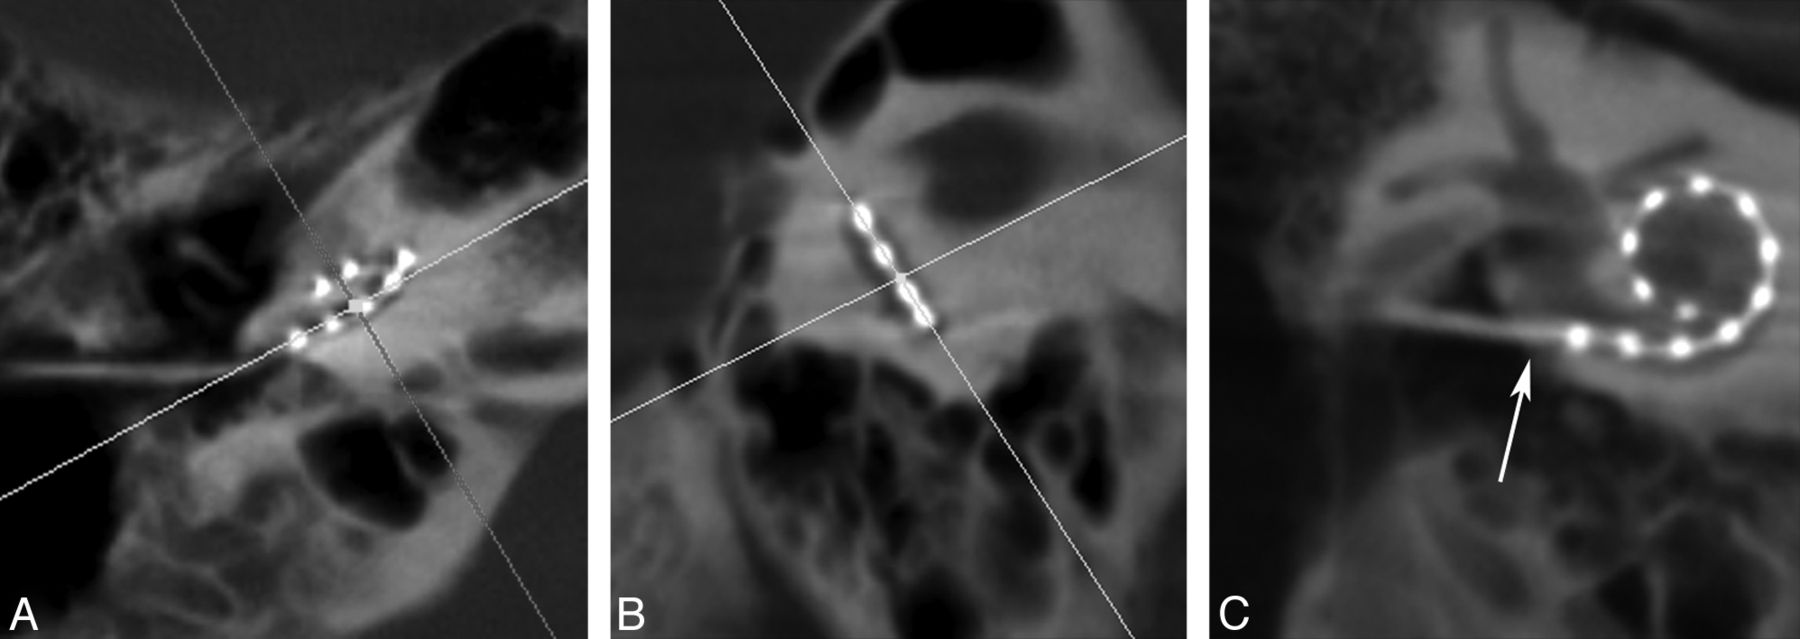
All subjects underwent FPCT (DynaCT; Siemens, Erlangen, Germany) evaluation on a flat-panel angiography system (Axiom Artis Zee, Siemens) with the use of commercially available software (Syngo DynaCT, Siemens). A collimated 20-second FPCT of the head (Fig 1A) was performed by use of the following parameters: 109 kV, small focus, 200° degree rotation angle, and 0.4° degree/frame angulation step. Postprocessing was performed on a commercially available workstation (Leonardo DynaCT, InSpace 3D software; Siemens). High-resolution secondary reconstructions (Fig 1C–D) were created with the use of the following parameters: manually generated voxels of interest to include only the electrode array; voxel size, 0.07–0.08 mm, 512 × 512 section matrix; HU and EE kernel types; and very smooth, normal, auto, and sharp image characteristics.

Flat panel CT of a right-sided cochlear implant. A, Collimated fluoroscopic acquisition for a 20-second FPCT of a right-sided CI. The skull above and below is excluded from the initial acquisition. B, Example of a coronal oblique image acquired after the default reconstruction. C, Secondary reconstruction by use of a manually generated voxel of interest is created to include only the electrode array. D, Higher-resolution coronal oblique image is generated after the secondary reconstruction.
An interventional neuroradiologist with fellowship training and subspecialty certification in diagnostic neuroradiology (M.S.P.) performed the postprocessing. All images were evaluated by all 3 authors: an interventional neuroradiologist with subspecialty certification in diagnostic neuroradiology (M.S.P.); a neuroscientist with >4 years of research dedicated to CIs (A.R.); and a neurotologist who is a CI specialist and has >15 years of experience in the field of CI (C.J.L.).
Reconstruction Parameters
The secondary reconstruction parameters available for postprocessing included kernel type (HU and EE) and image characteristic (very smooth, normal, auto, and sharp). Each kernel type was paired with each type of image characteristic to create the secondary reconstructions by use of a smaller manually generated VOI.
For each reconstruction, 2D multiplanar images were created. Coronal oblique images in the plane of the array were generated by aligning the multiplanar reconstruction axes on the axial and sagittal planes parallel to the basal turn and perpendicular to the modiolus (Fig 2). The section thickness was set to 3 mm to include all electrode contacts on one image. The window width and contrast level were adjusted until both the individual electrode contacts and surrounding labyrinthine structures were visualized.

Multiplanar reconstruction images of a right-sided cochlear implant. Multiplanar reconstruction axes are aligned parallel to the basal turn on the axial (A) and sagittal (B) planes to generate a coronal oblique (C) image of the CI. This image is rotated slightly to visualize the vestibule and superior semicircular canal. Arrow in (C) denotes the insertion point.
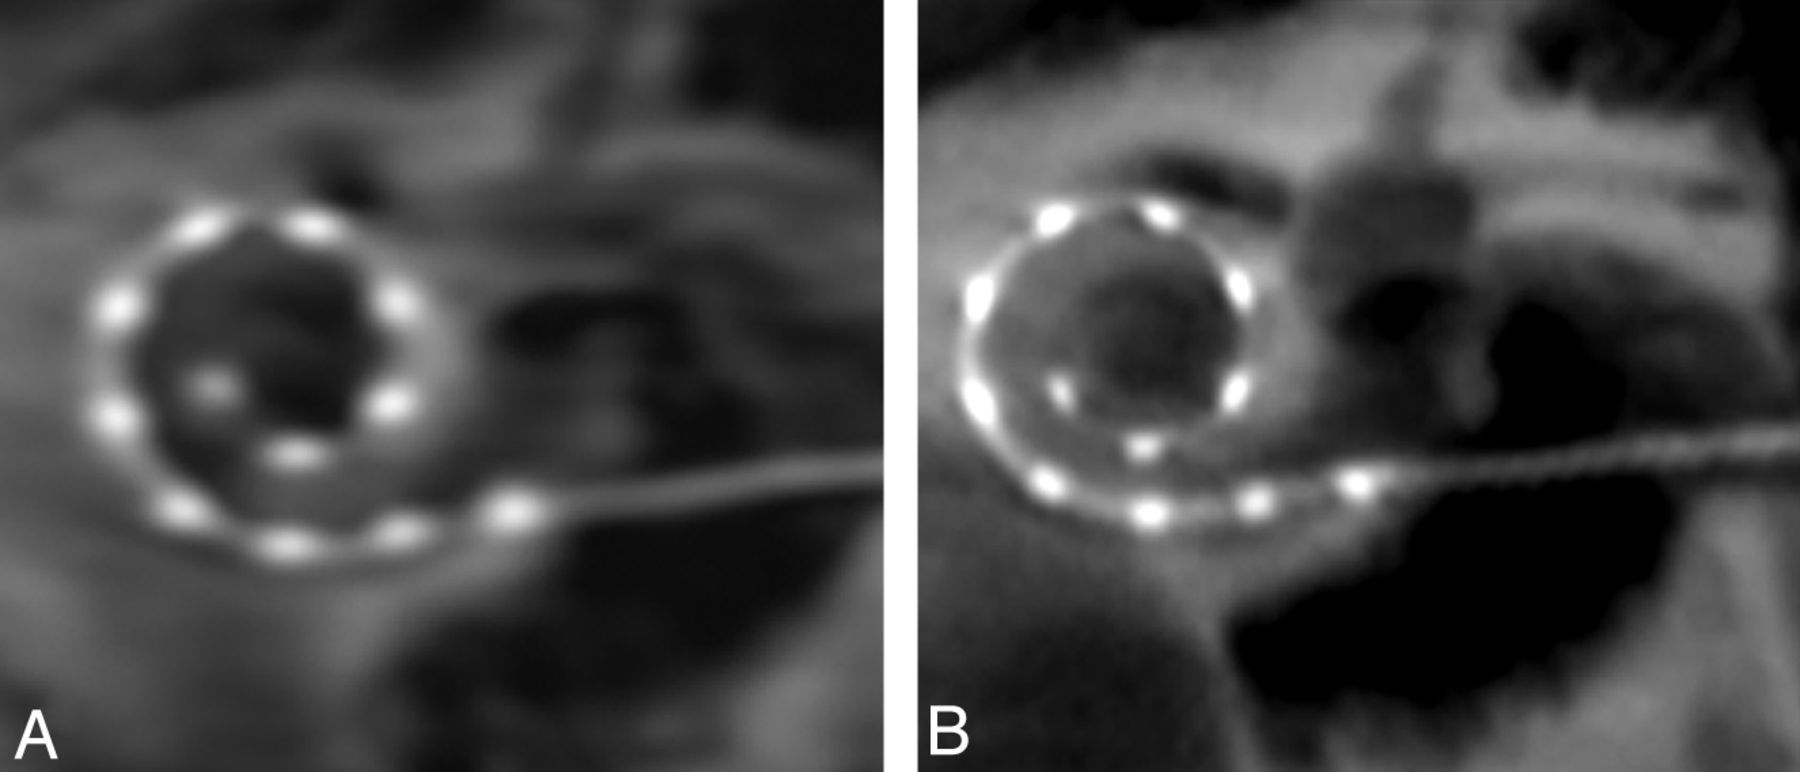
The individual electrode contacts appeared less distinct by use of the EE kernel type in comparison to the HU kernel type (Fig 3). All individual electrode contacts could be identified by means of all 4 types of image characteristics; however, the very smooth and normal types created images whose electrodes and surrounding osseous structures were blurry. More distinct contacts and osseous structures were apparent with the auto and sharp image characteristics. The combination of reconstruction parameters that produced the clearest depiction of the electrode array and surrounding labyrinthine structures were HU kernel type and sharp image characteristics (Fig 4).

Secondary reconstructions comparing edge enhancement (A) and Hounsfield unit (HU) (B) kernel type show more distinct individual electrode contacts and osseous structures on the image generated by HU kernel type.

Coronal oblique secondary reconstructions of the same patient with cochlear implants. These images illustrate the variable image quality obtained with identical 3-mm section thickness, window width (3681), contrast (1246), and kernel type (HU). Note the blurring and poor visualization of the electrode contacts with the very smooth (A) setting. A sharp (D) parameter produces optimal images with well-defined osseous structures and individual electrode contacts. (A) Very smooth, (B) normal, (C) auto, (D) sharp.
Visualization of Insertion Point and Individual Electrode Contacts
FPCT depicted all 18 insertion points and distinguished all 216 individual electrode contacts for all 14 patients (Fig 5A–R). This includes 1 patient (Fig 5I) with a Med-El medium 12-electrode contact array. A standard posterior tympanotomy approach was used in all subjects. Five of the 18 CIs were pure RW insertions (Table 1).

High-resolution secondary reconstructions of all 14 patients and 18 cochlear implants (CIs). A–I, Nine right-sided CIs, including 1 patient (I) with an implanted medium array, are shown in the coronal oblique plane. J–R, Nine left-sided CIs are depicted, all of which are the standard length array. Images are arranged in order of descending angular insertion depth. All 216 individual electrode contacts are clearly visualized in all patients.
Measuring Angular Insertion Depth
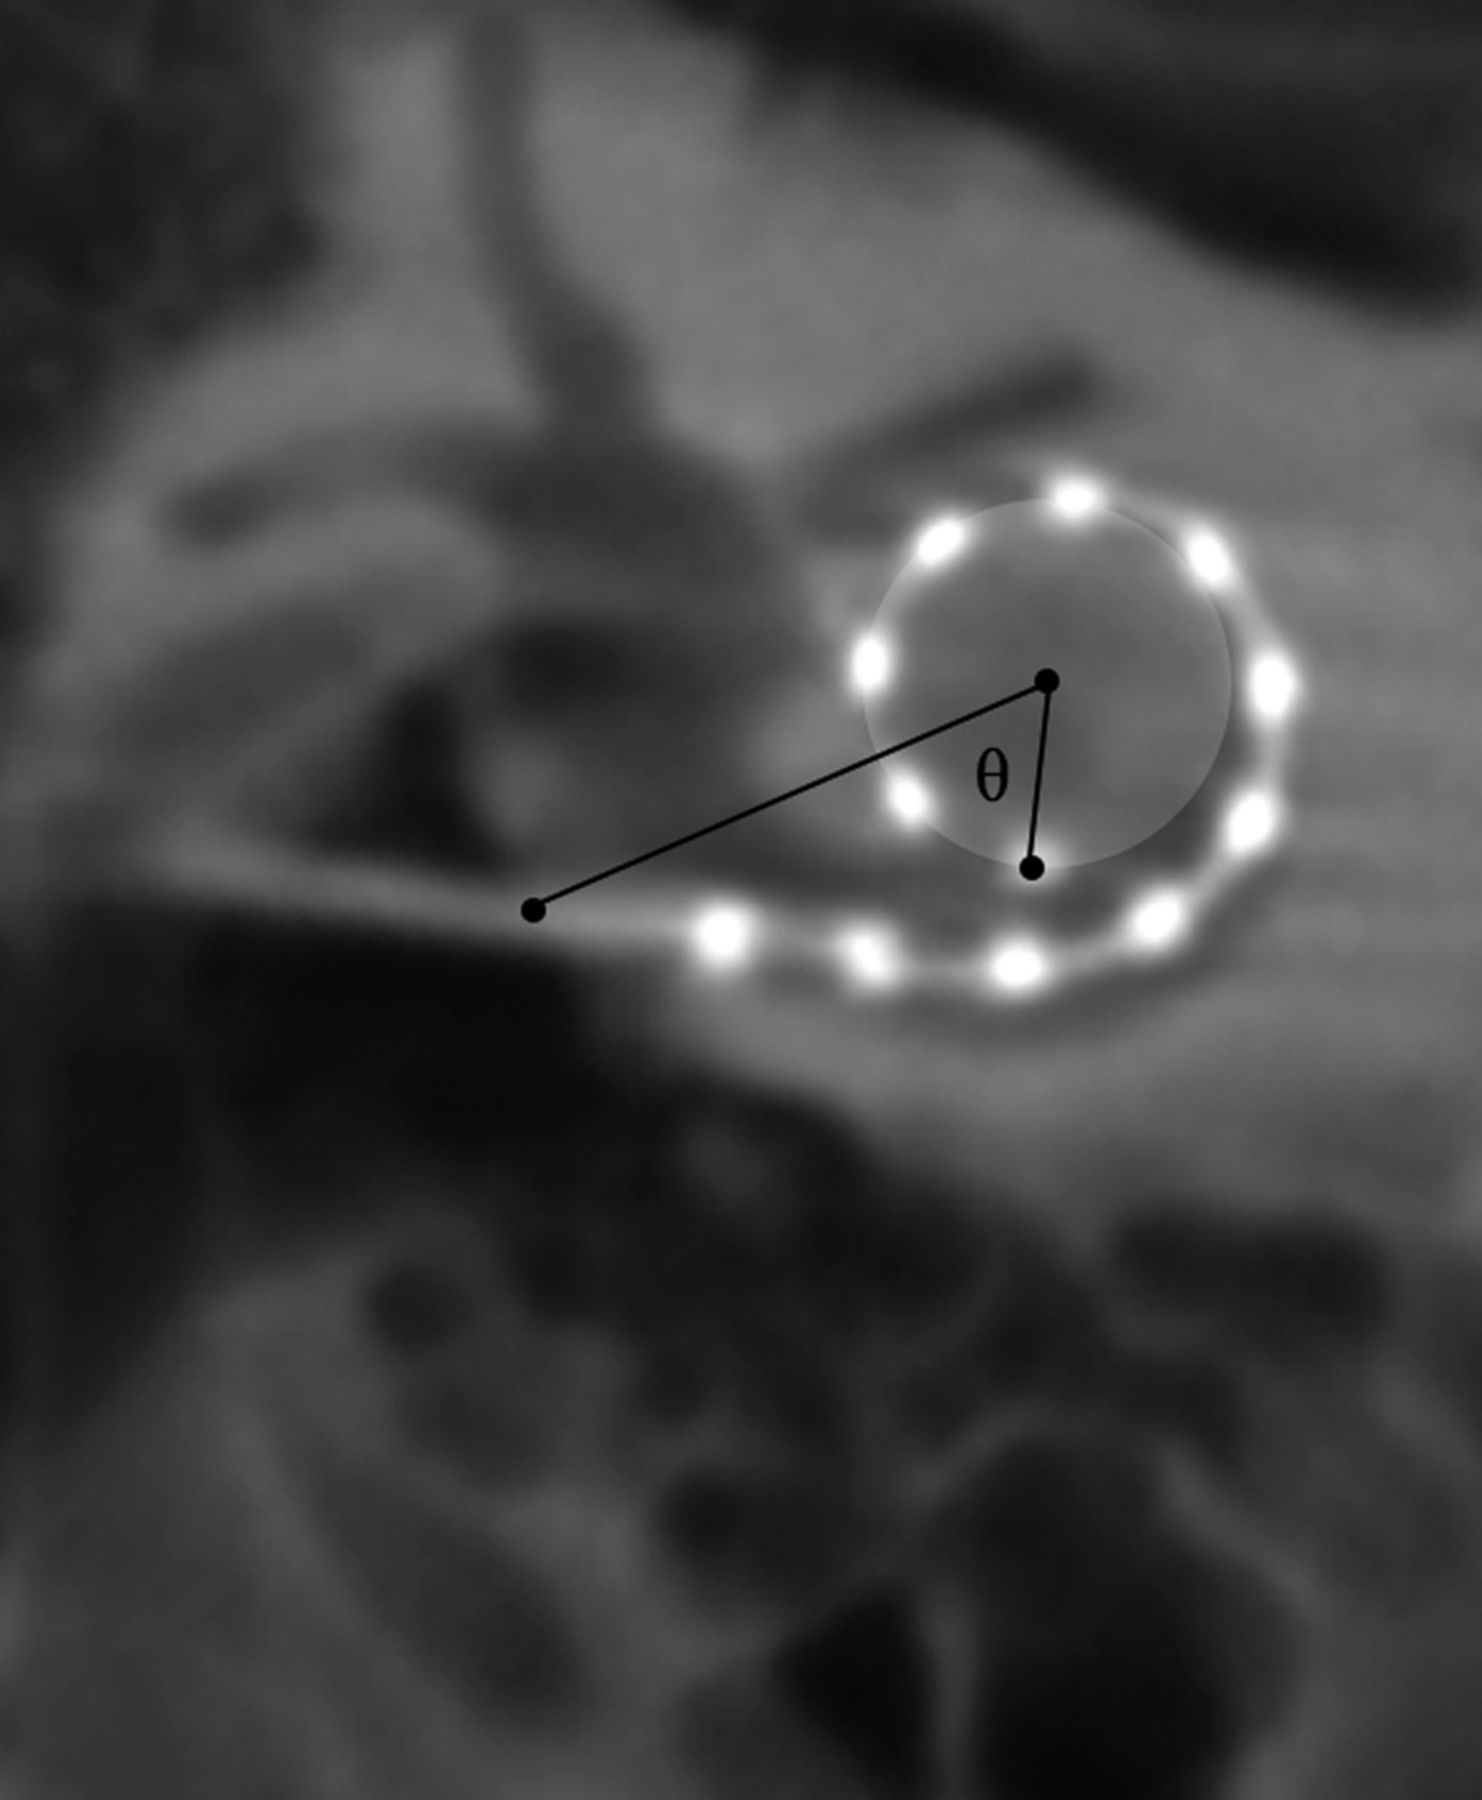
The 2D MPR section thickness was reduced to 0.1 mm to determine the electrode array insertion point, defined by the entrance of the electrode array from the middle ear into the lumen of the scala tympani. This was determined in the axial images at the air-to-bone interface along the outer margin of the electrode and then confirmed in the sagittal and coronal planes. The insertion point was designated in the coronal images and used as the first reference point for measuring angular insertion depth. With the use of a 3-mm section thickness, the 3 most apical electrodes were identified and used to create a circle depicting their course. A line drawn from the insertion point to the center of this circle served as the reference (zero degree) line. The angle θ between the most apical electrode and the reference line was calculated (Fig 6). This angle was subtracted from or added to 360 or 720, depending on the relationship between the apical electrode and the number of turns across the reference line (Table 2).

Method for calculating the angular insertion depth of the most apical electrode. The insertion point, as determined by the axial and sagittal images (not shown) is designated in the coronal oblique image. A circle whose outer circumference represents the trajectory of the 3 most apical electrodes is drawn. A reference line is drawn between the insertion point and the center of this circle. The most apical electrode is then identified and the angle θ is calculated between the electrode and the reference line. In this example, angular insertion depth is calculated by 360 ± θ.
Method for calculating angular insertion depth
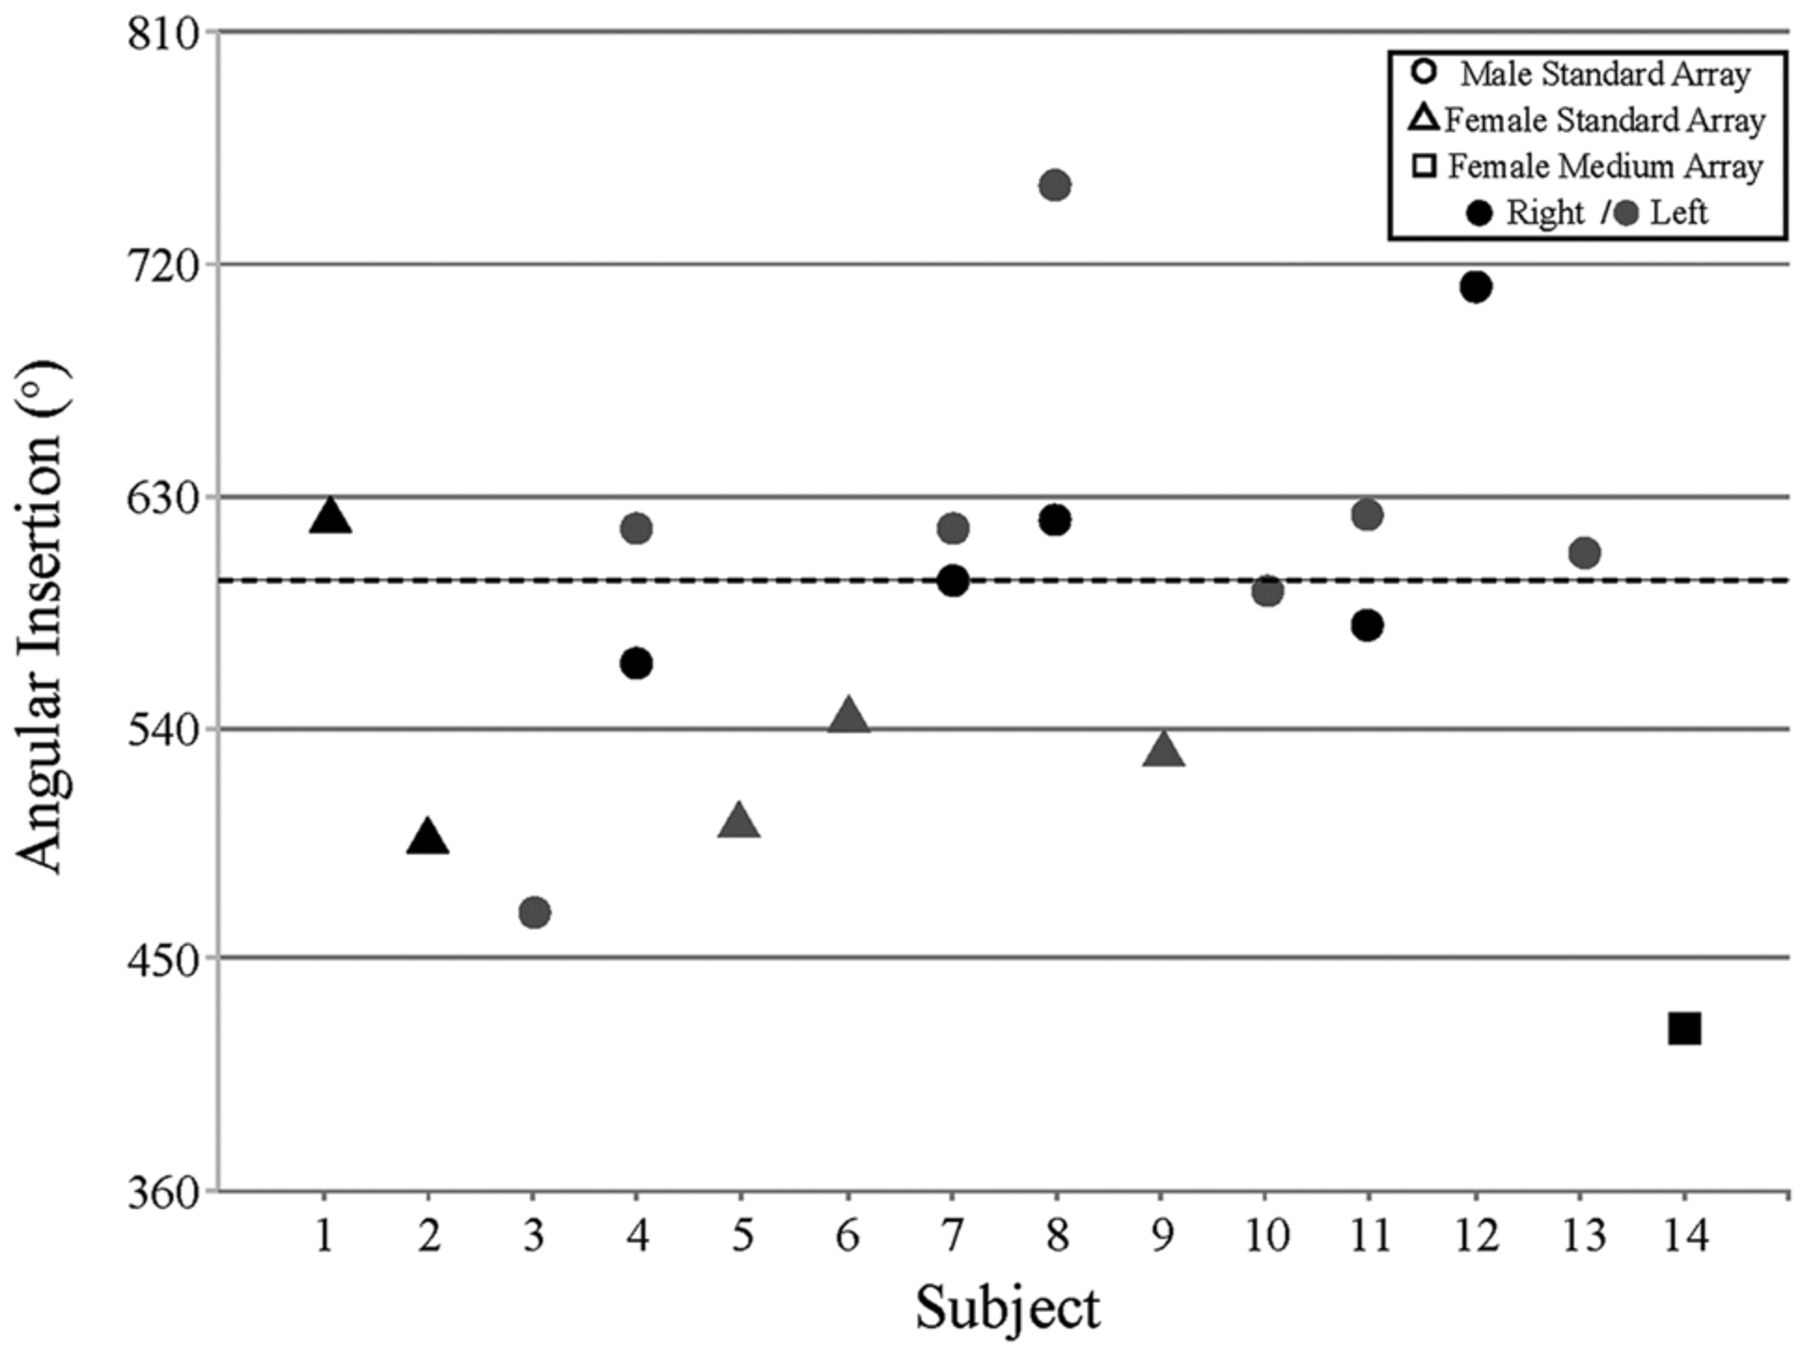
The mean apical electrode insertion depth for the standard 31.5-mm array was 519.1° (SD = 70.8; range, 468.8–749.0°). The apical insertion depth for the medium 24-mm array was 424.0° (Fig 7). There was no significant difference in the angular insertion depth between male (mean = 593.3; SD = 67.3) and female patients (mean = 541.9; SD = 47.9), t(11) = 1.81, P = .10, 2-tailed; however, this observation may be limited because of the small sample size in each group. Given the idiopathic etiology for hearing loss in 43% of our subjects (6 of 14; not an uncommon finding in this patient population) we did not specifically compare etiology with implant depth.

Measured angular insertion depth of the most apical electrodes. Circles and triangles depict angular insertion depth for male and female patients with Med-El 31.5-mm standard array, respectively. Square refers to the single Med-El 24-mm medium array patient. Black filled shapes depict a right implanted ear; gray filled shapes depict a left implanted ear.
DISCUSSION
Advances in CI design and implantation have been limited by the inability to assess individual electrode contact placement, reliably calculate angular insertion depth, and accurately determine the relationship of the electrode array to adjacent labyrinthine structures. These data provide important prognostic information and may play a critical role in CI outcomes.8
Imaging evaluation of postoperative CI placement was initially performed with plain radiographs in the Stenvers projection.9,10 MSCT replaced this method and has since become the reference standard imaging technique for assessing the electrode array location relative to intracochlear scalae, the electrode-modiolar interval, and the proximity of the electrode to the fallopian canal.6 CT offers the ability to provide 3D positional information and excellent contrast for different tissue types.11 Despite these advantages, however, attenuated bone structures within the acquisition field12 and metallic artifacts severely limit the visibility of electrode contacts and adjacent structures.10,13,14
FPCT is a relatively new imaging technique that creates less streak artifacts and offers higher spatial resolution than MSCT (cubic voxel size of approximately 0.07 mm versus 0.4–0.6 mm, respectively).7 These CT-like images can discern individual electrode contacts, often not possible on MSCT.2,7 In addition, FPCT has demonstrated improved imaging of the cochlea and facial nerve canal, enabling identification of electrode contacts in close proximity to the fallopian canal and therefore most prone to induce inadvertent stimulation of the facial nerve.2,15
Initial studies with the use of FPCT in the evaluation of CIs were performed with the use of cadaveric-implanted temporal bones.2,6,7 The authors noted potential limitations caused by the use of temporal bone specimens rather than whole skulls, which were thought to be more challenging for imaging purposes.2 Only recently have patients with CIs been evaluated by FPCT.3,16 Our study represents one of the larger series to date of CI assessment with FPCT (14 patients, 18 electrode arrays), and the only one to explore optimal reconstruction parameters, including secondary reconstruction techniques. In our series, FPCT was able to identify all 18 insertion points and all 216 individual electrode contacts as well as to identify surrounding labyrinthine structures that were not degraded by streak artifact. Secondary reconstructions of the initial FPCT dataset by use of a VOI to include only the electrode array created voxel sizes of 0.07–0.08 mm, allowing for higher-resolution images than initial reconstructions (Fig 1B–D). These datasets were optimized by use of an HU kernel type and sharp image characteristic, which enabled the distinct identification of individual electrode contacts and surrounding osseous and soft tissue structures. Figure 4 highlights the range of image quality obtained with different postprocessing algorithms and shows the advantages of the “sharp” algorithm, with better delineation of osseous structures and less blurring of the image.
FPCT could not clearly detect the basilar membrane to designate exact scalar location, which is consistent with previous reports.2 CT methods for this designation use oblique coronal images reconstructed perpendicular to the basal turn and parallel to the modiolus. The scalar position, however, is inferred in relation to the cochlear walls17 because the image resolution is insufficient to visualize the osseous spiral lamina and basilar membrane.18 Although we could infer the scalar position on the basis of the relative location of the CI in the cochlear chamber, this was not specifically attempted because definitive location could not be made or compared with any other standard. Additionally, given that an electrode may penetrate the basilar membrane and traverse >1 scalae, it is difficult to assume true location without visualizing distinct landmarks. Scalar localization will be the subject of future research as reconstruction algorithms and other advanced postprocessing techniques continue to improve. Whereas some reports cite the ability to clearly detect scalar position of the CI, the assessment of positioning within the scala tympani was primarily demonstrated in ex vivo specimens.16
The limitations of our report include the evaluation of only 1 CI manufacturer (Med-El; chosen for consistency during development of the imaging protocol), and the predominant assessment of CIs with electrode contacts spaced 2.4 mm apart (Med-El standard array), which are farther apart than some arrays currently available through other manufacturers. The distinct identification of individual electrode contacts was easily achievable, suggesting that this method should also distinguish more closely spaced contacts. Patient 14 (Fig 5I), implanted with the Med-El medium 12-electrode contact array, demonstrates the feasibility of visualizing electrode contacts spaced 1.9 mm apart. Currently planned studies will apply the FPCT technology with high-resolution secondary reconstruction algorithms to investigate other electrode designs and CI manufacturers.
CONCLUSIONS
FPCT evaluations of postoperative CIs are easy to perform, produce high-resolution images, and are able to depict all individual electrode contacts, thus enabling measurement of the angular insertion depth of the most apical electrode contacts. Optimal imaging methods use a high-resolution secondary reconstruction algorithm with a manually generated small VOI (voxel size, 0.07–0.08 mm), HU kernel type, and sharp image characteristic. These advances in CI imaging may lead to a better understanding of the relationship between cochlear anatomy, CI electrode placement, and auditory performance.
Footnotes
Disclosures: Monica Pearl—RELATED: Grant: Siemens Corporate Research,* Comments: Research grant, PI Monica Pearl; UNRELATED: Siemens Corporate Research,* Comments: Previous research support; Travel/Accommodations/Meeting Expenses Unrelated to Activities Listed: Siemens Corporate Research,* Comments: Travel expenses for ASNR meetings to present research. Alexis Roy—RELATED: Grant: Med-El Corporation, Comments: Med-El Corporation provided a grant to Johns Hopkins University for part of this work; however, they were not involved in data collection, analyses, or manuscript preparation. Charles Limb—RELATED: Grant: Med-El Corporation, Comments: Grant to study musical sound quality in cochlear implant users; UNRELATED: Consultancy: Advanced Bionics Corporation,* Comments: Research support given for project studying music perception in cochlear implant users; Expert Testimony: Karp Frosh law offices, Comments: Money received for expert case review; testimony pending; Payment for Lectures (including service on speakers bureaus): Academic and private honoraria for lectures on music cognition. Comments: No speakers bureaus; Royalties: Up-To-Date section editor, Chronic Otitis Media (*money paid to institution).
Support for this work was provided by research grants from Med-El Corporation (P.I. Charles Limb) and Siemens Corporate Research (P.I. Monica Pearl).
References
- Received August 13, 2013.
- Accepted after revision October 14, 2013.
- © 2014 by American Journal of Neuroradiology


Jump to section
Related Articles
Cited By...
- Cone-beam CT versus Multidetector CT in Postoperative Cochlear Implant Imaging: Evaluation of Image Quality and Radiation Dose
- Vestibular Implant Imaging
- Flat Panel Angiography in the Cross-Sectional Imaging of the Temporal Bone: Assessment of Image Quality and Radiation Dose Compared with a 64-Section Multisection CT Scanner