
Abstract
BACKGROUND AND PURPOSE: The shortcomings of synucleinopathy-based Parkinson disease staging highlight the need for systematic clinicopathologic elucidation and biomarkers. In this study, we investigated associations of proteinopathy and inflammation markers with changes in gray matter volume that accompany Parkinson disease progression.
MATERIALS AND METHODS: We prospectively enrolled 42 patients with idiopathic Parkinson disease, subdivided into early-/late-stage groups and 27 healthy controls. Parkinson disease severity and participants' functional and cognitive performance were evaluated. Peripheral plasma α-synuclein, β-amyloid42, and tau were quantified with immunomagnetic reduction assays, and nuclear DNA by polymerase chain reaction, and regional gray matter volumes were determined by MR imaging. Statistical tests identified stage-specific biomarkers and gray matter volume patterns in the early-stage Parkinson disease, late-stage Parkinson disease, and control groups. Correlations between gray matter volume atrophy, plasma biomarkers, Parkinson disease severity, and cognitive performance were analyzed.
RESULTS: Patients with Parkinson disease had significantly elevated α-synuclein, tau, and β-amyloid42 levels compared with controls; nuclear DNA levels were similar in early-stage Parkinson disease and controls, but higher in late-stage Parkinson disease (all P < .01). We identified 3 stage-specific gray matter volume atrophy patterns: 1) control > early-stage Parkinson disease = late-stage Parkinson disease: right midfrontal, left lingual, and fusiform gyri, left hippocampus, and cerebellum; 2) control > early-stage Parkinson disease > late-stage Parkinson disease: precentral, postcentral, parahippocampal, left superior-temporal, right temporal, right superior-frontal, and left cingulate gyri, occipital lobe, and bilateral parts of the cerebellum; 3) control = early-stage Parkinson disease > late-stage Parkinson disease: left midfrontal, superior-frontal and temporal, amygdala, and posterior cingulate gyri, caudate nucleus, and putamen. We discovered stage-specific correlations among proteinopathy, inflammation makers, topographic gray matter volume patterns, and cognitive performance that accompanied Parkinson disease progression.
CONCLUSIONS: Identifying associations linking peripheral plasma biomarkers, gray matter volume, and clinical status in Parkinson disease may facilitate earlier diagnosis and improve prognostic accuracy.
ABBREVIATIONS:
- Aβ
- β-amyloid
- AD
- Alzheimer disease
- CASI
- Cognitive Abilities Screening Instrument
- FDR
- false discovery rate
- GMV
- gray matter volume
- HC
- healthy control
- HY
- Hoehn & Yahr
- IMR
- immunomagnetic reduction
- MMSE
- Mini-Mental State Examination
- nDNA
- nuclear DNA
- PD
- Parkinson disease
- PDE
- early-stage PD
- PDL
- late-stage PD
- SE-ADL
- Schwab and England Activities of Daily Living scale
- T-tau
- total tau
- UPDRS
- Unified Parkinson's Disease Rating Scale
The degree of pathology from the onset of Parkinson disease (PD) to death is conventionally graded according to Braak staging, a neuroanatomic scheme based on the presence and spread of α-synuclein deposits in the brain (Lewy pathology).1 However, the validity of this “pure” synucleinopathy-based staging approach is controversial due to inconsistencies such as discrepancies between the pathologic stage and clinical symptoms.2 Recent studies have suggested that several coexisting misfolding proteins play important roles in the pathogenesis of PD, including cortical and limbic Lewy bodies,3 neurofibrillar tangles, senile plaques,4 and microglia.5 These heterogeneous etiologic pathways present challenges to formulating a unified staging model that encapsulates the entire disease course. Therefore, the systematic evaluation of sequential pathophysiologic and clinical changes in PD and of their mutual interactions is crucial.
In addition to synucleinopathy, it has been reported that cytotoxic intermediates of β-amyloid (Aβ) fibril formation and tau protein aggregates lead to neuronal disruption and death, while also causing symptoms commonly observed in Alzheimer disease (AD).6 Postmortem studies have confirmed the coexistence of AD-related misfolding proteins from early-to-late stage PD, indicating that rapid cognitive decline predicts poor prognosis in early PD.7,8 Furthermore, studies of CSF and serum biomarkers that indicate both Lewy body and AD pathology have garnered considerable interest.9⇓-11 Although CSF Aβ and tau levels in patients with PD have been reported to independently predict cognitive decline,12 data are inconclusive.13 The results of studies of the total α-synuclein level in CSF and peripheral plasma are also controversial.10,11 Explanations for such uncertainty may include, but are not limited to, methodologic variables and heterogeneous disease stages across participants in different studies. Moreover, levels of α-synuclein are exceptionally low in plasma compared with CSF, thereby limiting the capability of enzyme-linked immunosorbent assays to accurately detect plasma α-synuclein.14 More recently, immunomagnetic reduction (IMR), which has higher sensitivity than the conventional enzyme-linked immunosorbent assay,11 has been applied to assay Aβs, tau, and α-synuclein in human plasma11,15,16 and to confirm PD and AD diagnoses.11,17,18 These results suggest that IMR may help to clarify the relationship between different misfolding proteins and the progression of PD.
Apart from proteinopathy, inflammation in the CNS and peripheral blood could also contribute to neurodegeneration in PD.19 Cross-talk between the brain and peripheral inflammatory markers has been implicated in numerous psychologic, behavioral, and physiologic processes.20 However, research into the association between systemic inflammation and disease progression and their interactions with proteinopathy contributing to regional gray matter volume (GMV) changes is limited and warrants further investigation.
In the present study, we systematically investigated the complex associations among multiple plasma proteinopathies, Aβ42, total tau (T-tau), and α-synuclein; nuclear DNA (nDNA), as a marker of inflammation; and regional GMV changes during PD progression. We aimed to identify stage-specific patterns of plasma biomarkers and regional GMVs and stage-specific associations linking GMV patterns, biomarker levels, and clinical status.
MATERIALS AND METHODS
Participants
From August 1, 2017, to July 31, 2018, we prospectively enrolled 42 patients with a definitive diagnosis of idiopathic PD (Online Supplemental Data).21 Disease severity and functional status were evaluated in the “Off” state using the Unified Parkinson's Disease Rating Scale (UPDRS),22 the modified Hoehn & Yahr staging scale (HY stage),23 and the Schwab and England Activities of Daily Living scale (ADL).24 The Mini-Mental State Examination (MMSE)25 and Cognitive Abilities Screening Instrument (CASI)26 were used to assess general cognitive function. In addition, 27 sex- and age-matched healthy controls (HCs) without a medical history of neurologic or psychiatric disorders, alcohol/substance abuse, or head injury with similar education levels were enrolled.
The hospital Ethics Committee on Human Research approved the study protocol (No. 201601519B0) by Chang Gung Medical Foundation Institutional Review Board. All participants or their legally designated proxies provided written informed consent. To investigate the effects of disease stage on plasma biomarker levels and topographic GMV patterns, we further subdivided patients into 2 groups: early-stage PD (PDE, HY stage ≤2) or late-stage PD (PDL, HY stage >2).
Blood Sampling and Plasma Biomarker Assays
Plasma Aβ42, T-tau, α-Synuclein, and nDNA.
At the time of diagnosis of idiopathic PD, potential participants were informed of the study, and those who consented were asked to provide a 10-mL venous blood sample. The levels of multiple proteinopathies and nDNA were quantified using IMR and real-time polymerase chain reaction techniques, respectively. The processing procedures of plasma biomarker assays have been described in our previous studies11,18,27⇓-29 and documented in the Online Supplemental Data.
Structural MR Image Acquisition and Analyses
All participants underwent MR imaging within 1 week of peripheral plasma evaluation using a single 3T Signa (GE Healthcare) whole-body MR imaging system with an 8-channel phased array head coil. Whole-brain T1-weighted images were acquired using an axial 3D inversion recovery–prepared fast-spoiled gradient recalled-echo pulse sequence (TR/TE/TI = 9.5/3.9/450 ms; flip angle = 15°; number of excitations = 1; FOV = 24 cm; matrix size = 512 × 512; voxel size = 0.47 × 0.47 × 1.3 mm3; 110 contiguous slices without interslice gap and interpolation). To calculate individual regional GMVs, we first preprocessed MR images using the voxel-based morphometry approach and then calculated them with the composite anatomic atlas. The detailed image-preprocessing pipeline is documented in the Online Supplemental Data. Finally, the regional residualized GMVs, which regressed out the nuisance effects of age, sex, and total intracranial volume, were obtained.
Statistics
All statistical analyses were conducted using SPSS, Version 22.0 (IBM) and Matlab, Version R2010a (MathWorks). Figure 1 shows the analytic workflow, while details of the corresponding image and statistical analyses are as follows: 1) The ANOVA test, χ2 test, and ANCOVA were used to compare demographic variables and clinical evaluations between the HCs and the PDE/PDL groups. Statistical significance was defined as a 2-tailed P value < .05. All the continuous and categoric variables are presented as means and numbers, respectively. 2) For peripheral plasma biomarkers, we used the general linear model to adjust for the confounding effects of age and sex. The resulting residual value of each peripheral plasma biomarker was used for further analysis. We hypothesized that changes in peripheral plasma biomarkers and regional GMVs are associated with disease severity that would be most pronounced in patients with PDL and intermediate in those with PDE compared with HCs. We, thus, used the nonparametric Jonckheere-Terpstra test to determine the ordered differences among the 3 study groups. The significance threshold for the nonparametric Jonckheere-Terpstra test was set at the false discovery rate (FDR)–corrected P value < .05.30 3) Having established possible ordered differences in peripheral plasma biomarkers and regional GMVs, we then used pair-wise Mann-Whitney U tests to subdivide changing patterns of plasma biomarkers and regional GMVs into 3 categories each: plasma biomarkers, pattern 1 (control < PDE = PDL); pattern 2 (control < PDE < PDL and control < PDL); pattern 3 (control = PDE < PDL); and GMV, pattern 1 (control > PDE = PDL); pattern 2 (control > PDE > PDL and control > PDL); pattern 3 (control = PDE > PDL). This analysis revealed a high degree of collinearity between the GMV of different anatomic regions within the same stage-specific pattern; therefore, we used principal component analysis to identify the component accounting for the largest variances of GMVs in each of the 3 stage-specific patterns and calculated its weighting score for each participant. 4) Finally, we used nonparametric Spearman rank-order correlation tests to investigate associations among weighting scores of stage-specific GMV changes, peripheral plasma biomarkers, general cognitive ability, and disease severity.31 The significance threshold for the nonparametric Spearman rank-order correlation tests was set at the FDR-corrected P value < .05.

Analytic workflow. A, Whole-brain composite atlas generated from the SUIT and Hammer's Maximum Probability Atlas. B, Regional gray matter volume extracted with the composite atlas. C, The Jonckheere-Terpstra test and pair-wise Mann-Whitney U test are used to identify stage-specific patterns. D, Principal component analysis is used to extract weighting scores of the stage-specific GMV pattern. E, Spearman rank-order correlation tests are used to examine the potential associations among weighting scores of the stage-specific GMV pattern, peripheral plasma biomarkers, general cognitive performance, and disease severity. SUIT indicates Spatially Unbiased Infratentorial Template.
RESULTS
Demographic and Clinical Characteristics
The study cohorts included 42 patients with PD (26 PDE and 16 PDL) and 27 HCs. The demographic and clinical data for each group are shown in the Online Supplemental Data. Each group had a similar average age and male/female ratio. The HCs had significantly better MMSE and CASI than patients with PDE and PDL (mean [SD], MMSE: 28.0 [1.5] versus 25.3 [3.7] versus 23.6 [5.1], respectively, P < .001; CASI: 92.1 [3.9] versus 81.6 [14.3] versus 78.7 [14.2], P < .001). The patients with PD had lower total GMV and higher CSF volume compared with HCs while the patients with PDL had lower total GMV compared with the those with PDE.
Stage-Specific Plasma Biomarker Patterns
The Jonckheere-Terpstra test results retained all plasma biomarkers for post hoc tests that confirmed significantly higher α-synuclein, T-tau, and Aβ42 levels in patients with PD compared with the HCs (Fig 2A–C, Online Supplemental Data), but no difference between PDE and PDL, corresponding to pattern 1 (Control < PDE = PDL). In contrast, plasma nDNA levels were significantly higher in PDL than in PDE or controls, but similar between controls and PDE, corresponding to pattern 3 (control = PDE < PDL) (Fig 2D, Online Supplemental Data).

Stage-specific patterns of plasma biomarkers. Violin plots demonstrate residual values of each biomarker adjusted for age and sex in healthy controls (blue), patients with PDE (yellow), and PDL (pink). Red circles of in the violin plots show the median value of each plasma biomarker of each study group. Asterisks indicate statistically significant differences among study groups using pair-wise Mann-Whitney U tests (FDR-corrected, P < .05). JT indicates Jonckheere-Terpstra test.
Stage-Specific Pattern of Gray Matter Volume
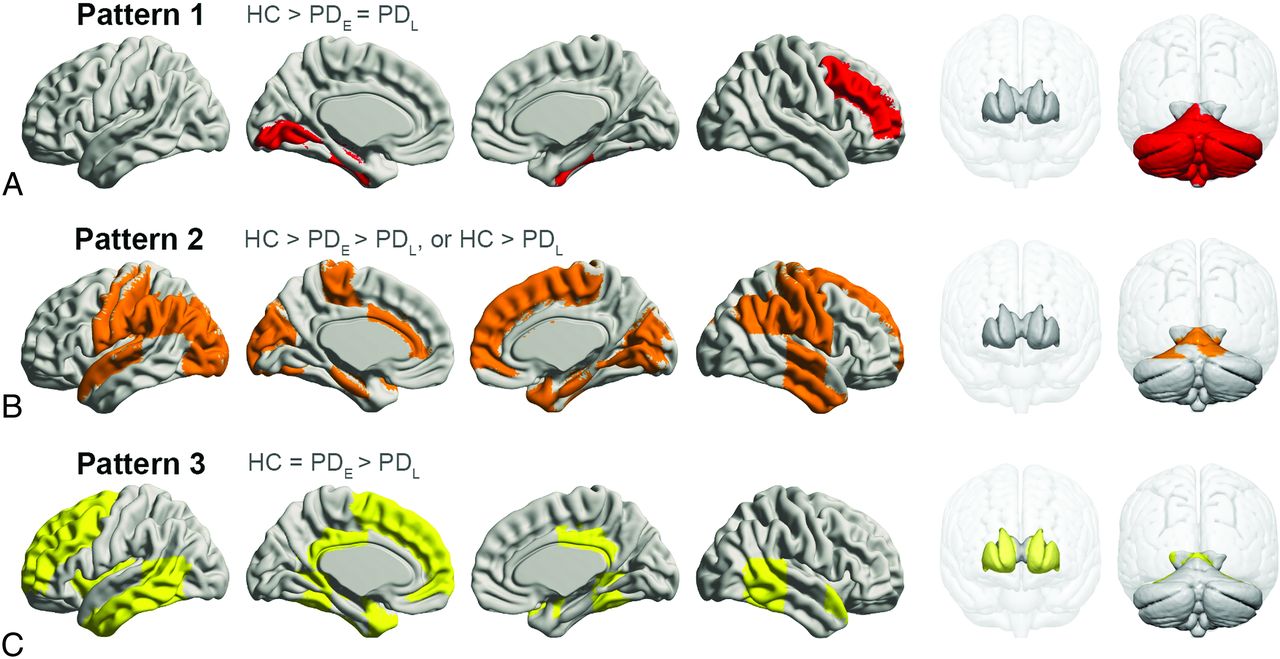
Most regions in GMV analyses passed the Jonckheere-Terpstra test (PFDR < .05); however, those eliminated included part of the frontal, parietal, and occipital lobes; the thalamus; and the insula. Post hoc tests further subdivided regional GMV patterns into 3 categories (Fig 3). Pattern 1 showed significantly lower GMVs in the PDE and PDL groups compared with controls, but no difference between the PDE and PDL groups in the right middle-frontal, left-lingual, and bilateral fusiform gyri; left hippocampus; and cerebellum. Pattern 2 featured progressive GMV atrophy with PD progression in the gyri including the bilateral precentral, postcentral, parahippocampal, left superior-temporal, right temporal, right superior-frontal, and left cingulate gyri in the occipital lobe and a small part of the bilateral cerebellum. In pattern 3, GMV was significantly lower in the PDL group compared with controls and the PDE group, but similar between controls and the PDE group, in the left middle-frontal, superior-frontal, temporal, and posterior cingulate gyri and in the bilateral amygdala, caudate nucleus, and putamen.

Spatial regions of stage-specific gray matter volume patterns. A, Pattern 1, red. B, Pattern 2, orange. C, Pattern 3, yellow.
Associations of Stage-Specific Patterns between Plasma Biomarkers and Weighting Scores of GMVs
Plasma T-tau exhibited a moderately negative correlation with GMV atrophy in all 3 patterns (ρ = −0.331, PFDR = .006; ρ = −0.334, PFDR = .005; ρ = −0.410, PFDR = .001) (Fig 4), whereas plasma α-synuclein showed a moderately negative correlation with only pattern 1 GMV atrophy (ρ = −0.390, PFDR = .001). Meanwhile, plasma nDNA showed a moderately negative correlation with only pattern 3 GMV atrophy (ρ = −0.333, PFDR = .005).

Associations among plasma biomarkers, weighting scores of stage-specific GMV patterns, disease severity, and cognitive performance. The hash tag indicates Spearman rank-order correlation analyses between disease severity and peripheral plasma biomarkers/weighting-score of stage-specific GMV patterns were conducted in patients with PD (PDE and PDL). SE-ADL indicates Schwab and England Activities of Daily Living scale.
Associations of Disease Severity, Cognitive Performance, Plasma Biomarkers, and Weighting Scores of GMVs
UPDRS II and total score were positively correlated with plasma nDNA levels (ρ = 0.515, PFDR < .001; ρ = 0.449, PFDR = .003) (Fig 4). The MMSE performance was negatively correlated with T-tau, α-synuclein, and nDNA levels (ρ = −0.263, PFDR = .029; ρ = −0.341, PFDR = .004; ρ = −0.241, PFDR = .046), while the CASI score was negatively correlated with α-synuclein and nDNA levels (ρ = −0.328, PFDR = .006; ρ = −0.285, PFDR = .018). However, misfolding protein levels exhibited no correlations with disease severity. The GMV atrophy pattern 2 correlated with the UPDRS II, HY stage, and ADL (ρ = −0.378, PFDR = .013; ρ = −0.379, PFDR = .013; ρ = 0.412, PFDR = .007). Pattern 3 correlated with UPDRS II and III, and total score, HY-stage, and ADL score (ρ = −0.412, PFDR = .007; ρ = −0.374, PFDR = .015; ρ = −0.409, PFDR =.007; ρ = −0.451, PFDR = .004; ρ = 0.426, PFDR = .005) (Fig 4). Patterns 1, 2, and 3 also correlated with the MMSE (ρ = 0.396, PFDR = .001; ρ = 0.403, PFDR = .001; ρ = 0.396, PFDR = .001). Patterns 1 and 3 correlated with the CASI (ρ = 0.274, PFDR = .023; ρ = 0.249, PFDR = .039).
DISCUSSION
The results of this study reveal that changes in protienopathy and inflammation biomarkers are associated with GMV atrophy during PD progression. This finding indicates that elucidation of the associations among plasma biomarkers, GMV changes, and clinical status in PD may facilitate earlier diagnosis and improve prognostic accuracy.
Both the PDE and PDL groups had higher plasma levels of α-synuclein, T-tau, and Aβ42 compared with the HCs, while nDNA levels were higher in the PDL than in PDE or HCs. Of note, levels of α-synuclein, T-tau, and Aβ42 were not associated with disease severity, and only UPDRS II and total score correlated with nDNA levels. GMV atrophy is pervasive as PD severity increases and can be temporally classified into 3 distinct patterns. These results are consistent with the hypothesis that α-synuclein, which is associated with GMV atrophy in the frontal lobe, hippocampus, and cerebellum, plays a potential pathogenic role in early PD, while nDNA may signify GMV atrophy in the late stage of PD. Most important, the plasma T-tau level is a cardinal marker of characteristic brain degeneration patterns in different stages of PD.
The elevated α-synuclein and T-tau levels noted in patients with PD herein are consistent with those in previous reports.2⇓⇓-5 α-synuclein is pathognomonic in the etiology of PD and is found in both CSF and plasma after exocytosis from neurons. Our findings support the growing evidence that elevated plasma α-synuclein offers potential as a biomarker to identify patients with PD.18 In a mouse model study, radiolabeled α-synuclein from an intracerebroventricular injection was diverted to the blood via exosome efflux.10 Higher plasma levels of α-synuclein in PD may be partially attributable to increased exosomal elimination of toxic α-synuclein buildup from the brain to peripheral blood. Previous studies have demonstrated an inverse relationship between α-synuclein levels in CSF versus plasma.32 This observation may reflect the deteriorating ability of the central nervous system to clear α-synuclein and increased sequestration of pathologic soluble α-synuclein in the brain, with consequently lower levels in CSF. However, further research is needed to clarify precisely how α-synuclein is transported from the central nervous system to peripheral blood.
Numerous Aβ plaques and tau-containing neurofibrillary tangles develop in up to 50% of patients with PDL, which may act synergistically with α-synuclein pathology to worsen prognosis. However, current data on CSF tau levels in PD are inconclusive.32 Our study results are consistent with a recent report of a high plasma T-tau level in parkinsonism, indicating a potential role for plasma tau IMR in screening for neurodegenerative diseases.27 Plasma Aβ42, which was also elevated in our PD cohorts, has been extensively studied in CSF.32 There is evidence that lower baseline CSF Aβ42 may predict subsequent cognitive decline and dementia in patients with PD.12,33 Although misfolded α-synuclein aggregation is considered a critical mechanism, the pathophysiology of PD is multifactorial. The comorbid associations of Aβ42 and tau deposition may be associated with cognitive deficits in PD.34 In terms of pathogenesis, amyloid-β (Aβ40 and Aβ42) is secreted by many types of cells and is normally found in the CSF; notably, studies have shown that Aβ42 can induce neuronal death.35,36 Thus, the elevated Aβ42 in this study indicates that potentially neurotoxic Aβ42 indeed increased in patients with PD.34⇓-36
The α-synuclein, T-tau, and Aβ42 levels in our study neither differentiated between PDE and PDL nor correlated with disease severity; however, α-synuclein and T-tau have been correlated with cognitive function, possibly implicating AD neuropathology in the cognitive deterioration of patients with PD. Thus, further IMR assay investigation of plasma misfolding–associated proteins may identify potential biomarkers for diagnosing PD and evaluating related cognitive deficits.11
Although progressive GMV atrophy has been well-documented in patients with PD, the topographic disposition during the disease course was hitherto unclear. Our systematic investigation revealed alterations in the right frontal lateral lobe, hippocampus, and bilateral cerebellum, in both PDE and PDL in pattern 1, with no significant differences between groups. The frontostriatal and limbic circuits, which are involved in dopaminergic activity, are commonly affected in early-stage PD but are not associated with a higher risk of subsequent dementia.37 A recent study also demonstrated widespread early changes in the structure and function of motor and cognitive cerebellar regions in patients with PD,38 though Braak staging does not specifically address such cerebellar features. These neuroanatomic changes are also correlated with plasma α-synuclein and T-tau levels, corroborating the role of synucleinopathy in PD and further indicating the possibility of tau co-pathology. Regardless of the cause of neuronal death, the areas in pattern 1 affected from PDE to PDL implicate the involvement of dopamine neuron substrates during the development of parkinsonian symptoms. Our results indicate that plasma α-synuclein may play a major pathophysiologic role in early GMV atrophy, particularly in the frontal lobe, hippocampus, and cerebellum. Therefore, α-synuclein-associated anatomies could act as markers of PD status.
The spatiotemporal progressive atrophic pattern 2 largely involves the posterior neocortices. Different neurotransmitters could also malfunction secondary to dopaminergic neuron loss or dopaminergic treatment, which may account for subsequent nonmotor impairment.39 Of note, this atrophy pattern was associated with plasma T-tau but not Aβ42. A study of AD has reported a weak association of Aβ with neurodegeneration, despite a strong link between Aβ and tau; however, tau was associated with brain atrophy.40 Correlations with higher plasma tau in all 3 patterns that we identified suggest that this biomarker is associated with characteristic topographic degeneration throughout the course of PD. Furthermore, PET studies in patients with dementia with Lewy bodies and PD41 have revealed abnormal tau binding distributions similar to those noted in our pattern 2 GMV atrophy. This finding suggests that the neuropathologic processes that drive tau deposition in PD reflect the same regional vulnerabilities as those driving tau deposition in AD. Thus, pattern 2 atrophy and the associated cognitive symptoms may be effective PD staging biomarkers.
In this study, the pattern 3 areas are mainly located in areas least involved in PD progression until the late stage. Their topographic distribution was consistent with those neocortices less affected in Braak stages V–VI, for both α-synuclein and tau pathology.1 We further demonstrated associations between plasma tau and nDNA levels. Oxidative stress and elevated neuroinflammation are considered important etiologies in PD19 and can be revealed by a marker of cell death, such as plasma DNA levels. The breakdown of the blood-brain barrier may release DNA into the plasma, which has been shown to correlate with structural changes in early-onset PD.42 Although prion transfection is the prevailing hypothesis in PD pathogenesis, there is growing evidence suggesting that misfolded protein accumulation is necessary but not sufficient to cause neurodegeneration, because the neurodegeneration occurs only in the environment of a specific innate immune response.43 Our plasma nDNA and tau findings are indicative of neurodegeneration in PDL.
Notwithstanding the strengths of this study, our findings should be interpreted in light of some limitations. Our study groups were selected to be as homogeneous as possible, and the relatively small age- and sex-matched PD cohorts may not fully represent the disease spectrum of PD. Given the exploratory design of this study, analyses were based on a simple grouping scheme according to the HY stage, which, though acceptable for general evaluation of disease status, may preclude investigation of subgroup patterns corresponding to different clinical phenotypes with similar disease severity. Elucidating potential relationships between stage-specific atrophic patterns and plasma biomarkers was also hindered by the cross-sectional design. Longitudinal studies may provide further insight into the vulnerability of distinct brain regions as well as their atrophy trajectories during the course of PD.
CONCLUSIONS
As with most neurodegenerative diseases, the clinicopathology of PD involves complex and dynamic interactions between several underlying etiologic mechanisms. This study revealed that multiple markers of proteinopathy and inflammation are associated with regional GMV atrophy. We herein identified plasma biomarkers that characterize stage-specific GMV atrophy patterns and clinical features in PD. Such biomarkers, possibly identified from different modalities and following validation in large, longitudinal cohorts may facilitate early diagnosis and improved accuracy of prognostic evaluation.
ACKNOWLEDGMENTS
This research was financially supported by the Brain Research Center, National Yang Ming Chiao Tung University from The Featured Areas Research Center Program within the framework of the Higher Education Sprout Project by the Ministry of Education (MOE) in Taiwan.
Dr David Neil, PhD, of Full Universe Integrated Marketing provided professional editorial services, and his colleague Pei Chi Kuo assisted with project management for manuscript preparation.
Footnotes
Statistical analysis was conducted by Wei-Che Lin, MD, PhD, Department of Diagnostic Radiology, Kaohsiung Chang Gung Memorial Hospital, Chang Gung University College of Medicine, 123 Ta-Pei Rd, Niao-Sung, Kaohsiung 83305, Taiwan; e-mail: u64lin{at}yahoo.com.tw
This study received funding from the Ministry of Science and Technology, (MOST 106-2314-B-182A-031-MY2 to W.-C.L.; CORPG8L0191 to W.-C.L.; and MOST 107-2221-E-010-010-MY3, to K.-H.C.).
Indicates open access to non-subscribers at www.ajnr.org
References
- Received October 11, 2020.
- Accepted after revision March 17, 2021.
- © 2021 by American Journal of Neuroradiology


Jump to section
Related Articles
Cited By...
- No citing articles found.