
Abstract
BACKGROUND AND PURPOSE: While brain iron dysregulation has been observed in several neurodegenerative disorders, its association with the progressive neurodegeneration in Niemann-Pick type C is unknown. Systemic iron abnormalities have been reported in patients with Niemann-Pick type C and in animal models of Niemann-Pick type C. In this study, we examined brain iron using quantitative susceptibility mapping MR imaging in individuals with Niemann-Pick type C compared with healthy controls.
MATERIALS AND METHODS: A cohort of 10 patients with adolescent- and adult-onset Niemann-Pick type C and 14 age- and sex-matched healthy controls underwent 7T brain MR imaging with T1 and quantitative susceptibility mapping acquisitions. A probing whole-brain voxelwise comparison of quantitative susceptibility mapping between groups was conducted. Mean quantitative susceptibility mapping in the ROIs (thalamus, hippocampus, putamen, caudate nucleus, and globus pallidus) was further compared. The correlations between regional volume, quantitative susceptibility mapping values, and clinical features, which included disease severity on the Iturriaga scale, cognitive function, and the Social and Occupational Functioning Assessment Scale, were explored as secondary analyses.
RESULTS: We observed lower volume in the thalamus and voxel clusters of higher quantitative susceptibility mapping in the pulvinar nuclei bilaterally in patients with Niemann-Pick type C compared with the control group. In patients with Niemann-Pick type C, higher quantitative susceptibility mapping in the pulvinar nucleus clusters correlated with lower volume of the thalamus on both sides. Moreover, higher quantitative susceptibility mapping in the right pulvinar cluster was associated with greater disease severity.
CONCLUSIONS: Our findings suggest iron deposition in the pulvinar nucleus in Niemann-Pick type C disease, which is associated with thalamic atrophy and disease severity. This preliminary evidence supports the link between iron and neurodegeneration in Niemann-Pick type C, in line with existing literature on other neurodegenerative disorders.
ABBREVIATIONS:
- ANTs
- Advanced Normalization Tools
- GRE
- gradient recalled-echo
- MABS
- Multi-Atlas Brain Segmentation
- NPC
- Niemann-Pick type C
- NUCOG
- Neuropsychiatry Unit Cognitive Assessment Tool
- QSM
- quantitative susceptibility mapping
- QSMART
- Quantitative Susceptibility Mapping Artifact Reduction Technique
- SOFAS
- Social and Occupational Functioning Assessment Scale
Niemann-Pick type C (NPC) is a rare genetic lysosomal storage disease characterized by defective intracellular lipid transport mechanisms, which result in the intracellular accumulation of cholesterol and glycosphingolipids, primarily in the brain, spleen, and liver. Brain involvement in NPC gives rise to numerous neurologic and neuropsychiatric presentations such as developmental delay, movement disorders, progressive cognitive decline, and psychosis.1 Neuroimaging studies have reported marked volume loss in the cerebellum, thalamus, hippocampus, and basal ganglia in NPC. Widespread defects in myelination and reduced fractional anisotropy have also been observed in the brains of individuals with NPC.1 The exact pathophysiologic processes through which the gene mutations in NPC lead to neurodegeneration are not as yet fully understood. Possible mechanisms that have been proposed include oxidative stress,2⇓-4 neuroinflammation,5 and Tau pathology.6⇓-8 A clearer understanding of the intrinsic drivers of neuropathology in NPC is needed to provide avenues for the development of therapeutic interventions.
One possible pathophysiologic mediator of brain changes in NPC is the dysregulation of iron. Iron is a crucial element in myelin synthesis, neurotransmitter production, and mitochondrial energy metabolism,9 in addition to serving a central role in neurodevelopment.10 Excessive iron, however, has been shown to be neurotoxic by contributing to oxidative stress and ferroptosis.11,12 In fact, a recent review summarized the existing neuroimaging evidence demonstrating iron accumulation in the specific brain regions that are most implicated in the pathology of neurodegenerative disorders (for a review see Ravanfar et al,13 in 2021). In NPC, there is evidence suggesting abnormal systemic and brain iron regulation. More specifically, histochemical examinations have identified diminished ferritin, the main iron storage unit, in various tissue types in individuals with NPC,14,15 which can lead to abnormal distribution of iron throughout the body. Furthermore, Hung et al16 reported a lower concentration of iron in the CSF in individuals with NPC and a trend toward increased iron content in postmortem cerebellar tissue in patients with NPC and healthy controls. Most important, in mouse models of NPC, Hung et al found an increased iron concentration in the brain along with decreased iron in the liver and spleen, suggesting that the abnormalities in systemic iron may involve the brain. However, due to the limitations in conducting human in vivo studies to examine iron in the central nervous system, the existing literature is limited in this area.
Technological advancements in neuroimaging, such as quantitative susceptibility mapping (QSM), have provided the tools for the in vivo evaluation of brain iron. Accordingly, in this study, we conducted an in vivo investigation of brain iron in individuals with NPC compared with healthy controls using QSM at ultra-high-field 7T MR imaging. Most important, this ultra-high-field imaging provides an increased contrast-to-noise ratio in QSM and enables the identification of smaller effect sizes compared with lower field strengths.17
Following from the available animal and human data, we hypothesized that individuals with NPC would evince altered levels of iron in key brain regions that undergo neurodegeneration in NPC, specifically the thalamus, striatum, and the hippocampus.18 Furthermore, we hypothesized that such alterations would be associated with volume loss in these brain regions and the severity of clinical symptoms in patients with NPC.
MATERIALS AND METHODS
Standard Protocol Approvals, Registrations, and Patient Consents
This study was approved by the Melbourne Health Human Research Ethics Committees (HREC2012.066) and the Australian Research Infrastructure Network (ARIN – 7T-2015.005, CFMS No. MRI495000045). Written informed consent was obtained from all participants and/or their legal guardians before their enrollment in the study.
Study Population
This study was conducted as a prospective case-control study from April 2019 to December 2019. Ten individuals diagnosed with adolescent- and adult-onset NPC based on clinical features and confirmed with genetic testing for NPC1 disease-causing mutations were enrolled at the Royal Melbourne Hospital. Because there are no existing neuroimaging studies of brain iron in NPC and considering the rarity of this disease, a study population of 10 for the NPC group was deemed an achievable sample size for this study. Fourteen age- and sex-matched healthy individuals were recruited from the general community in the local metropolitan area through online advertisement. A history of any other neurologic conditions (including head injury and seizures), systemic diseases (eg, inflammatory disorders, diabetes, and impaired thyroid function), current pregnancy, breastfeeding, and MR imaging contraindications (eg, magnetic metal implants and claustrophobia) were considered exclusion criteria for both healthy and NPC groups. A personal or family (first degree relative) history of any psychiatric and neurologic illness, psychopathology that impacts functioning, and past or current use of any psychoactive medication were considered as additional exclusion criteria for the control group.
Imaging Methods
MR imaging was performed using a 7T MR imaging scanner (Magnetom Terra 7T; Siemens) with a 1TX / 32Rx head coil (Nova Medical). For the T1 structural images, an MP2RAGE sequence was obtained with the following parameters: TE = 2.89 ms, TR = 4900 ms, matrix size = 256 × 232 × 192, voxel size = 0.9 mm isotropic, acquisition time = 5:25 minutes. For QSM reconstruction, a multiecho gradient recalled-echo (GRE) sequence was acquired with the following parameters: number of echoes = 9, first TE = 5.1 ms, ΔTE = 2.04 ms, TR = 24 ms, flip angle = 13°, matrix size = 280 × 242 × 192, voxel size = 0.75 mm isotropic, acquisition time = 8:42 minutes.
Processing of Neuroimaging Data
Structural T1.
T1 images were used for anatomic labeling and segmentation of the ROIs. Brain masks were constructed using the Multi-Atlas Brain Segmentation (MABS) tool (https://github.com/pnlbwh/PNL-manual#multi-atlas-brain-segmentation-mabs). Generated binary masks were visually assessed and manually corrected using ITK-SNAP, Version 3.8 (http://www.itksnap.org/)19 by an investigator blinded to participant groups.
The striatum (the putamen and caudate nucleus), hippocampus, and thalamus were selected as the ROIs for the ROI-based comparison of mean QSM values between groups. The putamen, caudate nucleus, and thalamus were automatically segmented using the Multiple Automatically Generated Templates Brain Segmentation (MAGeT-Brain; https://github.com/CobraLab/MAGeTbrain) pipeline20 with the CIT168 atlas.21 Automatic segmentation of the hippocampus was performed using FreeSurfer, Version 7.1.0 (http://surfer.nmr.mgh.harvard.edu). Label maps generated by MAGeT-Brain and FreeSurfer for the study ROIs were merged into single files for each subject, visually inspected, and manually corrected in all cases using 3D Slicer, Version 4.11 (https://www.slicer.org)22 by an investigator under the guidance and quality assessment of 2 senior neuroanatomists, all of whom were blinded to participant groups.
QSM Processing.
The Quantitative Susceptibility Mapping Artifact Reduction Technique (QSMART) pipeline23 was used to construct QSM maps using the phase and magnitude components of the GRE sequence. Briefly, a brain mask was generated using the FSL Brain Extraction Tool (http://fsl.fmrib.ox.ac.uk/fsl/fslwiki/BET).24 After phase unwrapping using a Laplacian-based method25 for each echo, multiecho data were combined using a magnitude-weighted least squares echo fitting method. A 3D spatially dependent filtering26 and iterative least-squares (iLSQR) decomposition were subsequently used for background field removal and field-to-source inversion, respectively. Details of this method were further explained in Yaghmaie et al,23 in 2021. In QSM processing, magnetic susceptibility is commonly estimated and reported relative to a reference region in the brain that is assumed to be unaffected by disease pathology and, therefore, expected to have similar QSM across study groups.27 In NPC, we expect a generalized involvement of the brain regions by disease pathology. Hence, in this study, we did not use a reference region for QSM processing. Magnetic susceptibility values reported by the QSMART pipeline are inherently referenced to the magnetic susceptibility of water.
Voxelwise QSM Comparison between Groups.
To compare the QSM values in the entire brain between the 2 groups, we performed a probing voxelwise comparison of QSM between groups. To transform all QSM images to a common template, we first created a study template from all participants’ skull-stripped T1 images using the antsMultivariateTemplateConstruction2 tool from Advanced Normalization Tools, Version 2.3.5 (ANTs; https://github.com/ANTsX/ANTs/).28 For each subject, affine and nonlinear transformations were constructed from the subject T1 to the study template using antsRegistrationSyN tool from ANTs. Additionally, for each subject, we conducted a rigid transformation from the non-skull-stripped first-echo magnitude image of the GRE sequence to the T1 image using ANTs. The “GRE-to-T1” rigid transform and the “subject-to-study template” affine + nonlinear transforms were sequentially applied to each participant’s QSM to warp it to the common study template.
ROI-Based QSM Comparison.
To compare mean QSM values in the putamen, caudate nucleus, globus pallidus, thalamus, and hippocampus between groups, we overlaid the label maps generated from the brain segmentation step onto the QSM images by inversely applying the rigid transform from the GRE-to-T1 acquisitions generated in the previous step. Mean intensity values on QSM images (magnetic susceptibility) were extracted in each ROI for comparison between groups.
Clinical Assessments.
For individuals with NPC, the treating physician conducted and reported clinical evaluations of disease severity using the Iturriaga scale,29 cognitive performance using the Neuropsychiatry Unit Cognitive Assessment Tool (NUCOG),30 and global functioning capacity using the Social and Occupational Functioning Assessment Scale (SOFAS).31
Statistical Analysis.
We tested groups for age and sex differences using an independent samples t test and a χ2 test, respectively. To compare ROI volumes between groups, we used the ANCOVA test with total brain volume as a covariate and 5000 bootstraps. We used skull-stripped brain images as inputs for FreeSurfer to improve the accuracy of segmentations. Therefore, the total intracranial volume was not obtainable from the FreeSurfer outputs. Total brain volume was calculated by the summation of all gray and white matter volumes from the label maps provided by FreeSurfer, to exclude any intracranial space occupied by the CSF.
Voxelwise comparison of QSM between groups was conducted using the Randomize tool in FSL (http://fsl.fmrib.ox.ac.uk/fsl/fslwiki/Randomise/UserGuide), with age as covariate, 5000 permutations, and threshold-free cluster enhancement32 family-wise error rate correction.33 ROI-based between-group comparison of QSM was performed using ANCOVA, with age and volume of each ROI as covariates with 5000 bootstraps. To limit the number of covariates in the statistical models and considering that most of the QSM studies have not observed an effect of sex on brain iron,34,35 we did not include sex as a covariate in our models. In these analyses, correction for multiple comparisons was performed using the Benjamini-Hochberg method,36 with a false detection rate of 0.05. An α = .05 was considered the significance threshold. All the above statistical tests were performed using SPSS (Version 24; SPSS Statistics for Mac; IBM).
As secondary analyses, we examined the partial correlation between volume and QSM in the brain regions that showed a significant difference between groups, controlling for the effect of age. Furthermore, we explored the partial correlation between mean QSM (controlling for age) and volume (controlling for total brain volume) in the ROIs with clinical assessments. We conducted these analyses using the Pearson correlation test. Data preparation, statistical analyses, and data visualization were conducted using R Studio (http://rstudio.org/download/desktop) 2021.09.0 Build 351 “Ghost Orchid” Release37 operating on R version 4.1.2, using the psych 2.1.9,38 corrplot 0.92,39 corx 1.0.6.1,40 tidyverse 1.3.1,41 readxl 1.3,42 ggplot2,43 and dplyr 1.0.744 packages.
Data Availability.
Data sets extracted from study participants’ MR imaging acquisitions will be shared by request from any qualified investigator. Raw de-identified neuroimaging data can be made available on requests from investigators, subject to approval from the Human Research Ethics Committee and signing a data-sharing agreement.
RESULTS
Demographic, clinical, and neuroimaging data were analyzed from all 10 individuals with NPC and 14 healthy control participants. All patients with NPC had mutations in the NPC1 gene. Seven of 10 patients in the NPC group were on active treatment with miglustat. Data sets from all participants were complete and met the required quality for analysis. Table 1 presents a summary of the demographic and clinical information of the study population. Age and sex were not statistically different between groups.
Demographic description and comparison of the study population
ROI Volumetric Comparisons
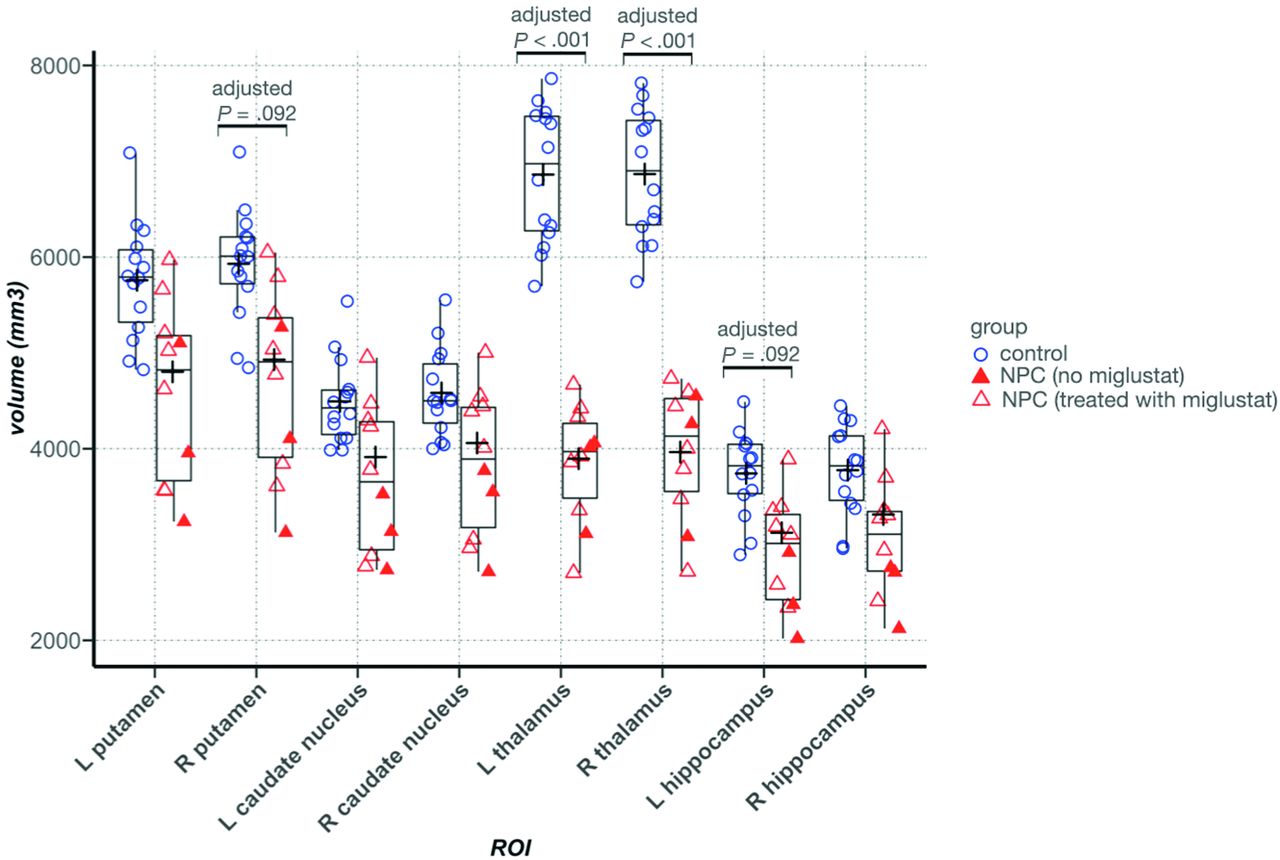
In individuals with NPC, the volume of the thalamus was significantly lower bilaterally (left: 3846.4 versus 6861.1 mm3, adjusted P = .002, η2p = 0.85; right: 3964.6 versus 6866.3 mm3, adjusted P = .002, η2p = 0.82), and there was a trend toward lower volume in the left hippocampus (2916.7 versus 3741.7 mm3, adjusted P = .08, η2p = 0.20). In all other ROIs, although average volumes were lower in the NPC group, the differences were not statistically significant (Online Supplemental Data and Fig 1).

Between-group comparison of volume in the ROIs. In the Tukey boxplots, the middle line of each box indicates the median, upper and lower boundaries of the boxes show the upper and lower quartiles, respectively; the upper and lower whiskers show the maximum and minimum data points; and the cross signs indicate the mean in each group. Filled triangles represent data points from patients with NPC who were not taking miglustat. Error bars indicate SDs. L indicates left; R, right.
Voxelwise QSM Comparison
In NPC, whole-brain voxelwise comparison of QSM between groups showed clusters of significantly higher QSM in the posterior segment of the right (223 voxels, center of mass in Montreal Neurological Institute 152 space: X = 17.2 mm, Y = −28.7 mm, Z = 3.37 mm) and left (245 voxels, center of mass in Montreal Neurological Institute 152 space: X = −17.2 mm, Y = −29.9 mm, Z = 2.47 mm) thalamus, consistent with the anatomic location of the pulvinar nucleus. Furthermore, we observed a large cluster (30,764 voxels) of lower QSM in the NPC group, spread across the white matter, including the bilateral parietal lobes, corpus callosum, and white matter surrounding the hippocampi (Fig 2).

Voxelwise between-group comparison of QSM. A, Lightbox axial view with 4-mm section spacing. The yellow-red spectrum indicates clusters with higher QSM, and the blue-to-light blue spectrum shows clusters with lower QSM values in the NPC group compared with healthy controls. B, A visualization of the thalamus with clusters that show significant between-group QSM difference. Red and blue indicate higher and lower QSM in the NPC group compared with the control group, respectively. Clusters with increased QSM in NPC, depicted in red, are in the posterior part of the thalamus, consistent with the anatomic location of the pulvinar nucleus.
ROI-Based QSM Comparison
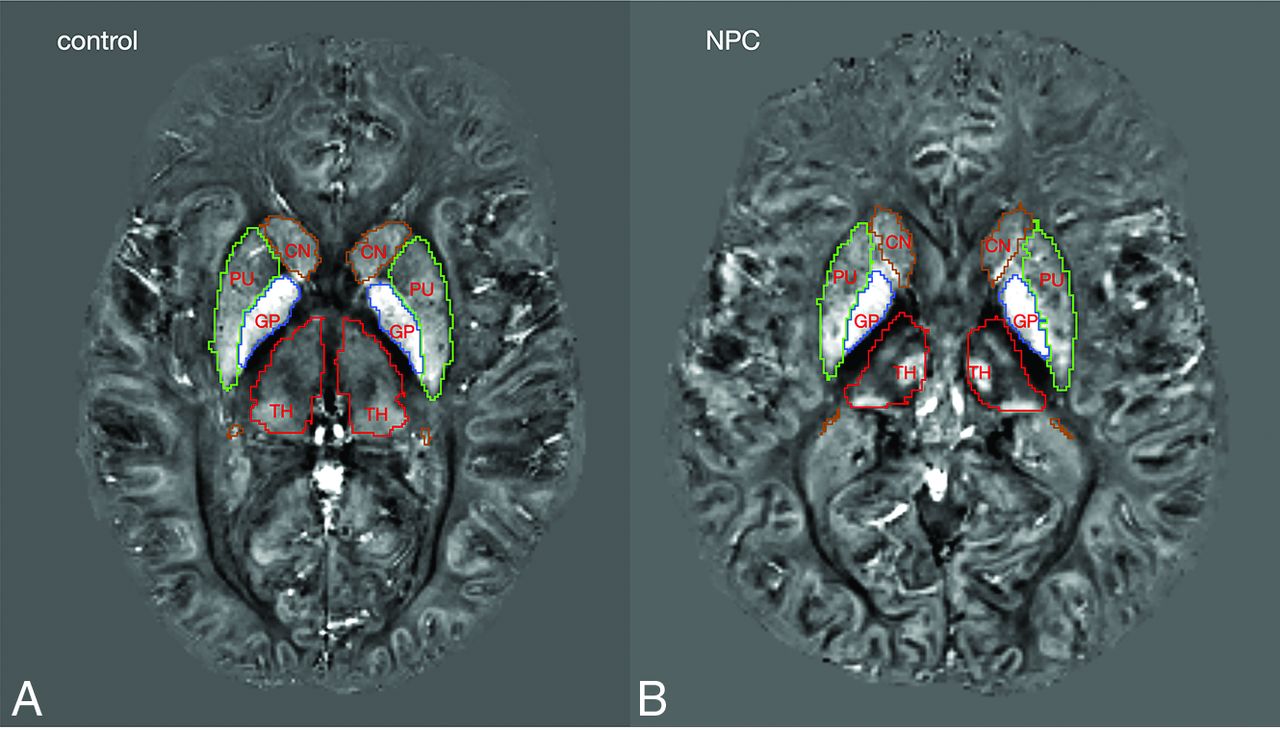
Between-group comparison of mean QSM values in the ROIs showed significantly lower magnetic susceptibility in the right hippocampus in the NPC group after correction for multiple comparisons. In the other ROIs, we did not find any significant difference between groups. In the thalamus, despite the presence of clusters with higher and lower QSM, the mean QSM value was not significantly different between groups and was lower in NPC (Table 2). Figure 3 provides representative QSM images from subjects in the NPC and control groups. In Fig 4, treatment status with miglustat is demonstrated on each of the data points. Due to the limited number of patients in the treatment subgroups, statistical analysis based on treatment status was not pursued. As a qualitative observation, patients who were not treated with miglustat showed higher QSM values in the thalamus compared with those on treatment. Such a distinction was not noticeable in other ROIs (Fig 4).
ROI-based between-group comparison of mean QSM values with age and ROI volume as covariates

Representative QSM images from control and NPC groups. Colored lines mark the borders of segmentations labels: green, putamen; brown, caudate nucleus; red, thalamus; blue, globus pallidus.

ROI-based between-group comparison of mean QSM values. In the Tukey boxplots, the middle line of each box indicates the median, upper, and lower boundaries of the boxes and shows the upper and lower quartiles, respectively; the upper and lower whiskers show the maximum and minimum data points; and the cross signs indicate the mean in each group. Filled triangles represent data points from patients with NPC who were not taking miglustat. Error bars indicate SDs in the entire control and NPC groups. In the thalamus, patients with NPC who were not taking miglustat had higher mean QSM values than those who were prescribed miglustat. L indicates left; R, right.
Correlation between QSM and Volume
The results are shown in Figure 5 for our exploratory test of correlations between QSM and volume in the thalamus and hippocampus, 2 regions that showed a significant difference between groups.

Pearson correlation between volume and QSM in the brain regions that showed a difference in volume or QSM values between groups. Cells containing correlation coefficients are color-coded according to the value of the correlation coefficient. Blue indicates negative correlation, and red indicates positive correlation. Color intensities correspond to the value of the coefficient.
In the control group, a higher whole-ROI mean QSM value was associated with higher volume in the left thalamus (r = 0.73; 95% CI, 0.19–0.93) and left hippocampus (r = 0.66; 95% CI, 0.05–0.91). In the NPC group, in contrast, these correlations were not strong, and the confidence intervals contained the neutral (zero) value. However, the mean QSM value of clusters within the thalamus that showed significantly higher QSM compared with controls (not the whole thalamus) correlated with a smaller volume of the whole thalamus bilaterally (left: r = −0.8; 95% CI, −0.95 to −0.34; right: r = −0.7; 95% CI, –0.92 to −0.13).
Correlations between Neuroimaging and Clinical Assessments
In the NPC group, QSM in the left hippocampus correlated with the NUCOG score (r = 0.73; 95% CI, 0.13–0.94). In the clusters within the left thalamus that showed significantly higher QSM in NPC, mean QSM values were associated with the Iturriaga disease severity score (r = 0.69; 95% CI, 0.1–0.92). Volume in the thalamus and right hippocampus (ROIs with significant between-group volume differences) did not correlate with any of the clinical measures (Online Supplemental Data).
DISCUSSION
In the present study, we used QSM MR imaging at ultra-high field (7T) to examine brain iron in patients with NPC. QSM accurately estimates magnetic susceptibility at a voxel level and provides an indirect measurement of iron, a strong paramagnetic element with large positive magnetic susceptibility that increases the QSM signal.45,46 In contrast, cholesterol and sphingomyelin, which pathologically accumulate in the brain in NPC, have weak negative magnetic susceptibility and reduce QSM.47 In the presence of abnormal lipid deposition that has an opposing effect on QSM than iron, a finding of higher QSM in NPC indicates greater iron content, but lower QSM in NPC can result from the negative magnetic susceptibility of lipid aggregates along with decreased, unchanged, or (slightly) increased iron. In the right hippocampus and scattered areas within the white matter, QSM was lower in the NPC group, consistent with the effect of lipid accumulation. In the thalamus, however, QSM differences were heterogeneous; while there was a widespread cluster of lower QSM in the thalamus, there were bilateral foci of higher QSM in the pulvinar nuclei, indicating a regional accumulation of iron. Furthermore, the volume of the thalamus was markedly lower in the NPC group.
Our secondary analyses demonstrated that excess iron in the pulvinar is associated with a reduced volume of the thalamus in the NPC group (Table 3). In the left pulvinar nucleus, iron content was also associated with higher disease severity scores. In fact, disease severity showed greater correlation with QSM in the left pulvinar cluster than with the volume of the thalamus (Online Supplemental Data). Taken together, these findings point to a preferential deposition of iron in the pulvinar nucleus in association with disease severity and atrophy of the thalamus. The thalamus is centrally involved by the pathology of NPC. Previous structural studies have demonstrated the second highest levels of neuronal loss in the thalamus in NPC, after the cerebellum.1,5,48,49 In the present study, in addition to the marked atrophy in the thalamus, we identified a marked heterogeneity in thalamic iron distribution, suggested by clusters of higher and lower QSM in NPC, which might link iron to the neuropathology of NPC. The pulvinar nucleus, through its connectivity to the visual cortical areas, is believed to play an important role in the regulation of visual attention and oculomotor functions.50 One of the characteristic neurologic findings in NPC is supranuclear vertical gaze palsy,51 which we speculate could be associated with our finding of increased iron concentration and the previously reported atrophy in the pulvinar nucleus.48
The link between the NPC genotype and our observation of a regional increase in brain iron content can be found in genetic studies. In NPC, in addition to the mutation of the NPC gene, coexisting upregulation of multiple genes involved in iron homeostasis52 and diminished expression of ferritin15 have been reported. Ferritin is the main intracellular iron storage, which sequesters and prevents iron from participating in reactions that generate oxidative stress. These genetic alterations are potentially associated with the elevated brain iron and oxidative stress observed in animal models of NPC.4,16 While the abnormal accumulation of cholesterol and sphingolipids is believed to be the underlying pathologic mechanism for neurodegeneration in NPC, oxidative stress associated with iron burden can be a mediating factor for neurotoxicity in this disorder. QSM, in its current state, is unable to differentiate various biologic forms of iron such as ferritin-bound, neuromelanin, or free labile iron (which contributes to oxidative stress and cytotoxicity). Protein-bound forms of iron (ferritin and neuromelanin) have stronger paramagnetic properties and make the greatest contribution to QSM signal. It is possible that the higher QSM in the pulvinar nucleus observed in this study partly or wholly originates from an elevation in these stable forms of iron. However, an increase in protein-bound iron would also be associated with or reflect an increase in labile iron because the labile and protein-bound forms of iron exist in an equilibrium in which an increase on either side elevates (or is causes by the elevation of) the other side. By demonstrating regional accumulation of iron in NPC using advanced in vivo neuroimaging, this pilot study provides a promising approach for understanding the neurobiologic changes in NPC that warrant further investigations. This knowledge has implications in the development of new therapeutic modalities for patients with NPC.
Miglustat is a glucosylceramide synthase inhibitor that is an approved treatment for NPC1, for which it shows modest efficacy. Seven of the 10 participants in the NPC group were on active treatment with miglustat. Whereas this small number precludes a subset analysis, we show these instances in the data (Fig 3), in which patients who were not receiving miglustat showed higher QSM values in the thalamus. It is unclear whether miglustat would have an impact on the homeostasis of iron in the brain. Considering its mechanism of action, treatment with miglustat would be expected to increase QSM secondary to lower lipid accumulation, while in the thalamus, patients who were not treated with miglustat had the highest QSM values. Iron chelation has recently gained attention as a potential medical treatment of neurodegenerative disorders such as Alzheimer disease and Parkinson disease.53 In a previous animal study however, iron chelation with deferiprone did not rescue a mouse model of NPC,54 so pharmacologic strategies to correct the abnormal distribution of iron may need to target iron trafficking indirectly.
This study has potential limitations. One limitation is the small sample size, which restricted the power to observe statistical significance in small-to-medium effect sizes. Considering the rarity of the disorder, the small study population was expected, and we tailored the statistical methods to limit the number of primary comparisons to our central hypothesis, supported by previous reports and our probing voxelwise analysis. However, we tested the associations among regional iron, brain volume, and clinical measures as secondary tests to inform future hypotheses and investigations. Furthermore, we used an ultra-high-field MR imaging scanner (7T), which enhances the magnetization of paramagnetic particles, increasing the tissue-phase perturbation and amplifying the detection power for smaller effect sizes of difference among groups compared with 3T or 1.5T scanners.
A second limitation is the inability of our QSM method to estimate paramagnetic and diamagnetic contributions of iron and lipid moieties to the QSM signal. Such a distinction would allow us to detect potential alterations in iron distribution that could be masked by the abnormal lipid accumulation in NPC. Recently, new methods have been proposed to enable the decomposition of positive and negative magnetic susceptibility sources.55 However, in our experience, we found the biexponential model that aims to disentangle positive and negative susceptibilities to be mathematically unstable, and we were not able to incorporate it into our QSM pipeline.
CONCLUSIONS
The present study provides in vivo evidence consistent with previous human and animal reports suggesting the disturbance of brain iron in NPC, in association with clinical features and structural brain changes. Further studies are required to investigate a potential link between iron dysregulation and neurodegeneration of NPC, ideally using a longitudinal design. Uncovering a possible role for iron in the neurotoxicity of NPC can be an avenue for treatment of individuals with NPC.
Acknowledgments
The authors acknowledge the facilities and scientific and technical assistance of the National Imaging Facility, a National Collaborative Research Infrastructure Strategy capability, at the Melbourne Brain Centre Imaging Unit, University of Melbourne, Victoria, Australia. The authors acknowledge the statistical analysis support received from Mr Peter Summers at Melbourne Statistical Consulting Platform, The University of Melbourne. The authors thank Enterprise Research Infrastructure and Services at Partners HealthCare for their in-depth support.
Footnotes
C. Pantelis and M. Walterfang are joint senior authors.
This research was enabled, in part, by support provided by Digital Research Alliance of Canada (https://alliancecan.ca/en/services/advanced-research-computing), the MASSIVE high performance computing facility (www.massive.org.au), National Imaging Facility of Australia (https://anif.org.au/), and Siemens Healthcare for providing the MP2RAGE sequence pre-release as part of the works in progress package (WIP).
The study was supported by a Royal Melbourne Hospital grant-in-aid (GIA-030H2016) to C.P., V.L.C., B.M., P.D.) and the National Health and Medical Research Council program grant to C.P. (ID: 1150083). V.L.C. is supported by a National Health and Medical Research Council Investigator Grant (1177370) and a University of Melbourne Dame Kate Campbell Fellowship. N.M. is supported by National Institute of Health grants: R01MH125860, R01MH112748, R01MH111917, K24MH116366, R01AG042512, R21DA042271. A.I.B. is supported by a National Health and Medical Research Council L3 Investigator Grant (1194028) and by the generous donation of Mr Douglas Stutt to the University of Melbourne. C.P. is supported by National Health and Medical Research Council L3 Investigator Grant (1196508). A.E.L. is supported by National Institute of Health grants, National Institute of Mental Health 1 K01 MH115247-01A1 and 1K24MH110807-01A1, a Brain and Behavior Research Foundation Young Investigator Award, and a Brigham and Women’s Department of Psychiatry Internal Funding Award. R.J.R. is supported by National Institute of Mental Health grant R01MH112748. M.E.S. is supported by the National Institute of Health grant 5 U01MH109977.
Disclosure forms provided by the authors are available with the full text and PDF of this article at www.ajnr.org.
Indicates open access to non-subscribers at www.ajnr.org
References
- Received January 30, 2023.
- Accepted after revision May 3, 2023.
- © 2023 by American Journal of Neuroradiology


Jump to section
Related Articles
Cited By...
- No citing articles found.