Abstract
BACKGROUND AND PURPOSE: Decreased glucose metabolism in the temporal and parietal lobes on FDG-PET is recognized as an early imaging marker for the AD pathology. Our objective was to investigate the effects of age on FDG-PET findings in aMCI.
MATERIALS AND METHODS: Twenty-five patients with aMCI at 55–86 years of age (median = 73 years) and 25 age- and sex-matched CN subjects underwent FDG-PET. SPM5 was used to compare the FDG uptake in patients in aMCI-old (>73 years) and aMCI-young (≤73 years) groups with CN subjects. The findings in the aMCI-old patients were independently validated in a separate cohort of 10 aMCI and 13 CN subjects older than 73 years of age.
RESULTS: The pattern of decreased glucose metabolism and gray matter atrophy in the medial temporal, posterior cingulate, precuneus, lateral parietal, and temporal lobes in aMCI-young subjects was consistent with the typical pattern observed in AD. The pattern of glucose metabolic changes in aMCI-old subjects was different, predominantly involving the frontal lobes and the left parietal lobe. Gray matter atrophy in aMCI-old subjects was less pronounced than that in the aMCI-young subjects, involving the hippocampus and the basal forebrain in both hemispheres
CONCLUSIONS: Pathologic heterogeneity may be underlying the absence of AD-like glucose metabolic changes in older compared with younger patients with aMCI. This may be an important consideration for the clinical use of temporoparietal hypometabolism on FDG-PET as a marker for early diagnosis of AD in aMCI.
Abbreviations
- AAL
- automated anatomic labeling
- AD
- Alzheimer disease
- ADRC/ADPR
- Alzheimer's Disease Research Center/Alzheimer's Disease Patient Registry
- aMCI
- amnestic mild cognitive impairment
- CDR
- Clinical Dementia Rating
- CN
- cognitively normal
- DCT
- discrete cosine transformation
- FDG-PET
- fluorodeoxyglucose–positron-emission tomography
- FLAIR
- fluid-attenuated inversion recovery
- IQR
- interquartile range
- MCI
- mild cognitive impairment
- MMSE
- Mini-Mental State Examination
- SPM
- statistical parametric mapping
- VBM
- voxel-based morphometry
- WMH
- white matter hyperintensities
Neuroimaging markers of AD pathology would allow new therapies to be developed more quickly and increase the probability of success in clinical trials.1 An important clinical group for early diagnosis and treatment of AD is individuals with aMCI, who are at a higher risk of developing AD than their CN peers.2 Decreased glucose metabolism on FDG-PET is a sensitive marker for AD-related pathologic changes in the brain. The risk of developing AD is higher in patients with aMCI who have the typical pattern of AD-related glucose metabolic changes on FDG-PET than in aMCI patients who do not have these changes.3–7
Glucose metabolism on FDG-PET is primarily decreased in the temporal and parietal cortex in AD, consistent with the regional pattern of neurofibrillary pathologic involvement, neurodegeneration, and atrophy in AD.8 The pattern of decreased glucose metabolism, however, appears to depend on the age of onset in AD.9,10 Patients with early-onset AD have the typical pattern of glucose metabolic changes in the temporal and parietal lobes, whereas these changes are either less pronounced or absent in patients with AD who are older than 73–75 years of age.9,10 Furthermore, the diagnostic accuracy of FDG-PET was higher in patients with AD at an average of 58 years of age compared with patients at an average of 76 years of age.11
Although change on FDG-PET is being recognized as an important early diagnostic marker for AD pathology in aMCI, it is unknown whether age modifies the pattern of glucose metabolic changes in aMCI. Our objective was to investigate the effects of age on the pattern of FDG-PET changes and to compare them with the pattern of cortical atrophy on MR imaging in aMCI.
Materials and Methods
Subjects
We recruited 25 consecutive patients with aMCI from the Mayo Clinic ADRC/ADPR to participate in the FDG-PET study.12 The ages of the subjects with aMCI ranged from 55 to 86 years. From the same ADRC/ADPR cohort, we recruited 25 CN subjects who were matched in age and sex to the subjects with aMCI and who underwent FDG-PET during the same time period. This study was approved by the Mayo Clinic Institutional Review Board, and informed consent for participation was obtained from every subject or an appropriate surrogate.
Individuals participating in the ADRC/ADPR studies undergo clinical examinations, structural brain MR imaging, routine laboratory tests, and a battery of neuropsychological tests. At the completion of the evaluation, a consensus committee meeting is held involving the behavioral neurologists, neuropsychologists, nurses, and the geriatrician who evaluated the subjects to assign a clinical diagnosis of the participant.
The operational definition of aMCI was based on clinical judgment through a careful history from the patient and preferably a collateral source without reference to MR imaging, by using the criteria of Petersen et al for aMCI2: 1) memory loss, preferably corroborated by an informant, 2) objective memory impairment, 3) normal general cognitive function, 4) intact activities of daily living, and 5) no dementia. Patients with structural abnormalities that could impair cognitive function such as tumor; subdural hematoma; contusion from a previous head trauma; infarctions (>1 cm in largest diameter); as well as addictions, psychiatric diseases, or treatments that would have an effect on cognitive function were excluded.
CN subjects were people recruited from the community but evaluated in the same manner as patients with MCI. The CN group did not have any neurologic or psychiatric conditions, did not have a cognitive deficit, had a normal neurologic and neurocognitive examination, and were not taking psychoactive medications in doses that would affect cognition. Patients with depression (according to the Diagnostic and Statistical Manual of Mental Disorders IV criteria) were not excluded.
On the basis of the results from the study subjects, we recruited an independent sample of age- and sex-matched aMCI (n = 13) and CN (n = 10) subjects from a population-based cohort: Mayo Clinic Study of Aging by using similar imaging methods. We describe the reasons for recruiting this validation sample in the “Results” section.
PET and MR Imaging Acquisitions
All subjects underwent FDG-PET and MR imaging studies within 110 days of the clinical evaluation. FDG-PET scans were performed on the Advance PET scanner (GE Healthcare, Milwaukee, Wisconsin) operating in 3D mode. The subjects were injected with FDG in a dimly lit room with minimal auditory stimulation. After a 30-minute uptake period, PET acquisition was followed by a transmission scan. Emission data were reconstructed into a 128 × 128 matrix with a 256-mm FOV. The pixel size was 2.00 mm with a 4.25-mm section thickness. All subjects underwent MR imaging on a 1.5T scanner (Signa, GE Healthcare). A T1-weighted 3D volumetric spoiled gradient-recalled echo sequence with 124 continuous partitions in coronal plane, a 1.6-mm section thickness, a 24 × 18.5 cm FOV, 192 views, and a 25° flip angle was acquired for registration and segmentation of FDG-PET images. A FLAIR pulse sequence in the axial plane (TR/TI/TE = 16,000/2600/140 ms, 256 × 160 matrix, 1 repetition, 22-cm FOV, 3-mm interleaved images) of the whole head was used for the assessment for cerebrovascular lesions.
Assessment of Cerebrovascular Lesions
Cerebrovascular lesions were identified and rated on FLAIR images because they contribute to cognitive impairment in MCI.13 A radiologist (K.K.), blinded to all clinical information, assessed the WMH and hemispheric cortical and lacunar infarctions. WMH volume was estimated by visually comparing the subject's FLAIR images with a bank of 10 FLAIR image templates with increasing WMH volumes (from 1 to 100 cm3) determined with an automated image-segmentation algorithm.13 The WMH volume-estimation algorithm was previously validated against quantification by using automated image segmentation of the WMH volume.14 Because cortical infarctions of >1 cm in the largest diameter were one of the exclusion criteria, we only evaluated hemispheric cortical infarctions ≤1 cm in largest diameter. Subcortical infarctions were defined as discrete subcortical lesions of >3 mm in diameter with an intensity equivalent to CSF on FLAIR images and an accompanying hyperintense gliotic rim.13
FDG-PET Analysis
The AAL atlas15 was modified in-house to contain the following labeled regions of interest: right and left parietal lobes that included the posterior cingulate gyrus and precuneus, temporal lobe, and pons. These regions were chosen on the basis of previous reports showing decreased FDG uptake in these regions in patients with pathologically proved AD,16–18 and the pons was chosen as an internal reference region of interest.6 The high-resolution T1-weighted single-subject brain image15 with atlas labels was normalized to the custom template generated from 200 subjects with AD and 200 CN subjects19 by using the unified segmentation method in SPM5 (Wellcome Department of Imaging Neuroscience, London, United Kingdom),20 giving a set of labels corresponding to the custom template space. The resulting region-of-interest labels were then imported into the Analyze (Mayo Clinic, Rochester, Minnesota) region-of-interest tool and hand-edited by a trained technician (M.M.S.), reviewed by a radiologist (K.K.), and saved to produce a more accurate set of region-of-interest labels corresponding to the custom template, which we refer to as the “custom template AAL” atlas. The FDG-PET image volume of each subject was coregistered to his or her own T1-weighted MR imaging scan, by using a 6-degrees of freedom affine registration with a mutual-information cost function.
Each subject's MR image was then spatially normalized to the custom template by using the unified segmentation model of SPM5,20 giving a DCT, say Gi, which normalizes the MR image of subject i to the custom template. Then for each subject, the inverse transformation (Gi−1) was applied to the custom template AAL atlas to warp the atlas labels to the subject's native anatomic space. Atlas-based parcellation of FDG-PET images into regions of interest was, therefore, performed in subject space. For each subject, the native-space segmented gray and white matter probability maps generated from the unified segmentation routine were combined to create a binary brain mask. Each subject's brain mask was then multiplied by the subject-specific warped atlas, to generate a custom atlas for each subject, parcellated into the aforementioned regions of interest. This step was performed to minimize inclusion of nonbrain regions in statistics of all regions of interest.21,22 Partial volume correction for tissue and CSF compartments was applied by using the 2-compartment model.21
Statistics on image voxel values were extracted from each labeled cortical region of interest in the atlas. FDG ratio images were calculated by dividing the median value in each target cortical region-of interest value by the median value in the pontine region of interest of the atlas.6 A temporoparietal cortical FDG uptake summary measure (temporoparietal FDG) was formed by combining the left and right parietal lobes (including the posterior cingulate gyrus and precuneus) and temporal lobe ratio values for each subject. The temporoparietal FDG was computed as the ratio of the median FDG uptake of the contributing regions of interest to the median FDG uptake of the pontine region of interest. Temporal and parietal regions were chosen to derive the temporoparietal FDG measure because decreased glucose metabolism in these regions is a sensitive marker for AD-related pathology.22
Statistical SPM5 was used to evaluate FDG uptake on a voxelwise basis.20 For each subject, all voxels in the subject's FDG-PET image were divided by the median FDG uptake of the pontine region of interest to form uptake ratio images. Then for each subject, i, spatial normalization of the FDG-PET uptake ratio image to custom template space was performed by using the DCT normalization parameters, Gi, obtained as described above. Finally, smoothed with a Gaussian kernel with a full width at half maximum of 8 mm using these smoothed images, voxelwise FDG uptake differences between groups were assessed in SPM5. Statistical maps of group differences were displayed at a significance value of P < .005, uncorrected for multiple comparisons.
VBM
First, a custom template and tissue probability maps were created in SPM5, by using the T1-weighted MR images of the 25 subjects with aMCI and 25 CN subjects.23 The custom template and tissue probability maps were created by first normalizing and segmenting the 50 scans by using the unified segmentation model in SPM5 with the standard Montreal Neurologic Institute template and tissue probability maps, followed by a cleanup step that uses a hidden Markov random field model to increase the accuracy of the individual subject's tissue probability maps, and finally by averaging the normalized subject tissue probability maps. All subject images were then normalized and segmented by using the unified segmentation model and the custom tissue probability maps, followed by the hidden Markov random field cleanup step. The Jacobian modulation was applied to compensate for the effect of spatial normalization and to restore the original absolute gray matter volume in the segmented gray matter images. These modulated images were then smoothed with a 6-mm full width at half maximum smoothing kernel. Gray matter differences between groups were assessed by using a 2-sided t test within the general linear model framework of SPM. Group differences were displayed at a significance value of P < .005, uncorrected for multiple comparisons. Note that the same significance threshold was used for the FDG-PET analysis.
Statistical Analysis
Wilcoxon rank sum tests were used for statistical analysis comparing the demographic and clinical features of the clinical groups within age strata. Various types of cerebrovascular lesion loads were compared with Kruskal-Wallis or the Fisher exact tests in the 4 groups. Age effects on WMH were tested by using the Spearman rank-order correlation to test for a relationship between age, as a continuous measure, and FDG-PET uptake within clinical groups. Additionally, a linear regression model was fit with main effects for age and clinical diagnosis group as well as an interaction term between age and clinical group. This interaction term was used to assess different associations with FDG-PET and age among the clinical groups.
Results
The temporoparietal FDG was plotted against age in patients with aMCI and CN subjects in Fig 1. The temporoparietal FDG was lower in subjects with aMCI than in CN subjects. However, the difference between CN and aMCI subjects decreased with increasing age as demonstrated in Fig 1. When age was treated as a continuous variable, a trend of increasing temporoparietal FDG with increasing age was identified only in the aMCI group, though this did not reach statistical significance. The Spearman rank-order correlation between the temporoparietal FDG and age is estimated to be −0.15 (P = .46) among CN subjects and +0.32 (P = .12) among subjects with aMCI. We saw evidence of a difference in the relationship of age with temporoparietal FDG by clinical diagnosis (P = .10). In particular, there was some evidence that in subjects with aMCI, younger age was, on average, associated with lower temporoparietal FDG, but in CN subjects, mean FDG remained unchanged with age.

Scatterplot of the global-cortical-to-pons FDG ratio versus patient age for CN (A) and aMCI (B) subjects. The lines indicate the estimated mean as a function of age by using a nonparametric Loess scatterplot smoother. The shaded regions represent approximate pointwise 95% confidence intervals.
For visualization of the age effects on the regional pattern of glucose metabolic changes in patients with aMCI by voxel-based analysis and for practical utility, we took the median age of 73 years (IQR, 69–78 years) as a cutoff and divided the subjects with aMCI and the age- and sex-matched CN subjects into 2 groups: CN or aMCI-young (age ≤73) and CN or aMCI-old (age >73). To validate the unexpected finding of no difference in FDG between old CN and old aMCI, we analyzed an independent sample of age- and sex-matched aMCI (n = 13) and CN (n = 10) subjects (age >73) who were recruited from a population-based cohort, the Mayo Clinic Study of Aging, by using similar imaging methods. The Mayo Clinic Study of Aging is an epidemiologic study of 2000 nondemented individuals 70–89 years of age recruited in 2004 through a random-selection process in Olmsted County, Minnesota.24 A population-based validation sample was available only for the a-MCI-old group but not for the aMCI-young group because of the age range of the Mayo Clinic Study of Aging cohort.
Demographic aspects of the study groups, MMSE scores, and CDR sum of boxes scores are listed in Table 1. On average, age and sex were similar between the CN-young compared with the MCI-young and the CN-old compared with the MCI-old groups in both the study sample and the validation sample. Years of education were not different among all of the groups, though a trend of a higher education level was observed in CN-old subjects compared with CN-young subjects (P > .08) in the study sample. CN-old subjects in the study sample tended to have lower MMSE than CN-young (P = .01) subjects. There was no difference in cognitive function measured with MMSE and CDR sum of boxes between aMCI-young and aMCI-old subjects in the study and the validation samples (P > .87).
Patient characteristics
The temporoparietal FDG measure was lower in the aMCI-young group compared with the CN-young group (P = .01). However, no difference in temporoparietal FDG was observed among the CN-old and aMCI-old groups (P = .67) in the study sample and the CN-old and aMCI-old groups (P = .52) in the validation sample (Fig 2). This was because FDG uptake increased with age in aMCI.

Boxplots with individual data points for the global-cortical-to-pons FDG summary measure by age and diagnosis for study subjects from the Mayo community (ADPR and ADRC) samples (A) and an independent population-based validation sample from the Mayo Clinic Study of Aging (B). The global cortical FDG-uptake summary measure was formed by combining the left and right parietal lobe (including the posterior cingulate gyrus and precuneus) and temporal lobe ratio values for each subject.
We found statistically significant age effects on the WMH load, which increased with increasing age in the CN (r = 0.52, P = .008) and aMCI (r = 0.43; P = .03) subjects. Although subcortical infarctions were twice as frequent in aMCI-old and CN-old groups compared with aMCI-young and CN-young groups and cortical infarctions (≤1 cm in diameter) were twice as frequent in aMCI-old compared with aMCI-young groups, there were no statistically significant differences among groups, most likely because of the small number of infarctions and lack of power (Table 2).
Cerebrovascular lesions by group within the study sample
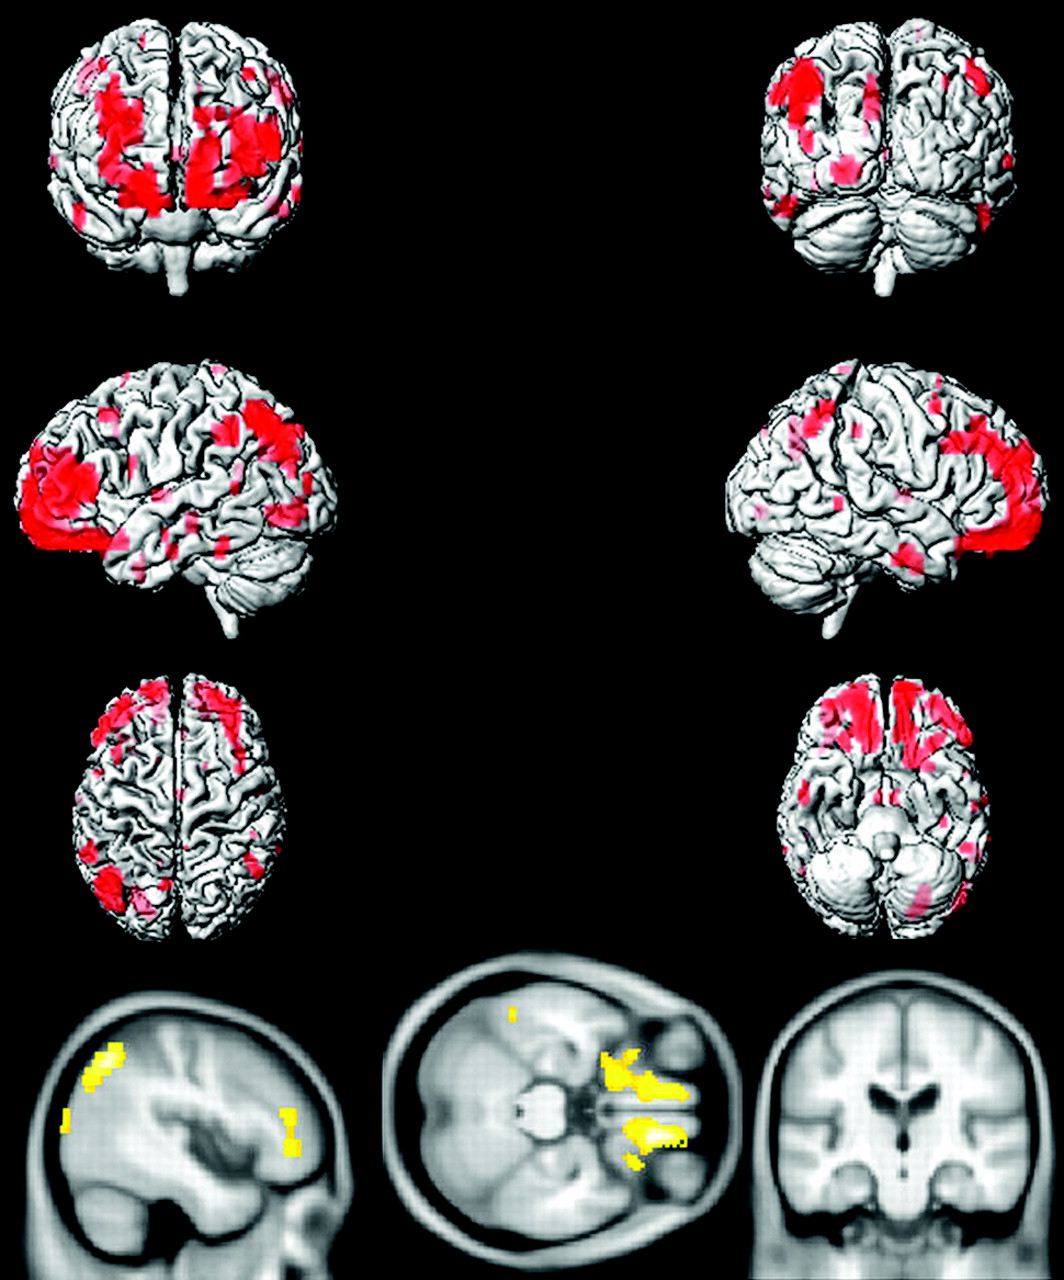
Voxel-based analysis by using SPM5 demonstrated that compared with age-matched CN subjects, aMCI-young patients had decreased glucose metabolism in the precuneus, posterior cingulate gyrus, medial temporal lobe, and lateral temporal and parietal lobes in both hemispheres, consistent with the typical pattern of FDG-PET changes observed in AD (Fig 3). The regional decrease in FDG uptake in aMCI-old patients compared with age-matched CN subjects, however, was different from the AD-like pattern observed in aMCI-young subjects, primarily involving the orbitofrontal and prefrontal cortices in both hemispheres and the left lateral parietal lobe (Fig 4).

Voxel-based analysis of the FDG-PET uptake-to-pons ratio in aMCI-young patients compared with age- and sex-matched CN-young subjects (P < .005 uncorrected).

Voxel-based analysis of the FDG-PET uptake-to-pons ratio in aMCI-old patients compared with age- and sex-matched CN-old subjects (P < .005 uncorrected).
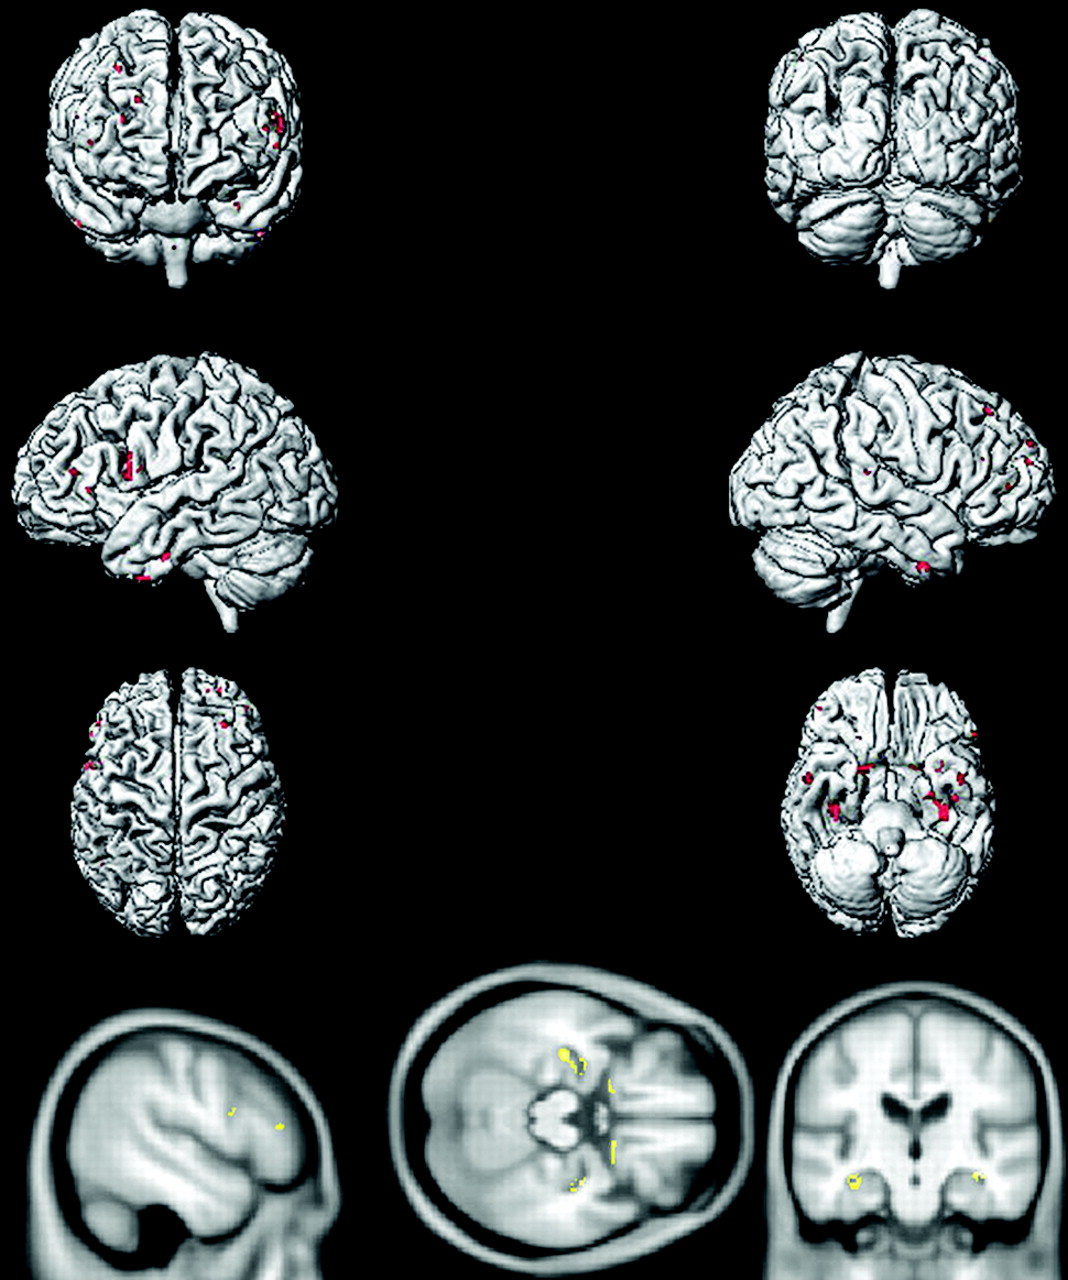
The pattern of gray matter atrophy in aMCI-young patients mirrored the pattern of reduction in glucose metabolism in this group, involving mainly the precuneus, medial temporal lobe, and lateral temporal and parietal lobes in both hemispheres and some involvement of the prefrontal cortex (Fig 5). On the other hand, the cortical atrophy was far less significant in aMCI-old subjects mainly involving the hippocampus and the basal forebrain in both hemispheres, and a few clusters were present in the prefrontal cortices (Fig 6).

Pattern of gray matter reduction in aMCI-young patients compared with age- and sex-matched CN-young subjects demonstrated in red and yellow (P < .005 uncorrected).

Pattern of gray matter reduction in aMCI-old patients compared with age- and sex-matched CN-old subjects demonstrated in red and yellow (P < .005 uncorrected).
Discussion
Our data demonstrated that the effects of age on the pattern of glucose metabolism in aMCI are in agreement with the previous observations in AD.9–11 The median age of 73 years was taken as the cutoff to classify subjects into young and old groups to determine the regional differences in glucose metabolic changes in aMCI-old and aMCI-young subjects. The dichotomization of the aMCI cohort was also necessary for determining the practical clinical utility of FDG-PET for early diagnosis of AD in aMCI. Furthermore, absence of temporoparietal and posterior cingulate cortex hypometabolism has been previously demonstrated in late-onset AD (onset >73–75 years of age).9,10
Patients with aMCI who were younger than or at 73 years of age had decreased glucose metabolism in the posterior cingulate gyrus and lateral temporal and parietal cortices compared with age- and sex-matched controls. This regional pattern of decreased glucose metabolism is consistent with the typical pattern observed in pathologically proved AD16–18 and in patients with aMCI who progress to AD.3,5,25 However, when aMCI-old patients were compared with age- and sex-matched CN subjects, glucose metabolism was mainly reduced in the frontal lobes and the left lateral parietal lobe. Although the reduction in lateral parietal lobe glucose metabolism can be considered a partial expression of the AD pattern, the differences in glucose metabolic patterns between old and young aMCI cannot be ascribed to differences in cognitive performance level because performance was the same in these 2 groups. Decreased glucose metabolism in the frontal cortex has been observed in patients with aMCI who did not progress to AD after an average of 12–24 months.5,25 Whether frontal lobe hypometabolism represents a low likelihood of progression to AD in the aMCI-old subjects in our cohort will be investigated.
There may be several explanations for the observed age effects on FDG-PET changes in aMCI compared with age-matched CN subjects. An obvious explanation is that the CN-old group may have had a higher frequency of incipient AD pathology than the CN-young group, thus diminishing the difference in glucose uptake between aMCI-old and CN-old subjects in brain areas typically associated with AD. However, while aging is the primary risk factor for dementia, we did not identify age effects on the temporoparietal FDG uptake in CN subjects (Fig 1), which suggests that the absence of the AD pattern of FDG uptake differences among the MCI-old and CN-old groups is less likely to be related to a high frequency of incipient AD in the CN-old group.
A second possible explanation is that the aMCI-young patients had more severe AD pathology than the aMCI-old patients. If so, we would need to explain the fact that the cognitive performance of the 2 groups was similar. Age of onset has been a significant predictor of neurofibrillary tangles and neuritic plaques and synaptic attenuation in patients with AD, with patients with early-onset AD having more neurofibrillary tangles and neuritic plaques and lower synaptic attenuation than patients with late-onset AD.26 On the basis of these findings, it is possible that aMCI-young patients with greater AD pathology and AD-related glucose metabolic changes may be compensating more efficiently than the aMCI-old patients, in whom the pathologic involvement and the FDG-PET changes were less severe but the cognitive function was similar to that in aMCI-young patients.
A third possible explanation for our findings is that a higher frequency of non-AD dementia-related pathologies that increase in prevalence with age may be contributing more significantly to the cognitive impairment in aMCI-old patients than in the aMCI-young patients. Although AD is the most common pathology underlying aMCI, other dementia pathologies encountered in aMCI include cerebrovascular disease and Lewy body pathology.27–31 Aging is a major risk factor for cerebrovascular disease and Lewy body pathology, as it is for AD, and mixed pathologies account for most of the dementia cases in the community.32 For example in our cohort, the WMH load, which contributes to the cognitive impairment in MCI, increased with increasing age in both CN and aMCI subjects. Thus, it is possible that the absence of a typical AD-like pattern of glucose metabolism in the aMCI-old group may be related to a greater pathologic heterogeneity in the aMCI-old compared with the aMCI-young patients.33,34
VBM showed medial temporal lobe atrophy in both the aMCI-young and aMCI-old subjects compared with the age-matched CN subjects, which is a feature of early AD pathology and aMCI.19 However, the pattern of the neocortical atrophy differed significantly between the 2 age groups. The temporoparietal cortex and precuneus atrophy in the aMCI-young patients was similar to the pattern of decreased glucose metabolism in this group on FDG-PET. On the other hand, atrophy, which was mainly confined to the medial temporal lobe and basal forebrain in the aMCI-old patients with some involvement of the prefrontal cortex, was different from the pattern of decreased glucose metabolism in the aMCI-old group. This topographic dissociation between the decrease in glucose metabolism and atrophy points to a heterogeneity in the imaging findings of the older patients with aMCI.
The association between the pathologic features of AD and dementia has recently been found to be stronger in younger than in older elderly persons, demonstrating a greater heterogeneity in clinical expression of AD pathology in older than in younger elderly. The differences in AD pathologic burden between demented and nondemented elderly narrowed down with increasing age.34 In the current study, aMCI-young patients had greater neocortical atrophy and greater reduction in temporoparietal glucose metabolism than aMCI-old patients when compared with the age-matched controls. Taken together, the age effects on imaging findings in aMCI agree with the findings at postmortem examination,34 showing that the AD-like differences in glucose metabolism and gray matter volume between CN and aMCI may become less significant with increasing age in aMCI.
We optimized the power for detecting differences among groups by comparing aMCI subjects with age- and sex-matched CN subjects. Because our study sample was recruited from the community (ADPR) and dementia (ADRC) clinics, we confirmed the observed age effects in the aMCI-old subjects in a population-based sample. Seventy-three years of age was used as a cutoff based on the age distribution of our cohort. We recognize that a larger study could reveal a slightly different age above which FDG-PET loses its ability to distinguish aMCI from CN.
Conclusions
The data we present suggest that age affects the glucose metabolic changes in aMCI, and the data agree with the observations in AD.9,10 The typical temporoparietal hypometabolic pattern of AD characterizes younger patients with aMCI (≤73 years of age) but not the older patients with aMCI (>73 years of age). It is important to account for age when using temporoparietal hypometabolism on FDG-PET as a marker for early diagnosis of AD in aMCI.
Footnotes
-
This work was supported by the Paul Beeson Career Development Awards in Aging K23-AG030935; NIH Roadmap Multidisciplinary Clinical Research Career Development Award KL2 RR024151 (NIH/NCRR); NIH/NIA-AG11378, AG06786, and AG16574; the Alexander Family; and the Robert H. and Clarince Smith and Abigail Van Buren Alzheimer's Disease Research Program.
Indicates open access to non-subscribers at www.ajnr.org
References
- 1.
- 2.
- 3.
- 4.
- 5.
- 6.
- 7.
- 8.
- 9.
- 10.
- 11.
- 12.
- 13.
- 14.
- 15.
- 16.
- 17.
- 18.
- 19.
- 20.
- 21.
- 22.
- 23.
- 24.
- 25.
- 26.
- 27.
- 28.
- 29.
- 30.
- 31.
- 32.
- 33.
- 34.
- Received October 6, 2009.
- Accepted after revision January 5, 2010.
- Copyright © American Society of Neuroradiology