Abstract
BACKGROUND AND PURPOSE: Myopia is a type of refractive error that blurs retinal image and in turn can change neural signals transferred from retina to visual cortex. The purpose of this study was to evaluate the effect of induced myopia on occipital visual cortex activity by fMRI results.
MATERIALS AND METHODS: BOLD fMRI was performed in 13 emmetropic volunteers (refractive error, <±0.50D) with normal visual acuity, good binocular vision, and no history of neurologic illness. Visual stimulus was counterphasing vertical luminance sinusoidal grating with spatiotemporal frequency of 1.84 cycles per degree/8 Hz and contrast of 60%. The functional images were acquired in block design, during normal refractive state and induced myopia produced by convex noncoating plastic lenses of +1D, +3D, +5D, by using an EPI gradient-echo sequence in a 1.5T MR imaging scanner. fMRI data were processed by using FSL software.
RESULTS: fMRI responses to visual stimuli demonstrated that percentage of BOLD signal intensity change and number of activated voxels within occipital visual cortex were reduced remarkably in induced myopic states of 1D, 3D, and 5D in comparison with normal refractive state; the results did not show a significant and regular decreasing trend in number of activated voxels and BOLD signal intensity change in these 3 different values of induced myopia.
CONCLUSIONS: The findings suggest that induced myopia has a considerable effect on visual cortex activity, because myopia induced by lens of +1D is sufficient to change fMRI results significantly. Accordingly, it is essential to correct myopia before visual fMRI studies, even if it is at low levels.
Abbreviations
- AC/PC
- anterior/posterior commissure
- ANOVA
- analysis of variance
- BOLD
- blood oxygenation level–dependent
- EPI
- echo-planar imaging
- fMRI
- functional MR imaging
- FSL
- Functional MR Imaging Software Library
- VEP
- visual-evoked potential
fMRI is a powerful, noninvasive neuroimaging technique that allows studying many different aspects of the human visual system, because of the robust and reliable BOLD responses elicited by visual stimuli. fMRI has been widely used for clinical assessments of visual impairments and neurologic disorders, and in physiologic studies, where it is useful for delineation of visual cortical area borders and for examining the functional specialization of these areas.1,2
One of the factors affecting the function of the visual system that may disturb the results of visual fMRI studies is optical blur due to myopia. The effects of refractive errors such as myopia on visual cortex activity have been extensively investigated by electrophysiologic methods, but there are few fMRI studies examining this issue.
Sokol and Moskowitz3 evaluated the effect of retinal defocusing induced by minus and plus lenses on the latency of the p100 component of the checkerboard pattern reversal VEP and suggested that p100 latency was shortest under conditions of optimal visual acuity and that prolongation of p100 latency was more pronounced at the small checks. Similar results were reported by Bobak et al,4 who found that p100 latency increased with blur (−2.5D to +2.5D) by using both sinusodial grating and check patterns as stimuli, especially with high spatial frequency. Berman and Seki5 observed that monocular and binocular blur caused by plus lenses (up to +1.5D) had a slight effect on the binocular VEP amplitudes, whereas monocular VEPs were dramatically reduced by blurring. Bartel and Vos6 reported that by decreasing visual acuity from an initial level of 20/20 to 20/200, the p100 amplitude elicited by 11′ checks declined abnormally by a mean of 73% and the p100 latency prolonged approximately 13%. Richter et al7 showed that the blurring induced optically by a −5D lens compared with no-blur condition (through 0D lens) caused ∼4% change in calcarine regional cerebral blood flow as measured by positron-emission tomography and 15O-water. Regarding fMRI, only 1 study could be found that was conducted by Elbel et al.8 They investigated the effect of myopia induced by a +8D lens that is in the range of high myopia (high myopia, >−6D) on neural activity of the median occipital cortex in 3 subjects. They found that induced myopia resulted in a reduction of the number of activated pixels (28.7%) and estimated BOLD amplitudes (22.4%).8
Therefore, evaluating the effect of refractive errors on fMRI results, especially in lower levels, has not been the focus of any previous fMRI studies, and no results have been reported on this issue. Also, considering the different nature of BOLD signals, the results of VEP and positron-emission tomography studies cannot be generalized to fMRI studies without any investigations.
Although in programmed volunteer fMRI studies on visual cortex, refractive errors are usually evaluated by ophthalmic examinations and subjects usually have normal or corrected to normal visual acuity, in most-clinical assessments to ensure the proper visual resolution, patients' statements are usually the basis to be relied on, not exact ophthalmic examinations. Given that degradation of retinal images due to low levels of myopia such as −1D is not very tangible, and because patients may tolerate it, lower levels of myopic defocus may be neglected.
Considering relatively little knowledge about the effects of refractive errors on fMRI responses in visual studies, the purpose of present study was to evaluate the effects of different values of induced myopia on the level and extent of occipital visual cortex activity by fMRI results.
Materials and Methods
Subjects
Thirteen right-handed emmetropic volunteers (refractive error, <±0.50D) with no history of neurologic and ocular illness (5 males and 8 females; age range, 18–32 years; mean age ± SD, 23 ± 4 years) participated in this study. Each subject was evaluated clinically by optometric examinations before the scanning session. All participants had normal visual acuity of 20/20 based on the Snellen fraction in each eye with good binocular vision and normal visual field based on confrontation test.
Written informed consent was obtained from all subjects after the experimental procedures had been fully described to them. All procedures adhered to tenets of the declaration of Helsinki.
Experimental Design
Functional imaging was performed in a block design paradigm consisting of 4 cycles of alternating 30-second stimulation and 30-second rest conditions, for a total time of 4 minutes. Visual stimulus was a vertical luminance sinusoidal grating with spatial frequency of 1.84 cycles per degree (60% contrast) counterphased at 8 Hz.9 During the rest condition, a plain gray surface, with a luminance equal to average luminance of sinusoidal grating was presented.
Visual task was generated by “presentation” software (version 0.60; Neuro Behavioral Systems, Albany, California) and projected on a translucent screen subtending visual angles of 12.49° horizontally and 9.45° vertically at a viewing distance of 5.28 m. Subjects viewed the screen binocularly through a tilted mirror mounted on the head coil in a fairly dark scanning room and were instructed to fixate on a red point at the center of the screen during the experiment.
The fMRI data were acquired in the normal refractive state and myopic states induced by convex noncoating plastic lenses of +1D, +3D, and +5D that were fitted in nonmagnetic spectacles. The functional imaging was repeated twice in each refractive state; the fMRI session included 8 consecutive trials of 4 minutes each, with a separation of ∼1 minute to change the lenses.
Data Acquisition
BOLD fMRI was performed with a 1.5T MR imaging scanner (Philips Medical Systems, Best, the Netherlands). Functional images were acquired in AC/PC orientation by using a single-shot T2*-weighted gradient-echo EPI pulse sequence sensitive to BOLD contrast (TR = 3000 ms, TE = 50 ms, flip angle = 90°, FOV = 220 × 220 mm2, matrix = 64 × 64, sections = 25, section thickness = 4 mm, voxel size = 3.44 × 3.44 × 4 mm3). High-resolution anatomic images were obtained before the functional experiments by using a 3D T1-weighted gradient-echo sequence (TR = 25 ms, TE = 4.6 ms, flip angle = 30°, FOV = 220 × 220 mm2, voxel size = 0.9 × 0.9 × 1 mm3, matrix = 256 × 256).
Data Analysis
Each subject's fMRI data for each of the 8 trials were analyzed by using Functional MR Imaging Expert Analysis Tool, Version 5.98, a part of FSL (Oxford University; www.fmrib.ox.ac.uk/fsl).10,11
Before the statistical analysis, the following preprocessing steps were applied: motion correction by using the FMRIB (University of Oxford, Oxford, United Kingdom) Linear Image Registration Tool,12 nonbrain removal by using brain extraction tool,13 and spatial smoothing (Gaussian kernel of full width at half maximum, 5 mm) and high-pass temporal filtering (100-ms cutoff).
Using a general linear model, the input stimulus function was convolved with a γ hemodynamic response function. Model fitting and parameter estimation generated Z statistic images that were thresholded by using clusters determined by Z > 1.5 and a corrected cluster significance threshold level of P = .05.14,15 Functional data were registered to high-resolution structural images and then normalized to a standard MNI152 brain image (Montreal Neurologic Institute).
The region of interest was occipital visual cortex, including striate and extrastriate areas (Brodmann areas 17 and 18) that were individually hand-drawn for each subject on their high-resolution anatomic scans.
Results
The mean percentage of BOLD signal intensity change and the mean number of significantly activated voxels in the occipital visual cortex were averaged over 13 subjects and 2 repetitions in each refractive state.
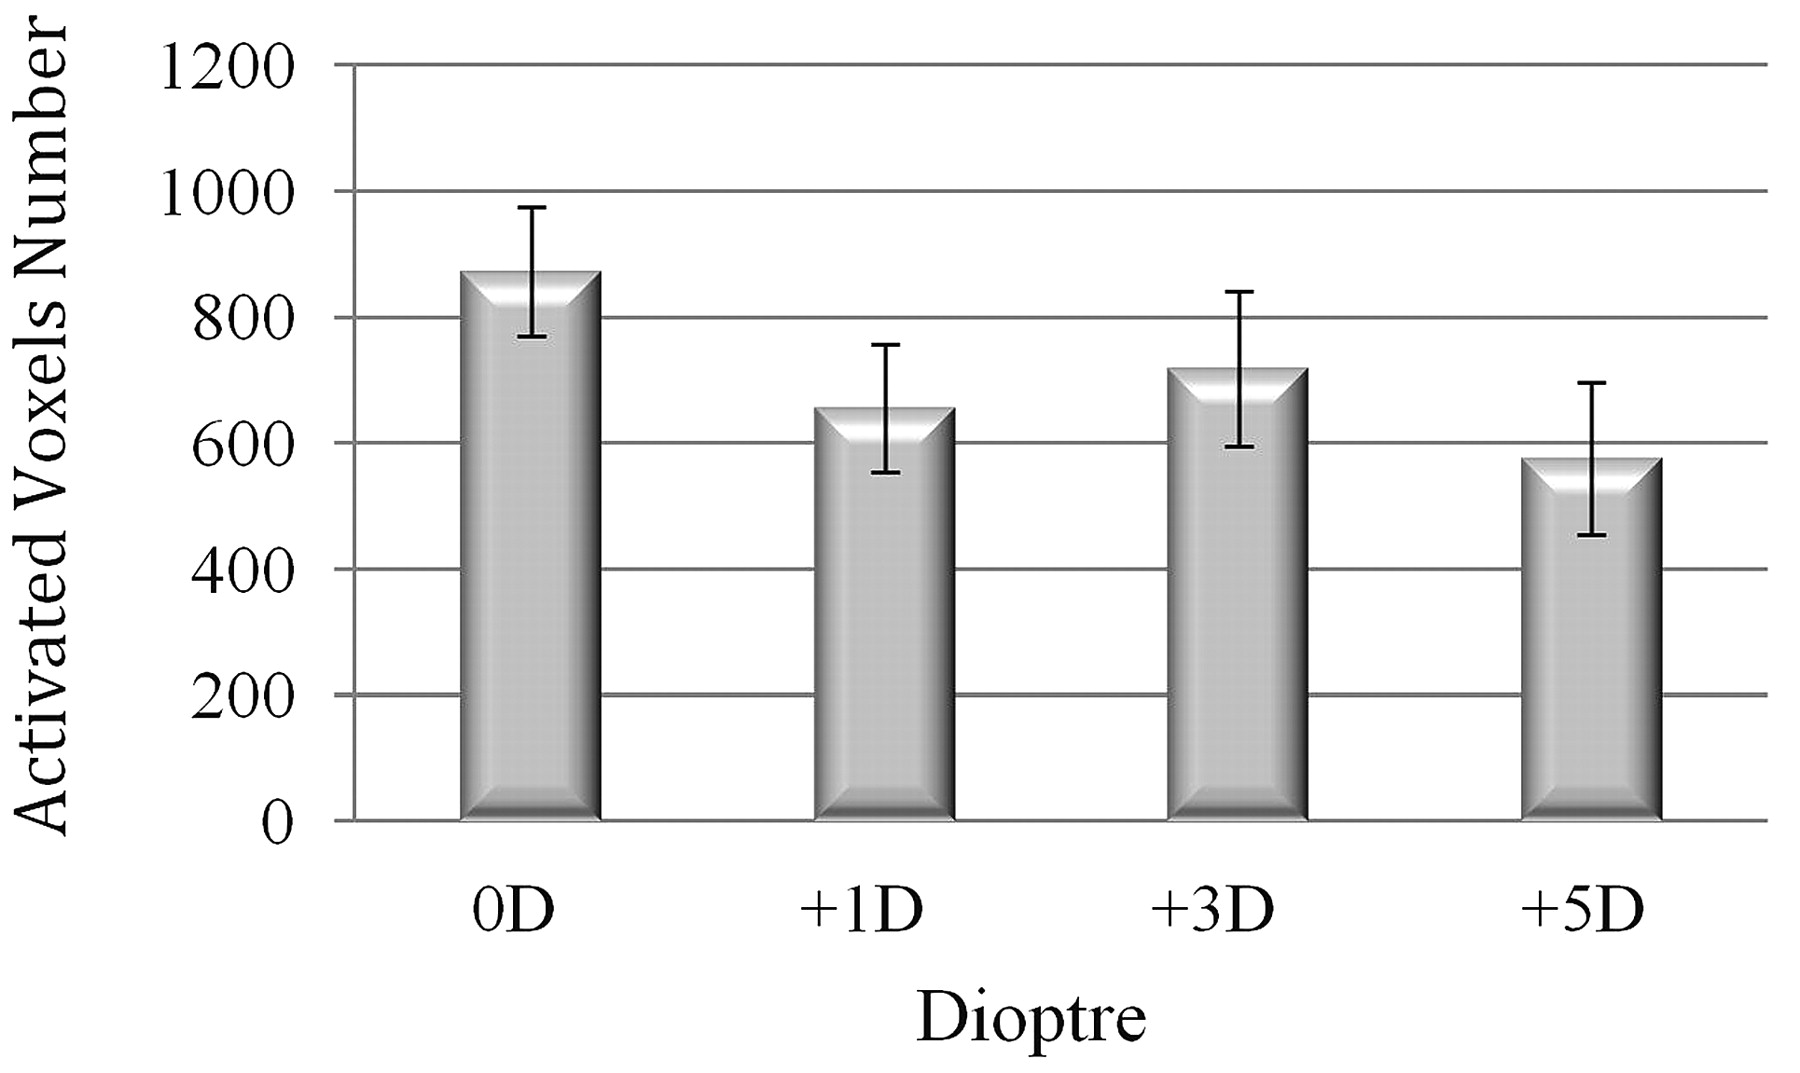
The average numbers of activated voxels within this region of interest in induced myopic states of +1D, +3D, and +5D were considerably reduced by 24.8%, 17.7%, and 33.9%, respectively, in comparison with normal refractive state. The repeated measure ANOVA of the average number of activated voxels was performed to compare the extent of BOLD responses in 4 refractive states and revealed that the main effect of the induced myopia was not significant (F = 1.65, P = .22), but the pair-wise comparison indicated that the average number of activated voxels in the induced myopic state of +1D was significantly reduced compared with the normal refractive state (paired sample t test: t = 2.15, P = .05).
More than 50% of the subjects exhibited a decrease in the number of activated voxels for the myopic state of +3D relative to +1D and for +5D relative to +3D. Nevertheless, on average, there were no distinct and regular changes in the extent of BOLD responses in these 3 values of induced myopia (Fig 1).

Mean number of significantly activated voxels in occipital visual cortex averaged over 13 subjects and repetition trials (error bars represent SEM).
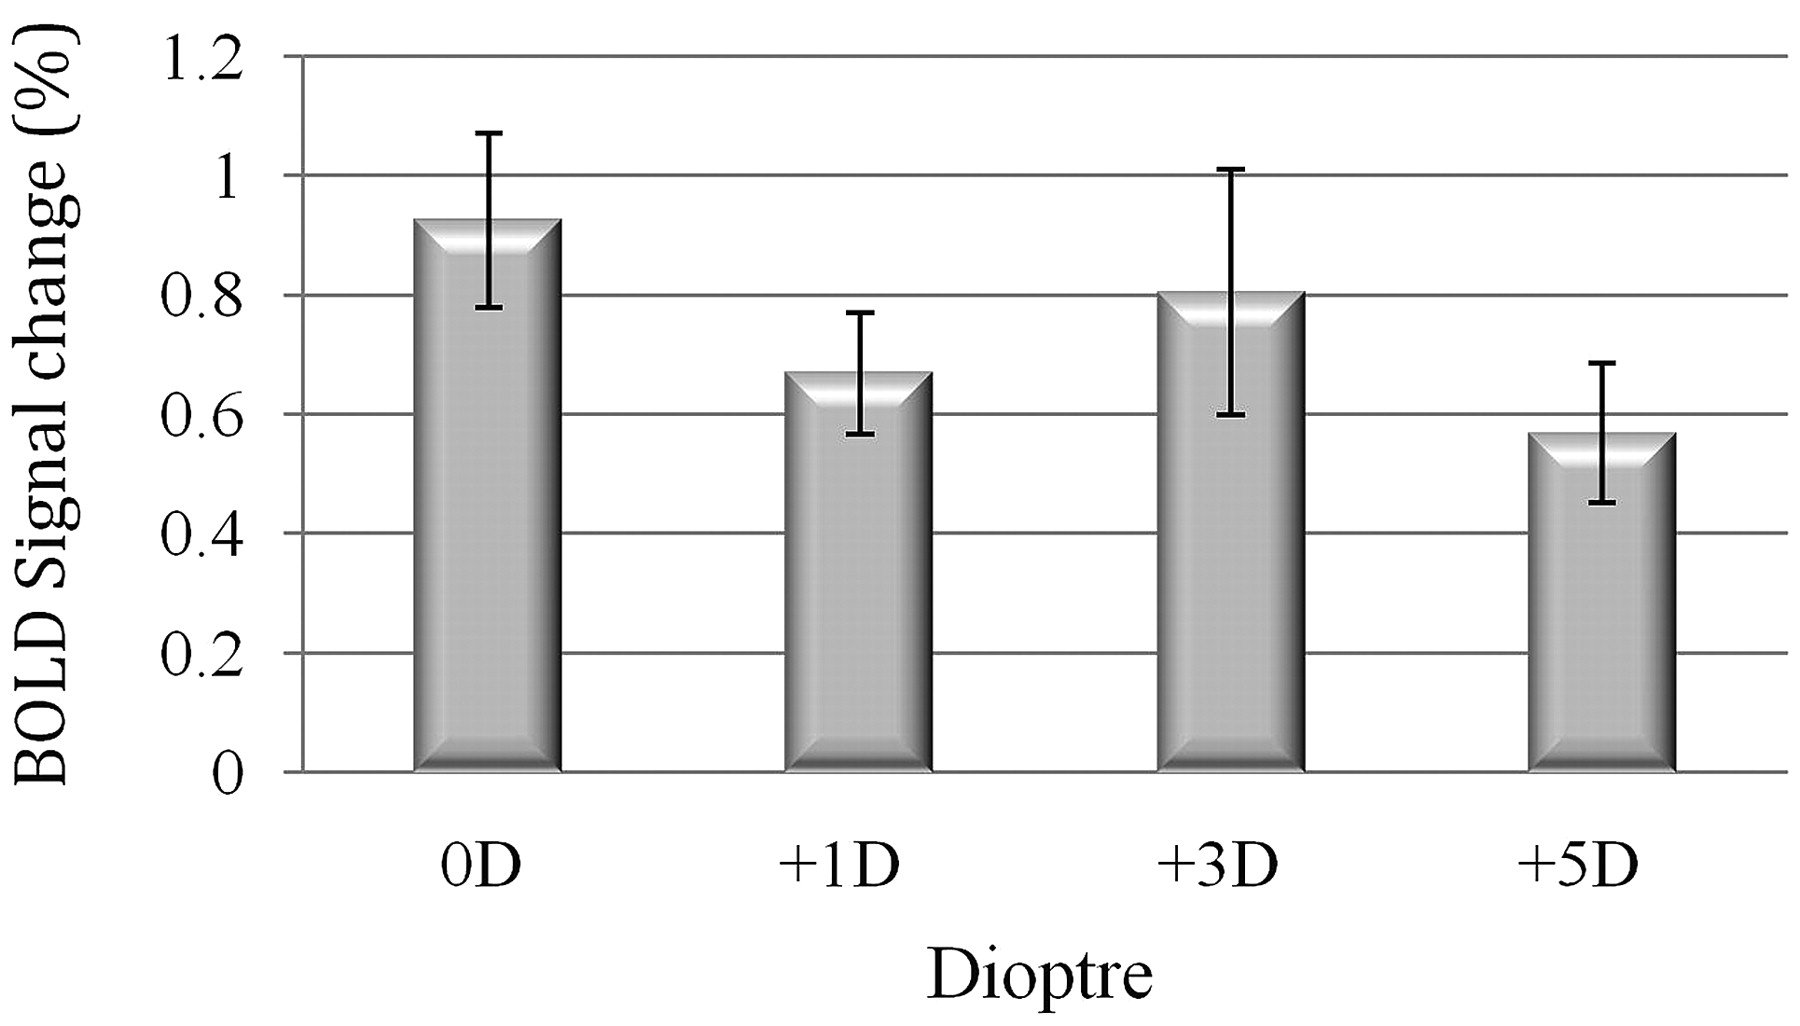
Likewise, the results showed that the average percentages of BOLD signal intensity change in the region of interest, in induced myopic states of +1D, +3D, and +5D were remarkably decreased by 27.2%, 13%, and 38%, respectively, in comparison with the normal refractive state. Repeated measure ANOVA of the average percentage BOLD signal intensity change did not show a significant main effect of dioptric defocus (F = 1.37, P = .26), but the paired sample t test indicated that the average percentage of BOLD signal intensity change in the induced myopic state of +1D was significantly reduced in comparison with the normal refractive state (t = 2.35, P = .04).
Although >50% of the subjects showed a decrease in the percentage of BOLD signal intensity change for the myopic state of +3D relative to +1D and for +5D relative to +3D, on average, no distinct and regular changes in the level of BOLD responses were observed in these 3 degrees of induced myopia (Fig 2).

Mean percentage BOLD signal intensity change in occipital visual cortex averaged over 13 subjects and repetition trials (error bars represent SEM).
Average activation maps resulting from group analysis superimposed on standard high-resolution anatomic images in all refractive states are illustrated in Fig 3.

Average activation maps resulting from group analysis, superimposed on standard high-resolution anatomic images in all refractive states, showing the reduction of neural activation in induced myopic states relative to normal refractive state. Color scale at the bottom indicates z-score significance level.
Discussion
Myopia is one of the most prevalent refractive errors that may interfere in the results of visual fMRI studies and the diagnostic process of neural disorders. In this study, the effects of 3 different values of induced myopia on fMRI results were evaluated.
The main finding of this study is that the lens-induced myopic defocus considerably decreases the level and extent of occipital visual cortex BOLD fMRI responses. This finding is consistent with previous results from VEP and positron-emission tomography studies.3–8
Despite numerous electrophysiologic studies regarding the effect of refractive errors on neural activity,3–7 only 1 fMRI study on this issue could be found, and this study was conducted by Elbel et al.8 The results obtained in the present study are similar to observations of Elbel et al8 who suggested that BOLD responses were reduced by ∼20% in the induced myopic state of +8D in comparison with the normal refractive state.
The lens that was used to induce optical blurring has the same action as a low-pass spatial filter because it attenuates information that is carried at high spatial frequencies and results in degradation of the retinal image.16 The reduction of the amount of visual cortex activity caused by dioptric defocus probably reflects this loss of visual information transferred from retina to visual cortex.
In this study, fMRI results showed no significant differences between the induced myopic states of 1D, 3D, and 5D. This is probably due to nonuniform changes in visual acuity with increasing degrees of induced myopia. Johnson and Casson17 reported that the slope of changes in visual acuity was steeper at low levels of induced myopia up to approximately +2D than at higher levels of myopic defocus from +2D to +8D. The dramatic decrease in visual acuity for blur levels up to nearly +2D is in agreement with the results of this study that reveal marked reduction of BOLD responses from no myopia to myopic states. In addition, the relative similarity of BOLD signal intensity change in 3 different levels of dioptric blur in this study is well in line with their result showing a gradual drop in visual acuity for dioptric blur between +2D and +8D.
Furthermore, relatively unchanged fMRI responses in 3 values of induced myopia can be the result of blur adaptation. According to the Webster et al18 study, adaptation to physically blurred images for 3 minutes elevated perception of blur; so, it may be possible that exposure to dioptric defocus in a 4-minute run of fMRI scanning improved visual resolution in subsequent trials. There is some evidence that improvement in visual resolution after blur adaptation is ascribed to a compensatory process in visual cortex. For example, Mon-Williams et al16 found visual acuity improvement after a 30-minute period of +1D induced defocus caused by “neural compensation,” which occurred at binocular sites in visual cortex. Georgeson and Sullivan19 also stated that organization of spatial frequency selective channels in the visual cortex attempts to restore the clarity of the blurred image. Accordingly, in the present study, it seems reasonable that blur adaptation in a run of scanning during myopic defocus affected the visual cortex activity in the following runs. Thus, neural compensatory processes evidently counteract the gradual reduction of neural activity for optical defocus greater than +1D (from +1D to +5D) and thereby modulated the changes in fMRI BOLD responses with increasing degrees of induced myopia.
Contrary to the results of this study based on irregular changes in BOLD responses with increasing the level of dioptric blur, VEP studies found that with increasing dioptric defocus, VEP amplitude was decreased and VEP latency was prolonged.3–7 One possible reason for this inconsistency may be related to difference between the nature of VEP and BOLD fMRI signals. Electroencephalography signals are electric potentials that reflect synaptic activities from a large population of synchronously activated neurons recorded from the scalp, whereas BOLD signals represent the hemodynamic changes arising from increasing synchronous and asynchronous synaptic activity.20
Moreover, studies using VEP have investigated the effect of retinal blur on the latency and amplitude of the p100 component. The previous major studies regarding the neural source of the p100 component of the pattern reversal VEP suggested that p100 is generated in the striate cortex (V1).21 Thus, decline of p100 amplitude and latency prolongation of this component in defocus conditions showed reduction of neural activity in area V1, whereas in this study, the neural activation in total occipital visual cortex, including striate and extrastriate areas, was evaluated.
Conclusions
Although fMRI results revealed no significant differences between the induced myopia states of 1D, 3D, and 5D, the findings suggest that induced myopia has a considerable effect on visual cortex activity, because myopia induced by lens of +1D is sufficient to change fMRI results significantly. Accordingly, it is essential to correct myopia even if it is at a low level before visual task-related fMRI studies, especially at clinical assessments.
Acknowledgments
We thank all the staff of the imaging department at Hazrat Rasool Akram Hospital, especially Mr. A. Shoaiee, for help with MR imaging data acquisition. We also are grateful to all volunteers for participation in this project.
Footnotes
-
This work was supported by Tehran University of Medical Sciences.
-
Paper previously presented at: Emirates Ophthalmic Conference, 9–11 December 2010, Dubai, United Arab Emirates, and in part at: 9th Iranian Congress of Medical Physics, 19–20 May 2010, Tehran, Iran.
References
- 1.
- 2.
- 3.
- 4.
- 5.
- 6.
- 7.
- 8.
- 9.
- 10.
- 11.
- 12.
- 13.
- 14.
- 15.
- 16.
- 17.
- 18.
- 19.
- 20.
- 21.
- Received November 12, 2010.
- Accepted after revision January 5, 2011.
- © 2011 by American Journal of Neuroradiology