Abstract
BACKGROUND AND PURPOSE: Epidermal growth factor receptor amplification is a common molecular event in glioblastomas. The purpose of this study was to examine the potential usefulness of morphologic and diffusion MR imaging signs in the prediction of epidermal growth factor receptor gene amplification status in patients with glioblastoma.
MATERIALS AND METHODS: We analyzed pretreatment MR imaging scans from 147 consecutive patients with newly diagnosed glioblastoma and correlated MR imaging features with tumor epidermal growth factor receptor amplification status. The following morphologic tumor MR imaging features were qualitatively assessed: 1) border sharpness, 2) cystic/necrotic change, 3) hemorrhage, 4) T2-isointense signal, 5) restricted water diffusion, 6) nodular enhancement, 7) subependymal enhancement, and 8) multifocal discontinuous enhancement. A total of 142 patients had DWI available for quantitative analysis. ADC maps were calculated, and the ADCmean, ADCmin, ADCmax, ADCROI, and ADCratio were measured.
RESULTS: Epidermal growth factor receptor amplification was present in 60 patients (40.8%) and absent in 87 patients (59.2%). Restricted water diffusion correlated with epidermal growth factor receptor amplification (P = .04), whereas the other 7 morphologic MR imaging signs did not (P > .12). Quantitative DWI analysis found that all ADC measurements correlated with epidermal growth factor receptor amplification, with the highest correlations found with ADCROI (P = .0003) and ADCmean (P = .0007).
CONCLUSIONS: Our results suggest a role for diffusion MR imaging in the determination of epidermal growth factor receptor amplification status in glioblastoma. Additional work is necessary to confirm these results and isolate new imaging biomarkers capable of noninvasively characterizing the molecular status of these tumors.
ABBREVIATIONS:
- EGFR
- epidermal growth factor receptor
- GRE
- gradient recalled-echo
The prognosis of patients with glioblastoma, the most common primary brain tumor, remains dismal, with a median overall survival duration of 16–17 months.1 Significant advances have recently been made toward a better understanding of the molecular mechanisms underlying gliomagenesis, however, with the ultimate goal of improving outcomes. Glioblastoma was the first human cancer sequenced by The Cancer Genome Atlas network effort,2 resulting in a comprehensive characterization of the mutational spectrum of this type of tumor. On the basis of integrated genomic analysis, molecular classifications have been proposed with the intent of providing more uniform tumor subclasses from a biologic standpoint.3,4 Continued genomic sequencing efforts are expected to have expanding roles in the selection of patients for clinical trials and the development of more individualized and specific targeted therapies.
Activation of the epidermal growth factor receptor (EGFR) pathway is one of the most frequent molecular events in glioblastomas, with EGFR overexpression or amplification observed in up to 50% of patients.5⇓–7 The EGFR gene is located on chromosome 7p12 and is more commonly amplified in primary glioblastoma than in secondary glioblastoma.8 Activation of EGFR pathways is associated with increased motility, adhesion, invasion, and proliferation of tumor cells, as well as inhibition of apoptosis and induction of angiogenesis.9,10 High-level EGFR amplification is a hallmark of the so-called Classical glioblastoma subtype, found in up to 97% of patients in that subgroup.3
DWI has correlated with cellular attenuation and gained increasing use in the evaluation of brain tumors, including glioblastoma.11⇓⇓⇓⇓⇓⇓⇓⇓–20 The role of DWI in the prediction of EGFR amplification status, however, has not been previously investigated. We hypothesized that the increased tumor cell proliferation and survival mediated by EGFR amplification will be measurable by DWI as restricted water diffusion. The purpose of this study was to investigate the potential role of morphologic and diffusion MR imaging features in the prediction of EGFR amplification status in patients newly diagnosed with glioblastoma.
Materials and Methods
Standard Protocol Approvals, Registrations, and Patient Consents
This retrospective study was granted a Waiver of Informed Consent by the local institutional review board. The study was approved by the hospital privacy board and was compliant with Health Insurance Portability and Accountability Act regulations.
Patients
We retrospectively searched a hospital data base for patients newly diagnosed with glioblastoma with known EGFR amplification status treated between September 1, 2008, and October 31, 2011. As summarized in Fig 1, we determined the main patient cohort of 147 consecutive patients after applying the following inclusion criteria: 1) known EGFR amplification status; 2) pathologic diagnosis of glioblastoma according to revised World Health Organization criteria after biopsy, subtotal resection, or gross total resection; and 3) preoperative conventional brain MR imaging. Charts were reviewed to determine overall survival.

Main patient cohort.
Conventional MR Imaging Parameters
MR imaging was performed with 1.5T (Signa Excite, HDx; GE Healthcare, Milwaukee, Wisconsin) and 3T magnets (Discovery 750; GE Healthcare). We acquired all images by using 5-mm section thickness and no intersection gap. The standard preoperative imaging protocol consisted of sagittal and axial T1-weighted images; axial T2-weighted images; axial gradient recalled-echo (GRE) or SWI; axial DWI with ADC maps; and contrast coronal, sagittal, and axial T1-weighted images. DWI was performed with single-shot echo-planar imaging by use of acquisitions at b-value = 0 s/mm2 and b-value = 1000 s/mm2. Gadopentetate dimeglumine (Magnevist; Bayer HealthCare Pharmaceuticals, Wayne, New Jersey) was injected though a peripheral venous catheter (18–21 gauge) at doses standardized by patient body weight (0.2 mL/kg body weight, to a maximum of 20 mL). The same dose of contrast was administered for both 1.5T and 3T scans.
Morphologic MR Imaging Signs
Two board-certified radiologists (one with 7 years of experience, and the other with 13 years of experience and holding a Certificate of Added Qualification in neuroradiology) independently analyzed the MR imaging scans while blinded to the EGFR amplification status. The readers scored 8 different MR imaging signs and resolved disagreements by consensus. Each conventional MR imaging was scored in a binary fashion according to the presence or absence of the following morphologic signs: 1) border sharpness, 2) cystic/necrotic change, 3) hemorrhage, 4) T2-isointense signal, 5) restricted water diffusion, 6) nodular enhancement, 7) subependymal enhancement, and 8) multifocal discontinuous enhancement. Border sharpness was visually determined by inspection of the enhancing margins of the tumor on contrast T1-weighted images. We evaluated the presence of hemorrhage by inspecting SWI (n=74); GRE (n=31); or, if neither available, by inspecting the b-value = 0 DWI (n=42). The hemorrhage-sensitive GRE and SWI sequences were being incorporated into our standard imaging protocols during the study period, with SWI acquired in all cases since early 2011. Restricted water diffusion was determined by assessment of hyperintense areas on b-value = 1000 s/mm2 DWI that were confirmed as hypointense on ADC images, for exclusion of studies where hemorrhage, T2 shinethrough effects, or artifacts might mimic restricted water diffusion. To replicate the usual clinical practice, we qualitatively reviewed all studies at a standard 5-panel PACS station (Centricity Radiology, GE Healthcare).
Quantitative DWI Analysis
The quantitative DWI analysis and ADC measurements were performed by a trained operator (with 6 months of experience) under the direct supervision of a board-certified radiologist with a Certificate of Added Qualification in neuroradiology (with 13 years of experience), who verified the ROIs in all patients. The quantitative analyses were performed while blinded to the patient EGFR amplification status and the recorded morphologic MR imaging signs (including visual assessments of restricted water diffusion). Each scan was transferred to an off-line commercially available workstation and processed by use of commercially available software (FuncTools 4.6 on Advantage Workstation; GE Healthcare) to calculate ADC images from the DWI. The contrast T1-weighted images were selected as the underlay for the ADC images, and the section containing the maximal contrast-enhancing portion of the tumor was chosen. An ROI was manually drawn around the entire contrast-enhancing tumor while deliberately excluding blood vessels and areas of cystic, necrotic, and hemorrhagic change that might affect ADC values. The ROI was then mapped to the corresponding ADC images, and measurements of ADCmean, ADCmin, and ADCmax from that ROI were recorded. In addition, ≤4 small circular ROIs (50–75 mm2) were manually placed over solid areas of the enhancing tumor that also displayed restricted water diffusion to select the maximal ADC hypointensity, and the minimal value was recorded as ADCROI. This is a standard technique that has been described as highly reliable and reproducible for ROI measurements.21,22 We also obtained ADCratios by dividing ADCROI by ADCnormal placed in the normal contralateral brain. Quantitative DWI analyses were performed in 142 scans; 5 scans (all in patients without EGFR amplification) were discarded because of technical errors in measurement of ADC, though qualitative analyses were performed.
EGFR Analysis
EGFR amplification status was determined by interphase/nuclear fluorescence in situ hybridization techniques on paraffin sections. Per tissue sample, a total of 200 cells were analyzed and the results reported as the highest level of EGFR amplification in chromosome copies per cell. EGFR amplification was defined as ≥10 copies per cell.
Statistical Analysis
Univariate analysis by the χ2test or the Fisher exact test was performed to determine the relative usefulness of the morphologic MR imaging signs in the prediction of EGFR amplification status. The Wilcoxon rank sum test was performed to evaluate the quantitative ADC values. Significance was set to P < .05.
Results
Demographic and patient information for the 147 main cohort participants are summarized in Table 1. A total of 60 patients (40.8%) were determined to have high levels of EGFR amplification, whereas 87 (59.2%) did not. The median interval between the MR imaging scan and surgery was 4 days (standard deviation, 10 days).
Characteristics of patients
Morphologic MR Imaging Signs
The morphologic MR imaging results are summarized in Table 2. All patients in the cohort had preoperative morphologic MR imaging available for qualitative analysis. Restricted water diffusion occurred in 37% of patients with EGFR amplification and in 21% of patients without EGFR amplification (P = .04). A representative case is shown in Fig 2. The related sensitivity (36.7%; 95% CI, 24.9%–50.2%) and specificity (79.1; 95% CI, 68.7%–86.8%), however, were moderate with area under the curve for the receiver operating characteristic curve = 0.579. The remaining 7 morphologic MR imaging signs were not significant (P > .12).
Qualitative analysis of morphologic MR imaging signs (n=147)

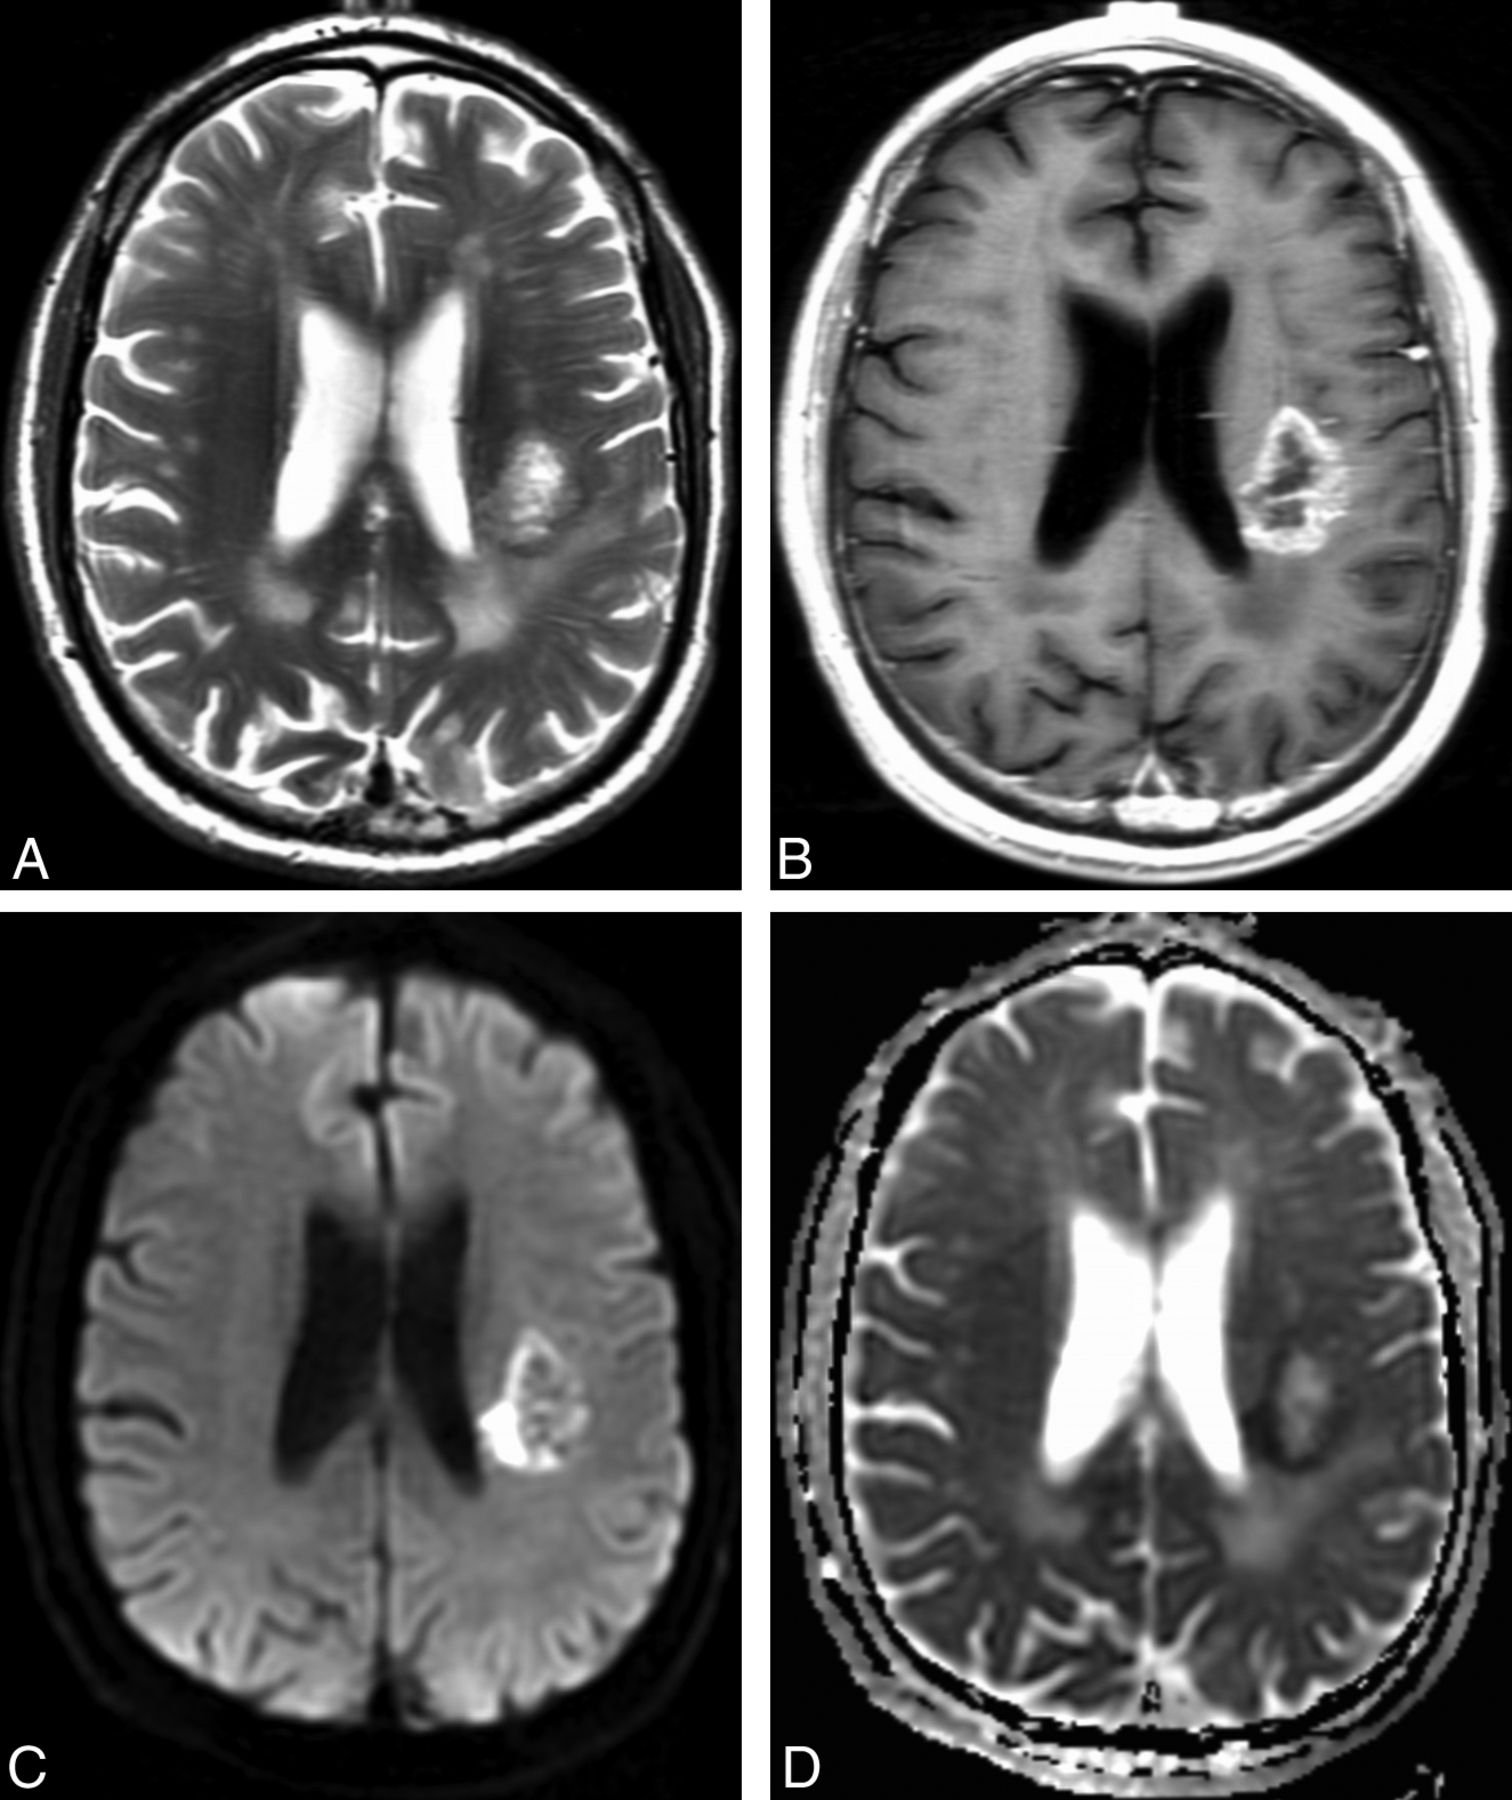
Representative example of restricted water diffusion in an EGFR-amplified tumor. Axial T2-weighted (A) and contrast T1-weighted (B) images show a heterogeneously enhancing glioblastoma in the left posterior corona radiata. DWI (C) shows hyperintense peripheral restricted water diffusion that is confirmed on the ADC image (D) with a hypointense signal, and corresponds to the enhancing fraction seen in (B). ADCmean measurement of the enhancing fraction was 0.13 × 10⁻³ mm2/s. Fluorescence in situ hybridization analysis revealed high-level EGFR amplification with 98% of 200 analyzed cells showing > 20 signals for EGFR.
Quantitative DWI Analysis
Lower ADC values were found in EGFR-amplified tumors with all metrics showing P < .01, as summarized in Table 3. The highest correlations were found for ADCROI (P = .0003) and ADCmean (P = .0007). The predictive power was moderate, with the receiver operating characteristic analysis showing a maximal area under the curve for ADCROI = 0.680.
Quantitative analysis of ADC correlation with EGFR (n=142)
Discussion
The use of MR imaging–based parameters for noninvasive tumor molecular characterization is an emerging field in neuroimaging.23⇓⇓⇓⇓⇓⇓–30 By providing information about the molecular status of tumors when tissue is not available for analysis, molecular characterization may have direct implications for management and potentially provide therapeutic value. Imaging parameters may also provide insights into the biologic behavior of tumors and information on hypoxia, cell attenuation, and angiogenesis, as related to different tumor molecular subtypes. In this study, we focused on EGFR amplification, one of the most common molecular alterations in glioblastomas and a hallmark of the classic glioblastoma subtype. Approximately 40% of our patients demonstrated EGFR amplification, which is in line with a previous study reporting EGFR amplification in up to 50% of patients with glioblastoma.31 We found that restricted water diffusion correlated with EGFR amplification as assessed by quantitative analysis at a dedicated postprocessing workstation (P = .01 to .0003), as well as qualitative visual analysis at a clinical PACS reading station (P = .04). These data suggest a potential role for diffusion analysis in the prediction of EGFR amplification status in glioblastoma. Aside from restricted water diffusion, we did not find other commonly reported imaging characteristics to be useful in predicting EGFR amplification.
The quantitative ADC values correlated more highly (P = .01 to P = .0003) than the qualitative visual inspection of DWI and ADC images (P = .04). The ADC measurements confirmed that restricted water diffusion correlated with EGFR amplification. Selection of the single maximal abnormality (ADCROI) after placement of multiple small ROIs outperformed a normalized ratio (ADCratio) and segmentation of the enhancing tumor (ADCmean, ADCmin, ADCmax). We did not detect any significant correlations between the morphologic MR imaging tumor characteristics and EGFR amplification. Previous studies,23,32 which have used sophisticated texture analysis methods at dedicated postprocessing workstations, have been able to correlate some morphologic MR imaging metrics. For example, Aghi et al32 concluded that that the ratio of T2-bright volume to T1-enhancing volume and T1 and T2 border sharpness coefficients were useful predictors for EGFR amplification status. In a similar fashion, Diehn et al23 reported on the usefulness of a ratio of contrast-enhancing tumor to necrotic tumor in the prediction of EGFR overexpression. The purpose of our morphologic MR imaging analysis was to isolate imaging features that are commonly described in radiology reports for usual clinical practice after visual analysis at a PACS workstation without any additional postprocessing steps.
Increased EGFR amplification has been associated with increasing levels of tumor proliferation, angiogenesis, and invasiveness.5,33 The mechanisms for restricted water diffusion are complex, with increased cellularity such as in lymphoma suggested to be the most important factor.34 Restricted water diffusion has also been well correlated with ischemia and cytotoxic edema; it is unclear if restricted water diffusion occurs because of increases in tumor cellularity or ischemia, or both.15,35,36 Many tumors including glioblastoma overexpress hypoxia-inducible transcription factor-2 alpha, a powerful driver of oncogenesis that helps modulate the downstream EGFR-signaling pathway.36⇓–38 The relationship between EGFR and tumor ischemia is further complicated by studies suggesting a protective effect of EGFR inhibition on hypoxic tumor cells that has limited the efficacy of the EGFR inhibitors in clinical trials.39,40 The patients in the current study all had untreated glioblastoma, which precludes treatment-related confounders such as radiation, antiangiogenic therapy, and EGFR inhibitor therapy on diffusion characteristics. Although this area requires further study, we suggest that tumor cellularity and ischemia probably both play a role in causing increased restricted water diffusion with EGFR amplification.
Several potential applications are available for predicting EGFR amplification status in patients with glioblastoma. The first relates to work from The Cancer Genome Atlas Research Network,3 which proposes the molecular classification of glioblastomas into Classical, Mesenchymal, Proneural, and Neural subtypes on the basis of gene expression aberrations of EGFR, NF1, and PDGFRA/IDH1. Of these, EGFR amplification was observed in 97% of the Classical subtype and less commonly in the other subtypes,3 indicating that the noninvasive imaging profiling of EGFR amplification may have a role in predicting the Classical vs other subtypes. Designating the Classical subtype is important for clinical decision-making, as this information may help predict patient prognosis and patterns of tumor progression, particularly when combined with imaging-based biomarkers.4,28 Second, despite the promising but tempered efficacy of early-generation EGFR tyrosine kinase inhibitors such as erlotinib, gefitinib, and vandetanib,41⇓⇓⇓–45 it is possible that subsequent EGFR inhibitors will provide durable improvements in outcome. Recent comparisons to non–small-cell lung cancer have shown that efficacy correlates with higher EGFR receptor binding-site occupancies,25,46⇓⇓–49 suggesting avenues for development of future EGFR inhibitors to use in selected glioblastomas. Therefore, the importance of EGFR amplification status may grow with the development of newer treatments. Third, studies have suggested that serial imaging with ADC analysis and quantification may be useful to document response to treatment,50,51 though this has not been performed with EGFR inhibitor studies. Following EGFR amplification status during treatment with a targeted chemotherapeutic agent may provide insight into the efficacy of the treatment and subsequent treatment-induced changes in the tumor.
One potential limitation of our investigation is its retrospective nature. By examining preoperative conventional MR imaging scans in treatment-naïve primary glioblastomas, however, we present a homogeneous patient population from which correlations with EGFR amplification status are made. A second potential limitation was the ROI technique used to quantify the presence or absence of restricted water diffusion. Because our study was retrospective in that the exact sites of pathologic analysis were not recorded, it is possible that the measured levels of EGFR amplification did not directly reflect the maximal diffusion abnormalities measurements. Further study with locus-specific radiologic-histopathologic correlation would help clarify this relationship. The intratumoral cell-to-cell variability of EGFR expression has also been described as relatively low,31 suggesting that the observed correlations accurately reflect the relationship between EGFR expression and restricted water diffusion. Third, there was no consensus definition of EGFR amplification.31,52 We defined EGFR amplification as ≥10 copies per cell after discussion with experienced neuro-oncologists, neuropathologists, neurosurgeons, and neuroradiologists at a National Cancer Institute–designated Comprehensive Cancer Center. This does not take into account the number of cells containing the gene amplification and may not be representative of the entire tumor; however, this relatively conservative interpretation is consistent with standard clinical and research practice at our institution and around the country.
Conclusions
Our study suggests possible usefulness for DWI to predict EGFR amplification status in patients with glioblastoma. EGFR status information may be useful in the prediction of Classical subtype glioblastomas. Imaging has potential value for patients in whom multiple genetic and molecular analyses may be difficult or infeasible, such as when tissue is not available for study. Further research with locus-specific histopathologic correlations and follow-up after patient treatment may help us to fully explore the prognostic value and underlying physiologic basis of restricted water diffusion in EGFR amplification.
Acknowledgment
We thank Ms. Judith A. Lampron for her expert editorial advice.
Footnotes
R.J.Y. and A.G. co-drafted the original manuscript together and contributed equally as co-first authors. Z.Z. and W.S. performed statistical analysis.
Disclosures: Robert Young—UNRELATED: Consultancy: ICON Medical Imaging, Comments: Blinded independent reviewer. Jerome Graber—UNRELATED: Payment for Lectures (including service on Speaker Bureaus): Speaker bureau for Biogen Idec; Other: Participation in market research studies for Olson Online Systems. Alisa Prager—UNRELATED: Grants/Grants Pending: MSKCC, NCI, Medical Student Summer Research Fellowship Program.* Antonio Omuro—UNRELATED: Consultancy: Roche, Novocure. *Money paid to institution.
REFERENCES
- 1.
- 2.
- 3.
- 4.
- 5.
- 6.
- 7.
- 8.
- 9.
- 10.
- 11.
- 12.
- 13.
- 14.
- 15.
- 16.
- 17.
- 18.
- 19.
- 20.
- 21.
- 22.
- 23.
- 24.
- 25.
- 26.
- 27.
- 28.
- 29.
- 30.
- 31.
- 32.
- 33.
- 34.
- 35.
- 36.
- 37.
- 38.
- 39.
- 40.
- 41.
- 42.
- 43.
- 44.
- 45.
- 46.
- 47.
- 48.
- 49.
- 50.
- 51.
- 52.
- Received December 31, 2012.
- Accepted after revision March 12, 2013.
- © 2013 by American Journal of Neuroradiology