Abstract
BACKGROUND AND PURPOSE: Cerebral infarct volume as observed in follow-up CT is an important radiologic outcome measure of the effectiveness of treatment of patients with acute ischemic stroke. However, manual measurement of CIV is time-consuming and operator-dependent. The purpose of this study was to develop and evaluate a robust automated measurement of the CIV.
MATERIALS AND METHODS: The CIV in early follow-up CT images of 34 consecutive patients with acute ischemic stroke was segmented with an automated intensity-based region-growing algorithm, which includes partial volume effect correction near the skull, midline determination, and ventricle and hemorrhage exclusion. Two observers manually delineated the CIV. Interobserver variability of the manual assessments and the accuracy of the automated method were evaluated by using the Pearson correlation, Bland-Altman analysis, and Dice coefficients. The accuracy was defined as the correlation with the manual assessment as a reference standard.
RESULTS: The Pearson correlation for the automated method compared with the reference standard was similar to the manual correlation (R = 0.98). The accuracy of the automated method was excellent with a mean difference of 0.5 mL with limits of agreement of −38.0–39.1 mL, which were more consistent than the interobserver variability of the 2 observers (−40.9–44.1 mL). However, the Dice coefficients were higher for the manual delineation.
CONCLUSIONS: The automated method showed a strong correlation and accuracy with the manual reference measurement. This approach has the potential to become the standard in assessing the infarct volume as a secondary outcome measure for evaluating the effectiveness of treatment.
ABBREVIATIONS:
- CI
- confidence interval
- CIV
- cerebral infarct volume
- IRG
- intensity-based region-growing
Acute ischemic stroke is the leading cause of severe disability in adults and the third leading cause of death. Currently, intravenous alteplase is the only treatment used in routine clinical practice that has been shown to be beneficial for patients with acute ischemic stroke in a randomized controlled trial.1,2 However, new intra-arterial treatments are the subject of research and have evolved as standard care in large-vessel occlusion in some medical centers.3⇓–5 The cerebral infarct volume as observed in early follow-up CT has been suggested as an important surrogate or auxiliary radiologic outcome measure of the effectiveness of intravenous and intra-arterial treatment.6 As such, CIV can be used to support research on endovascular approaches to stroke. The CIV can be measured by using manual delineation of the whole infarct volume, usually section by section. Alternatively, the volume can be estimated by using the ABC/2 formula, which was originally developed for hemorrhage-volume estimation.7 Especially the manual delineation is a tedious task, and the ABC rule is only a rough approximation of the total CIV. The aim of this study was to design an automated CIV measurement and to validate this method by comparison with manual delineation.
Materials and Methods
Patient Selection
NCCT image data of 34 consecutive patients with a clinical diagnosis of acute ischemic stroke and with early follow-up NCCT were retrieved from our multicenter prospectively collected data base. The inclusion criteria were the following: a clinical diagnosis of acute stroke with a deficit on NIHSS of ≥2 points; intracranial arterial occlusion of the distal ICA, middle (M1/M2), or anterior (A1/A2) cerebral artery; the possibility of starting treatment within 6 hours of onset; and age of 18 years or older. Patients with craniectomy and craniotomy were excluded. All patients or legal representatives signed informed consents.
Imaging Protocol
NCCT was performed on 8 different scanners in 10 different hospitals (Table 1). In all patients, whole-brain imaging was performed with thin-section acquisition by using multisection CT scanners of at least 16 sections but mostly ≥64 sections. From these thin-section data, 5-mm-thick images were reconstructed, resulting in 25–50 sections. The image data were anonymized and digitally stored in a central data base.
List of the number of patients per hospital, CT scanner used, and reconstruction kernel
Automated Cerebral Infarct Volume Measurements
Automated volume measurements were performed by using an intensity-based region growing algorithm implemented in Matlab (MathWorks, Natick, Massachusetts). This method iteratively examines all neighboring voxels of a segmented volume to determine whether these neighboring voxels should be included in the segmentation. A voxel is included if the difference in its intensity and the average intensity of the segmented volume is smaller than a predefined threshold. The region-growing was repeated for multiple thresholds. The range of thresholds was 1.5–4.5 HU with steps of 0.5 HU, resulting in 7 repeated segmentations. Region-growing was initiated after the placement of a seed point in the infarcted hypoattenuated area. The image data may also show old or chronic infarctions. Placement of a seed point by an experienced radiologist assured that the “correct” infarcted lesion was selected. With the relatively thick sections of 5 mm, partial volume effects were apparent, resulting in higher intensities near the skull.
To correct for this artificial increase of intensity, we performed a polynomial fitting of average intensities as a function of the distance to the skull. To keep the algorithm from leaking into the contralateral hemisphere, we detected the midline and used it as a boundary for the region-growing algorithm. Determination of the midline was based on the geometric center and the most extreme midsagittal bone or nasal cartilage structures present on the scan, such as the mental protuberance or the nasal bone. The hypoattenuated area in the contralateral hemisphere closest to the cerebral geometric center was segmented and classified as “ventricle.” Its coordinates and intensity were mirrored to the affected hemisphere and used to distinguish the ventricle from the infarct area to prevent the IRG algorithm from including the hypoattenuated ventricles in the segmentation.
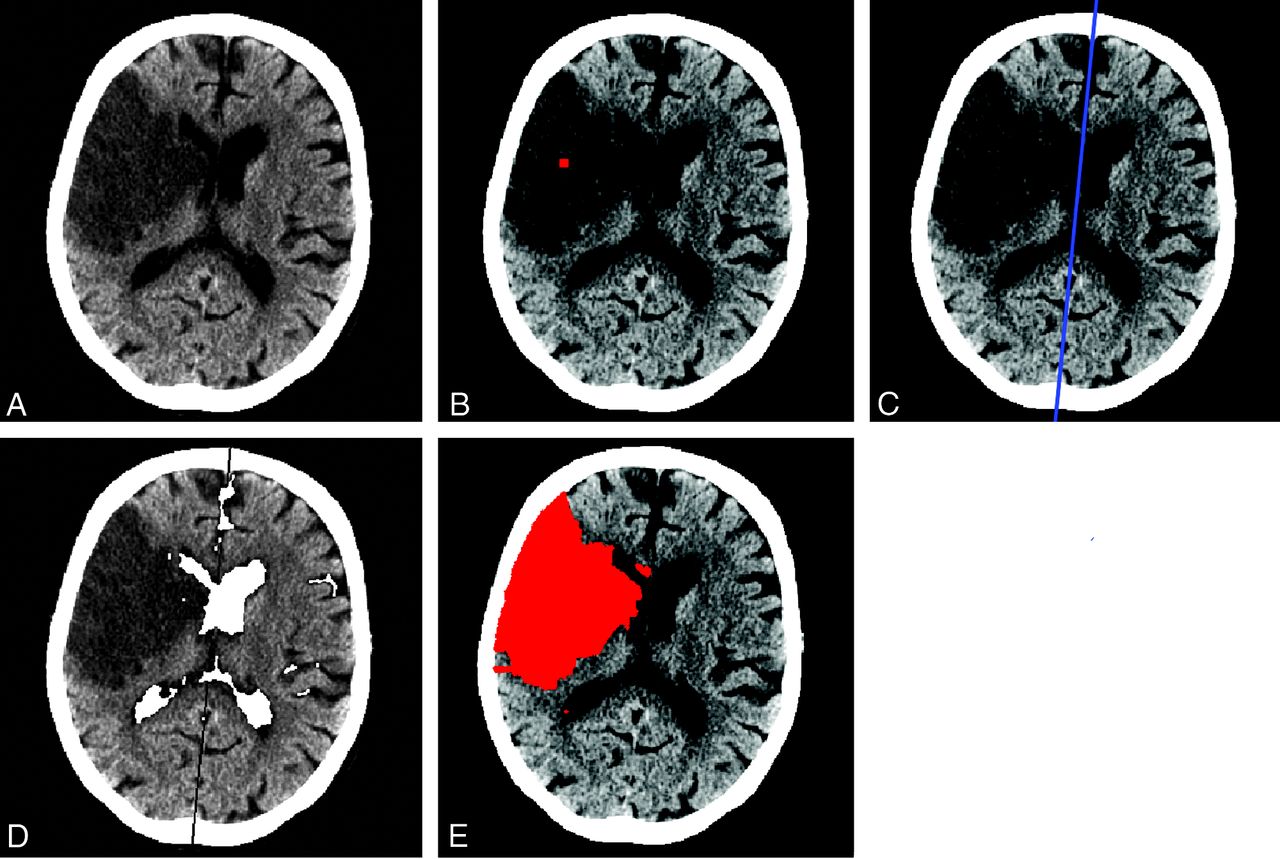
Reperfusion and thrombolysis in patients with acute ischemic stroke can result in cerebral hemorrhage.8 In this study, this hemorrhage is considered part of the infarcted area. Due to the high intensity of blood, a straightforward IRG algorithm would not include the hemorrhage in the segmentation. The final IRG segmentation was inspected for high-intensity areas that were entirely surrounded by segmented infarct tissue, to correct for this exclusion. These volumes were consequently included in the final segmentation. The IRG for the different thresholds resulted in a limited number of segmentations of the CIV. From this set of segmentations, an observer can choose the CIV segmentation that agrees most with the images. The segmentation pipeline is illustrated in Fig 1.

Illustration of the automated CIV segmentation pipeline. This figure shows an infarct in the right hemisphere in a 6-day follow-up CT. A, The unprocessed NCCT. B, A seed point is positioned within the infarcted area by an observer. C, Determination of the midline. D, Segmentation of the ventricles, E, The final segmentation representing the CIV.
Manual Infarct Volume Measurement
The CIVs of all images were manually delineated by 2 experienced radiologists (L.F.B. and C.B.M.), both with >10 years of experience. The infarct volume was delineated section-by-section by using ITK-SNAP 2.2.0 (http://www.itksnap.org/pmwiki/pmwiki.php?n=Main.Downloads).9 Both observers were blinded to all clinical information and each other's results. The manual measurements were used as the reference standard to evaluate the accuracy of the automated method.
Interobserver Variability
The interobserver variability of the manual CIV measurements was assessed by constructing scatterplots and the calculation of the Pearson correlation coefficient and its 95% confidence interval. Bland-Altman analysis was performed to assess the bias and limits of agreement, where the bias was defined as the mean paired difference and the limits of agreement were defined as the bias ± 1.96 times the SD of the difference.10 For the relative difference (paired difference divided by the average), the mean and SD were calculated. Furthermore, the Dice coefficient between the 2 observers was determined.11
Accuracy
We wanted to estimate how the difference between the automated and the manual method is related to manual interobserver variability as can be expected in clinical practice. As such, the automated CIV segmentation was compared with the manual assessment of a single observer (observer 1). The accuracy of the automated segmentation was assessed by the Pearson correlation coefficient and its 95% confidence interval, Bland-Altman analysis, and calculation of Dice coefficients. Furthermore, the mean and SD of the relative paired difference were calculated.
Results
Twenty-five of the 34 patients had an MCA occlusion, 8 patients had a carotid-T occlusion, and 1 patient had an occlusion of the anterior cerebral artery. The mean age was 62 ± 13 years. The range of the NIHSS score was 6–30 (mean, 17.7 ± 5.7). The mean onset to follow-up scanning time was 4.1 ± 2.3 days. The mean manual CIV measurement was 138 ± 106 mL, with only a slight underestimation of the automated CIV measurement of 137 ± 106 mL.
Interobserver Variability
The interobserver variability of the manual measurement is illustrated in On-line Fig 1 and Table 2. The Pearson correlation coefficient was 0.98 (95% CI, 97%–99%; P < .01). The Bland-Altman analysis resulted in a bias of 1.6 mL with limits of agreement ranging from −40.9 to 44.1 mL. The relative CIV difference ranged from −33% to 127% with a mean of 11 ± 27%. The Dice coefficient for the observers was 0.84 ± 0.08 and ranged from 0.63 to 0.94.
Interobserver variability of manual CIV measurements and comparison of the manual and automated method
Accuracy
The correlation of the automated measurement with the manual reference is presented in On-line Fig 2 and Table 2. The Pearson correlation coefficient was 0.98 (95% CI, 96%–99%; P < .01). The Bland-Altman analysis indicated an average difference in CIV of 0.5 mL, with limits of agreement ranging from −38.0 to 39.1 mL. The relative CIV difference was 4 ± 20%. The Dice coefficient was 0.74 ± 0.13 and ranged from 0.42 to 0.90.
Discussion
In this study, we have presented an automated CIV measurement in early follow-up NCCT scans. Evaluation with 34 patients with ischemic stroke showed a high agreement with manual assessment. This automated measurement allows a convenient assessment of the CIV to be used as a secondary outcome measurement of the effectiveness of treatment in patients with acute ischemic stroke.
The interobserver agreement of the manual delineation was high, with only a small bias. The accuracy of the automated method was excellent, with limits of agreement between −38 and 39.1 mL compared with the manual reference method. The correlation coefficient of the automated segmentation with the manual reference was also high (0.98). The average Dice coefficient of 0.74 for the automated and manual method was high but approximately 10% lower than the Dice coefficient of the 2 manual delineations. Retrospective analysis of the potential causes of a lower agreement for the Dice coefficient than for the manual comparison showed that this can partly be explained by the difference in the procedure; in the manual comparison, the observers perceived an image on the screen and delineated it by hand, resulting in smooth edges. The automated method segments the image on a voxel-by-voxel basis, which results in ragged edges. In patients with multiple infarcts or cerebral hemorrhage, the automated measurements resulted in small underestimations of the CIV. These deviations were mainly caused by hemorrhages that were not recognized by the software as a part of the infarct. In 3 of the 9 cases with hemorrhages, the hemorrhage was not included in the segmentation (Fig 2).

Example of incorrect automated segmentation due to hemorrhage and erroneous midline determination. A, NCCT scan of a patient with a midline shift. The blue line indicates the midline determined by the algorithm. The hemorrhage is indicated by the white arrow. B, The infarcted area delineated by observer 1. C, Incorrect outcome of automated segmentation. The hemorrhage is unrecognized as infarct, and the infarcted tissue is shifted over the original midline. This shift results in underestimation of the CIV.
The region-growing algorithm cannot bridge a gap between infarcted areas due to the use of a single seed point. As a result, only single infarcts were detected. These were detected in 3 cases and are demonstrated in Fig 3. This problem could be solved by placing multiple seed points. However, this was not implemented in the current research. The placement of a seed point also avoids the inclusion of old or chronic infarcts in the segmentation. The same holds for other hypoattenuated lesions, such as chronic ischemic white matter changes and vasogenic edema caused by tumors: if these lesions are not connected to the CIV that is selected by the observer, these lesions are not included in the segmentation. This limitation can also be considered advantageous because old infarcts should not be included in the evaluation of the effectiveness of the treatment of patients with acute ischemic stroke.

Example of incorrect automated segmentation due to multiple infarcts. A, NCCT scan of a patient with multiple infarcts, 2 new infarcts (black arrows) and 1 old infarct (white arrow). B, The infarcted area delineated by observer 1. C, Incorrect outcome of automated segmentation. The old infarct and one of the new infarcts are unrecognized as infarcts. As a result, the automated segmentation underestimates the CIV.
Some relative CIV differences were large (≤127%). However, larger CIV differences were only seen in small CIVs and do not have important implications in the interpretation of these data. Also for the relative CIV measurements, the agreement of the automated method with observer 1 was better than the agreement between the observers.
In patients with a midline shift, the automated midline determination may fail because it is based on information of the bone structures only (Fig 2). As a result, the automated segmentation may underestimate the CIV. Incorrect midline determination occurred in 2 cases, which resulted in incorrect ventricle determination on the contralateral hemisphere. However, this did not have consequences for the final segmentation. Due to the mass effect and therefore smaller ventricles on the affected hemisphere, the ventricles still lay within the searched area and the CIV was not underestimated. In a single case, the sulci were included in the segmentation, which slightly affected the CIV measurement.
So far, manual delineation of the CIV has proved to be the most reliable measurement. Kothari et al7 and Lyden et al12 presented alternative methods suitable for CIV measurement. Both methods showed a good correlation with manual delineation. However, these methods are quite tedious. A semiautomated technique based on pixel intensity was introduced by DeLeo et al13 and was shown to be useful for estimating CSF and white and gray matter, but this method was not applied to estimate the CIV. van der Worp et al14 used and validated this method for CIV estimation, with a low accuracy as an outcome. This can be assigned to the considerable amount of healthy tissue that was classified as infarct. Another semiautomated technique was presented by Maldjian et al15 and may provide information on CIV but has not been sufficiently tested. This method was only validated for regions of the lentiform nucleus and insula and did not show direct results for CIV measurement. Atlas-based segmentation methods showed positive results when predicting outcomes of patients with acute stroke but failed in providing information on the effectiveness of a treatment.16,17 Standardized atlases do not always match patient NCCT images after alteration of the anatomy due to the mass effect and are, therefore, more suitable in a short follow-up.15
The population of 34 patients may appear rather small. However, sample-size calculations show that the number of patients is sufficient. The worst correlation coefficient that we found in this study was 0.74. For a high-value power of .95 and a low-value α of .01, sample size calculations indicated that 28 patients are required. For increasing correlation coefficients as we observed, this number decreases. Furthermore, the confidence intervals and P values for the correlation coefficients were small, 2%–3% and <.01, respectively. Including more patients would, therefore, have little added value.
This study was performed on image data of a population of patients who were eligible for endovascular treatment of stroke. As a result, this study may be affected by a selection bias. For example, most of the patients did not respond to intravenous thrombolysis treatment; the patients had a relatively high NIHSS score (range, 6–30; mean, 17.7 ± 5.7), and no patients with a posterior occlusion or chronic or lacunar stroke were included. As such, a validation for other types of stroke is still needed. Furthermore, we used cases with image data with a follow-up period of 1–9 days. The attenuation of a stroke lesion is expected to change with time. The variable time window that was used to include patients may influence the performance of the automated method because the attenuation of the stroke lesions may have a wide variety of attenuation reductions.
The study protocol requires 5–7 days of follow-up CT. However, for some cases, it was not possible to have a follow-up scan during this time, for example, due to the death of a patient before this period. Furthermore, some patients were transferred back to referring hospitals, and follow-up scanning for research purposes only is more difficult to perform during weekends. The automated segmentation time was rather high; the calculation took approximately 2 hours on a modern computer per patient. The computation times need to be dramatically reduced to make an approach as presented here available for clinical practice. However, the analyses can be performed off-line after the placement of a seed point.
We have included CT data from 9 institutions acquired with 8 different types of scanners. This diversity of scanners and scanning protocols may result in variation of image quality. In initial experiments, it was observed that the section thickness is an especially important parameter. With the relatively thick sections of the CT data that were used in this study, partial volume effects were apparent. This outcome resulted in higher CT values of brain tissue near the skull. These high CT values resulted in an underestimation of the infarct volume of the automated method. To correct for these partial volume effects of the thick CT sections, we performed a measurement of average intensities as a function of the distance to the skull, which allowed a correction of these partial volume effects. CT scans with thinner sections are less affected by partial volume effects but have, generally, a higher noise level. The performance of the presented method on thin-section CT data has not yet been assessed, to our knowledge.
The excellent accuracy, high correlations, and the low manual input required show the potential of implementing the software in clinical practice. However, the required calculation time was high and needs to be improved. Placement of multiple seed points should reduce the multiple infarct problem and underestimation. In NCCT scans with a long follow-up, correct midline determination is of great importance because of the larger mass effect and midline shift with time.18 Automated midline detection19 could be beneficial for improvement of our automated CIV measurement.
Conclusions
In this study, an automated CIV measurement is presented. There was excellent accuracy and strong correlation with the manual reference measurement. This approach is an easy-to-use and investigator-independent solution in assessing the infarct volume and, as such, has the potential of becoming the standard in determining this secondary outcome measure.
Acknowledgments
The MR CLEAN investigators: P. Fransen (Erasmus Medical Center, Rotterdam, the Netherlands), D. Beumer (Erasmus Medical Center, Rotterdam, the Netherlands), O. Berkhemer (Academic Medical Center [AMC], Amsterdam, the Netherlands), C.B. Majoie (AMC, Amsterdam, the Netherlands), A. van der Lugt (Erasmus Medical Center, Rotterdam, the Netherlands), R. van Oostenbrugge (Medical Center Maastricht, Maastricht, the Netherlands), W. van Zwam (Medical Center Maastricht, Maastricht, the Netherlands), Y. Roos (AMC, Amsterdam, the Netherlands), D. Dippel (Erasmus Medical Center, Rotterdam, the Netherlands), P. Brouwer (Erasmus Medical Center, Rotterdam, the Netherlands), M. Wermer (Leiden University Medical Center [LUMC], Leiden, the Netherlands), M. van Walderveen (LUMC, Leiden, the Netherlands), P. Vroomen (University Medical Center Groningen [UMCG], Groningen, the Netherlands). O. Eshghi (UMCG, Groningen, the Netherlands), E. van Dijk (University Nijmegen Medical Centre [UMCN], Nijmegen, the Netherlands), J. de Vries (UMCN, Nijmegen, the Netherlands), P. de Kort (St. Elisabeth, Tilburg, the Netherlands), W van Rooij (St. Elisabeth, Tilburg, the Netherlands), K. Keizer (Catharina, Eindhoven, the Netherlands), X. Tielbeek (Catharina, Eindhoven, the Netherlands), W. Schonewillie (St. Antonius, Nieuwegein, the Netherlands), J.A. Vos (St. Antonius, Nieuwegein, the Netherlands), B. de Bruijn (Haga Ziekenhuis, Den Haag, the Netherlands), L. van Dijk (Haga Ziekenhuis, Den Haag, the Netherlands), J. Boiten (Medisch Centrum [MC] Haaglanden, Den Haag, the Netherlands), G. Lycklama (MC Haaglanden, Den Haag, the Netherlands), J. Hofmeijer (Rijnstate Ziekenhuis, Arnhem, the Netherlands), J. van Oostayen (Rijnstate Ziekenhuis, Arnhem, the Netherlands), J. Kappelle (University Medical Center Utrecht [UMCU], Utrecht, the Netherlands), R. Lo (UMCU, Utrecht, the Netherlands), P. van den Berg (Isala Klinieken, Zwolle, the Netherlands), B. van Hasselt (Isala Klinieken, Zwolle, the Netherlands).
Footnotes
Disclosures: Aad van der Lugt—RELATED: Grant: Dutch Heart Foundation and 5 companies *Charles B. Majoie—RELATED: Grant: Dutch Heart Foundation. **Money paid to the institution.
MRCLEAN is partly funded by the Dutch Heart Foundation (2008T030) and by unrestricted grants from AngioCare BV, Covidien, Medac Gmbh/Lamepro, Penumbra Inc, and TOP Medical BV.
REFERENCES
- 1.
- 2.
- 3.
- 4.
- 5.
- 6.
- 7.
- 8.
- 9.
- 10.
- 11.
- 12.
- 13.
- 14.
- 15.
- 16.
- 17.
- 18.
- 19.
- Received September 4, 2012.
- Accepted after revision November 11, 2012.
- © 2013 by American Journal of Neuroradiology