Abstract
SUMMARY: Fifteen patients with intradural spinal lesions were examined with an optimized dynamic contrast-enhanced MR perfusion sequence at 1.5T and 3T. SNR and mean contrast-to-noise ratio were better on 3T compared with 1.5T (P ≤ .05). The goodness of fit of the Tofts and Tofts extended pharmacokinetic models was similar between 1.5T and 3T. Thus, dynamic contrast-enhanced MR perfusion of intradural spinal canal lesions is technically feasible at 1.5T and 3T, with better image quality at 3T.
ABBREVIATIONS:
- AUC
- area under the curve
- CNR
- contrast-to-noise ratio
- DCE
- dynamic contrast-enhanced
- Ktrans
- volume transfer constant
- ve
- extravascular extracellular volume fraction
- vp
- blood plasma fraction
Unlike the brain, the spinal cord is examined only by a few advanced imaging techniques; only diffusion-weighted imaging has attracted clinical interest,1 while spectroscopy remains challenging to implement.2 In humans, MR perfusion studies of spinal cord lesions are limited to very few related articles3,4 using DSC MR perfusion in the cervical region. However, the susceptibility artifacts and its semiquantitative nature limit this technique. Dynamic contrast-enhanced (DCE) perfusion uses a spoiled fast T1 gradient-echo sequence less sensitive to susceptibility artifacts and with higher spatial resolution. It is also a quantitative technique, not using a contralateral reference tissue.
To the best of our knowledge, our article describes, for the first time, the use of DCE MR perfusion for the evaluation of intradural spinal lesions in humans. Our purpose was to discuss the technical feasibility, pitfalls, and potential clinical advantages.
Materials and Methods
Patients
The study was approved by the ethics committee of Geneva University Hospitals, and informed consent of patients was waived. We have included 15 patients (11 men, 4 women; mean age, 48.7 years; age range, 24–72 years) with various intradural spinal lesions (On-line Table 1). Patients with bone lesions were not included.
MR Imaging Examination
The examinations were randomly performed on 2 MR imaging machines, 1.5T Aera (Siemens, Erlangen, Germany) (7 patients) and a 3T Magnetom Trio (Siemens).
T1 mapping was based on 2 T1 acquisitions with 2° and 15° flip angles. The dynamic acquisition was performed in the sagittal plane with a T1 volumetric interpolated breath-hold examination sequence with the following parameters for the 1.5T scanner: TR, 4.55 ms; TE, 1.63 ms; number of averages, 1; FOV, 220 mm; matrix, 154 × 192; flip angle, 12°; 20 sections; thickness, 3-mm; generalized autocalibrating partially parallel acquisition accelerator factor, 2; temporal resolution, 9.5 seconds; total acquisition time, 6 minutes and 3 seconds. The parameters were slightly adapted for the 3T scanner as follows: TR, 5.03 ms; TE, 1.74 ms; number of averages, 1; FOV, 220 mm; matrix, 138 × 192; flip angle, 12°; 20 sections; thickness, 3 mm; generalized autocalibrating partially parallel acquisition accelerator factor, 2; temporal resolution, 7.8; total acquisition time, 5 minutes and 12 seconds. The contrast injection was started after 2–3 measurements; we used a power injector with a 3-mL/s gadobutrol 0.1-mmol/kg bolus (Gadovist, 1.0 mmol/mL; Bayer Schering Pharma, Berlin, Germany), followed by a 3-mL/s saline flush.
The MR imaging protocol also included standard clinical sequences (T1, T2, and T1 after the gadolinium injection used for DCE perfusion). At the thoracic level, prevertebral saturation bands were used to compensate for the heart and large-vessel pulsations.
All images were inspected to detect relevant motion artifacts and to identify the contrast enhancement of the lesion, by V.C., a board-certified neuroradiologist with 2 years of experience in DCE MR perfusion imaging and 7 years of experience in neuroradiology.
Image Reconstruction
The data were reconstructed by using commercially available software (Olea Sphere 2.2; Olea Medical, La Ciotat, France). The analysis was performed by 1 reader (V.C.) unaware of the diagnosis at the moment of the analysis. No relevant movement artifacts were encountered; a movement-correction algorithm was applied to compensate for slight physiologic movements. The best vascular input function was selected automatically (usually in the vertebral, intercostal, or lumbar arteries or in the basivertebral veins) and checked visually. Model-independent analysis was performed, and maps of the area under the curve (AUC) of gadolinium were obtained. Pharmacokinetic modeling by using Tofts and Tofts extended models was also performed to derive maps of volume transfer constant (Ktrans) and extravascular extracellular volume fraction (ve); for the Tofts extended model, maps of blood plasma fraction (vp) were also obtained. Maps of χ2 (expressing the goodness of fit) were obtained for both models.
Image Review and Analysis
2D ROIs were drawn around the enhancing lesions on AUC maps, verified on coregistered gadolinium-enhanced T1 images, and copied on all timeframes of DCE perfusion. The SNR of DCE images was computed by dividing the mean intensity of the ROI baseline voxels by the SD of a large ROI drawn in the air. Relative signal enhancement was computed by dividing the difference between peak signal and mean baseline signal by the mean baseline signal. The mean contrast-to-noise ratio (CNR) was computed by dividing the difference between the mean intensity of the ROI voxels after gadolinium injection and the mean baseline voxels, by the SD of a large ROI drawn in the air.
ROIs were copied on all the other maps (Ktrans, ve, vp, χ2). Only voxels with ve or vp values between 0 and 1 were used for analysis. Mean values, SD, and 95% confidence intervals were recorded for each of the parameters. SNR, relative signal enhancement, CNR, and χ2 were compared by using unpaired 2-tailed t tests with different variances.
Results
All examinations were technically correct, without significant motion artifacts and with clearly visible contrast enhancement on dynamic series.
SNR and mean CNR were better on 3T compared with 1.5T (On-line Fig 1; P ≤ .05); relative signal enhancement was similar (P = .4).
The goodness of fit was similar for both pharmacokinetic models for most lesions (χ2 between 100 and 450), except for hemangioblastomas (χ2 between 450 and 13,000); for a patient with a hemangioblastoma (No. 11), the parametric maps based on the Tofts extended model could not be obtained at all. Goodness of fit was not significantly different between 1.5T and 3T (P = .09 for the Tofts model and P = .1 for Tofts extended model).
The values of model-free AUC and various pharmacokinetic parameters for all the patients are presented in On-line Tables 2 and 3. Some examples of pathologies are presented in Fig 1 (spinal cord glioblastoma) and in the On-line Figs 2–4 (meningioma and schwannoma, respectively; enhancement curves of representative cases of all the pathologies studied).

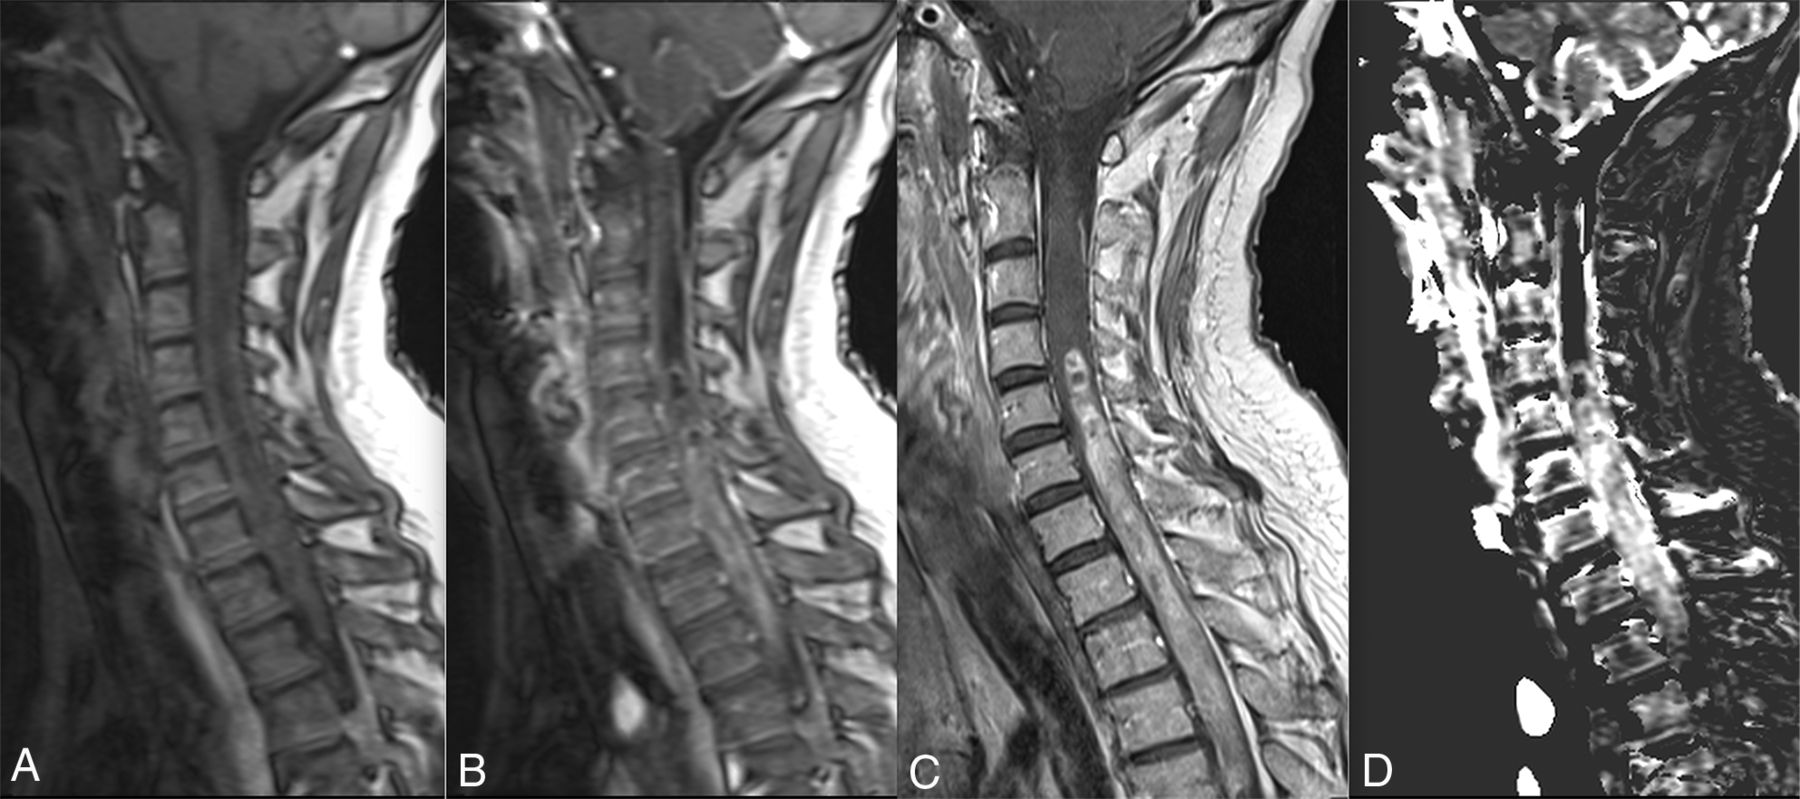
Spinal cord glioblastoma. Baseline (A) and timeframe after enhancement (B) of DCE perfusion show a spinal cord mass at the cervicothoracic junction. C, Gadolinium-enhanced sagittal T1 spin-echo image shows a contrast-enhanced mass with necrotic/cystic areas. D, Vp map based on the Tofts extended pharmacokinetic modeling shows increased plasmatic volume, suggesting increased neoangiogenesis.
Discussion
In this study, we report our preliminary results of DCE perfusion MR imaging for intradural spinal lesions at 1.5T and 3T. Previous reports3,4 have used DSC MR perfusion only at the cervical level; its implementation at the dorsal level is difficult because of the susceptibility artifacts of the lungs and the relatively low spatial resolution compared with the size of the spinal cord. We have used DCE perfusion at any level of the spinal canal, with clearly visible contrast enhancement of the lesions and without relevant motion artifacts at both 1.5 and 3T.
The higher SNR and CNR found in our study at 3T compared with 1.5T, in the context of similar mean relative signal enhancement increase of the explored lesions at both magnetic fields, are coherent with the well-known accepted superiority of 3T already reported by previous studies.5 This signal increase could be used to decrease section thickness, increase in-plane resolution, or decrease acquisition time.
The AUC is a model-free parameter that describes the uptake of gadolinium in the tissue of interest, and it has been shown to depend on the blood flow, vessel permeability, and interstitial space.6 AUC has the advantages of not requiring a vascular input function and not depending on complex pharmacokinetic modeling.
Pharmacokinetic modeling is needed to obtain parameters better describing the microvascular environment of the lesions (ie, capillary permeability, plasma volume, extravascular extracellular space, and so forth).7 This modeling is challenging because it depends on good quality of the sequence (high spatial and temporal resolution), few movement artifacts, and good vascular input function. We did not encounter any relevant movement artifacts. The movement-correction algorithm of the software compensated for some slight movement; the best vascular input function was selected automatically by the software for all patients as the earliest and highest enhancement in the examined area. In our study, the goodness of fit was similar between 1.5T and 3T for both models. χ2 was similar for most lesions (between 100 and 450), except for hemangioblastomas (between 450 and 13,000). Hemangioblastomas have an abundant expression of vascular endothelial growth factor, responsible for increased vascularization and permeability.8 A higher temporal resolution could be necessary to properly analyze the microcirculation of such hypervascular lesions.
The limits of our preliminary study are the following: First, the relatively low number of patients implies that any differentiation among various lesions based on DCE parameters should be confirmed in larger studies. Second, the differences in 3T versus 1.5T could partly be related to the heterogeneous nature of the lesions, their location, and the inherent differences of the MR imaging protocols, bores, and coils; further studies are necessary to establish whether this technical superiority of 3T compared with 1.5T results in superior clinical results. Third, the DCE protocol increases the total acquisition time of the MR imaging examination by about 8 minutes; therefore, the diagnostic utility of these new sequences should be better established. Nonetheless, we are confident that DCE perfusion could become a valuable adjunct in a spinal cord MR imaging protocol due to the paucity of advanced MR images available at this level and the potential richness of the information obtained on DCE perfusion.
Conclusions
DCE perfusion for intradural spinal canal lesions is feasible at 1.5T and 3T, with a better quality at 3T. In our opinion, DCE has the potential to become a valuable tool for the advanced imaging of the spinal cord and could be confirmed by further studies.
Footnotes
Paper previously presented at: European Congress of Neuroradiology, September 28 to October 1, 2013; Frankfurt, Germany.
References
- 1.
- 2.
- 3.
- 4.
- 5.
- 6.
- 7.
- 8.
- Received June 8, 2016.
- Accepted after revision August 3, 2016.
- © 2017 by American Journal of Neuroradiology