Abstract
BACKGROUND AND PURPOSE: Image-based classification of lower-grade glioma molecular subtypes has substantial prognostic value. Diffusion tensor imaging has shown promise in lower-grade glioma subtyping but currently requires lengthy, nonstandard acquisitions. Our goal was to investigate lower-grade glioma classification using a machine learning technique that estimates fractional anisotropy from accelerated diffusion MR imaging scans containing only 3 diffusion-encoding directions.
MATERIALS AND METHODS: Patients with lower-grade gliomas (n = 41) (World Health Organization grades II and III) with known isocitrate dehydrogenase (IDH) mutation and 1p/19q codeletion status were imaged preoperatively with DTI. Whole-tumor volumes were autodelineated using conventional anatomic MR imaging sequences. In addition to conventional ADC and fractional anisotropy reconstructions, fractional anisotropy estimates were computed from 3-direction DTI subsets using DiffNet, a neural network that directly computes fractional anisotropy from raw DTI data. Differences in whole-tumor ADC, fractional anisotropy, and estimated fractional anisotropy were assessed between IDH-wild-type and IDH-mutant lower-grade gliomas with and without 1p/19q codeletion. Multivariate classification models were developed using whole-tumor histogram and texture features from ADC, ADC + fractional anisotropy, and ADC + estimated fractional anisotropy to identify the added value provided by fractional anisotropy and estimated fractional anisotropy.
RESULTS: ADC (P = .008), fractional anisotropy (P < .001), and estimated fractional anisotropy (P < .001) significantly differed between IDH-wild-type and IDH-mutant lower-grade gliomas. ADC (P < .001) significantly differed between IDH-mutant gliomas with and without codeletion. ADC-only multivariate classification predicted IDH mutation status with an area under the curve of 0.81 and codeletion status with an area under the curve of 0.83. Performance improved to area under the curve = 0.90/0.94 for the ADC + fractional anisotropy classification and to area under the curve = 0.89/0.89 for the ADC + estimated fractional anisotropy classification.
CONCLUSIONS: Fractional anisotropy estimates made from accelerated 3-direction DTI scans add value in classifying lower-grade glioma molecular status.
ABBREVIATIONS:
- AUC
- area under the curve
- Codel
- codeletion
- dFA
- fractional anisotropy estimates
- FA
- fractional anisotropy
- LGG
- lower-grade glioma
- MUT
- mutated
- Noncodel
- noncodeleted
- WT
- wild-type
- IDH
- isocitrate dehydrogenase
The classification of diffuse lower-grade gliomas (LGGs) into molecular subtypes as designated by the World Health Organization in 2016 has important prognostic implications. Median survival in LGG is >6 years in the presence of an isocitrate dehydrogenase (IDH) gene mutation (IDHMUT) but reduces to <2 years in the absence of such a mutation (IDH wild-type [IDHWT]).1 Among IDHMUT LGGs, the presence of 1p/19q chromosomal codeletion (IDHMUT-Codel) predicts sensitivity to chemoradiation therapy and further improves overall survival compared with 1p/19q noncodeleted LGGs (IDHMUT-Noncodel).1,2 Moreover, the impact of surgery appears to differ among the molecular subtypes.3,4 Therefore, noninvasive, presurgical imaging biomarkers that can reliably predict genomic subtypes are of strong clinical interest.
Diffusion-weighted imaging and diffusion tensor imaging are quantitative MR imaging techniques that probe microstructural tissue characteristics by observing the rate and directionality of restricted water diffusion. Both DWI and DTI have demonstrated sensitivity to IDH-mutation and 1p/19q codeletion status in LGGs via differences in the ADC and/or fractional anisotropy (FA),5⇓⇓–8 which have been attributed to differences in cellularity and tumor proliferation rates among subtypes.9 While FA has been shown to provide additional value beyond ADC in LGG subtyping, it currently requires the addition of a DTI scan, which is a more specialized imaging technique than DWI and is not part of most routine clinical protocols. Furthermore, because DTI requires acquisitions with diffusion encoding along many directions (at least 6, typically ≥20), its acquisition time is substantially longer than conventional DWI, which only requires diffusion encoding along 3 orthogonal directions. Although MR imaging acceleration techniques such as simultaneous multislice imaging and compressed sensing can greatly accelerate DTI acquisitions,10,11 most clinical diffusion MR imaging scans are still DWIs.
A recently developed DTI reconstruction method called DiffNet (https://github.com/ealiotta/diffnet) uses machine learning to estimate FA from accelerated scans with as few as 3 diffusion-encoding directions.12 This means that, in principle with DiffNet, the discriminatory power provided by DTI can be extracted from standard DWI scans. While DiffNet has been shown to provide accurate FA map estimates, it remains to be seen whether these estimates add the same value as conventionally reconstructed FA maps from DTI in LGG molecular subtyping.
The purpose of this study was to determine whether FA values estimated using DiffNet from diffusion MR imaging scans with only 3 diffusion-encoding directions add discriminatory value beyond ADC in LGG molecular subtyping. We evaluated the LGG classification in patients who underwent preoperative DTI scans in addition to standard contrast-enhanced MR imaging brain protocols. Classifications were performed using bootstrapped multinomial linear regressions using whole-tumor histogram and texture features from ADC maps alone, ADC plus FA maps, and ADC-plus-DiffNet estimated FA (dFA) maps.
Materials and Methods
Patient Cohort
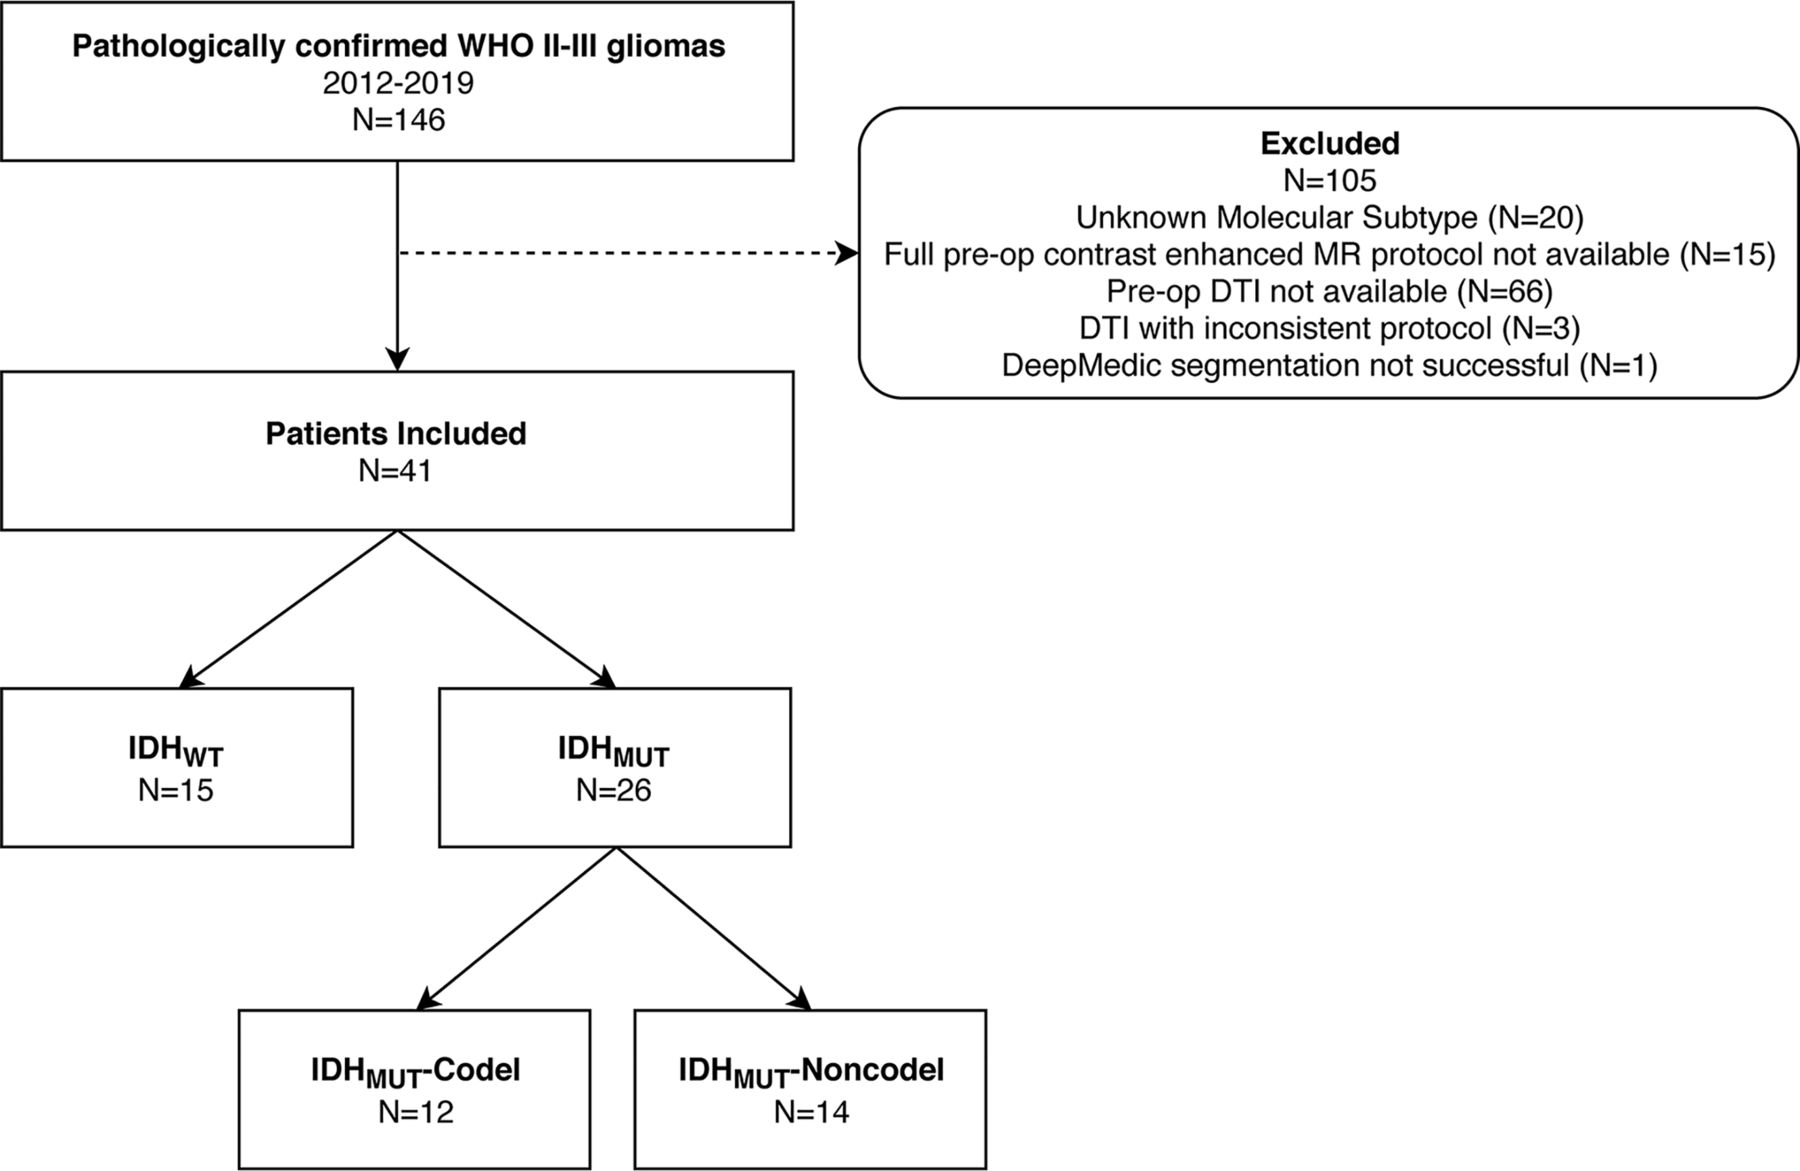
The local institutional review board approved this retrospective study and provided a waiver of the informed consent requirement. One hundred forty-six patients with pathologically confirmed World Health Organization grade II and III gliomas who were imaged at our institution between 2012 and 2019 were identified. Patients with an unknown molecular subtype (n = 20), without full preoperative contrast-enhanced MR imaging examinations (n = 15), and without preoperative DTI (n = 66) or with preoperative DTI with an inconsistent protocol (n = 3) were excluded. One additional patient was excluded from analysis due to an unsuccessful tumor autosegmentation (process described below), leaving a total of 41 patients (IDHWT= 15; IDHMUT-Codel = 12; IDHMUT-Noncodel = 14) who were included in our analysis. This group comprised 26 World Health Organization grade II and 15 World Health Organization grade III tumors and 24 male and 17 female patients with a mean age of 45.9 years (range, 18–76 years). A flow chart describing the study population is shown in Fig 1.

Patient population flow chart.
Neuropathology
IDH-mutation and 1p/19 codeletion status were tested for all patients in the molecular pathology laboratory at our institution. Formalin-fixed, paraffin-embedded tissue sections were processed routinely for histologic and immunohistochemical analysis. IDH mutation status was tested using immunohistochemistry, in which IDH1 R132H mutations were detected with H09 antibodies.13 In immunohistochemistry cases negative for IDH1 R132H mutations, IDH1/2 mutation status was assessed using DNA pyrosequencing as described previously.14 The 1p/19q codeletion status was determined using dual color fluorescence in situ hybridization15 (n = 38) or chromosomal microarray analysis using the OncoScan (Thermo Fisher Scientific, Waltham, Massachusetts) platform (n = 3).
Imaging Protocols
Patients were imaged on either 1.5T (n = 3) or 3T scanners (n = 38) with pre- and postcontrast T1-weighted scans (TE = 1.9–5.0 ms, TR = 9.5–2300 ms, in-plane resolution = 0.5–1.1 mm, slice thickness = 0.9–1.2 mm) as well as T2-weighted (TE = 82–413 ms, TR = 3200–9000 ms, in-plane resolution = 0.25–1.0 mm, slice thickness = 0.9–5.0 mm) and T2 FLAIR scans (TE = 80–388 ms, TR = 5000–10,000 ms, TI = 2800–2500 ms, in-plane resolution = 0.5–1.0 mm, slice thickness = 0.9–5.0 mm). The DTI protocol included 20 diffusion-encoding directions with b=1000 s/mm2 and 1 b=0 reference, 1.7- to 1.9-mm in-plane spatial resolution, 4.0- to 5.0-mm slice thickness with slice-interleaved single-shot EPI (TE = 6–104 ms and TR = 3300–4800 ms). DTI scans were repeated 2–4 times and averaged off-line to improve the SNR.
Tumor Segmentation
Conventional MR images (T1 pre- and postcontrast, T2, and T2-FLAIR) were coregistered to the reference frame of the T1 postcontrast images. Brain extraction was then performed using the Robust Brain Extraction algorithm (https://www.nitrc.org/projects/robex),16 followed by automatic tumor segmentation using DeepMedic (https://github.com/Kamnitsask/deepmedic)17 as implemented in the Brain Cancer Imaging Phenomics Toolkit (https://captk.projects.nitrc.org/).18 Following autosegmentation, tumor volumes were reviewed for obvious errors or segmentation failures, and clearly spurious regions were removed. The DeepMedic output included specific regions for edema, contrast-enhancing gross tumor, and nonenhancing tumor, but all regions were combined into single, whole-tumor ROIs. These ROIs were then registered onto the lower resolution DTI reference frame.
ADC and FA Reconstruction
ADC and FA values were reconstructed off-line from DTI using conventional linear-least-squares fitting and Eigensytem decomposition19 at each voxel using custom Matlab code (MathWorks, Natick, Massachusetts).
Subsets containing only 3 diffusion encoding directions were then extracted from the full DTI scans to replicate conventional DWI acquisitions and simulate a scenario in which DTI was not acquired. These directions were selected to maximize orthogonality and thus closely mimic a DWI acquisition. dFA maps were then computed from these undersampled scans by applying the DiffNet neural network at each voxel.12 DiffNet consists of a multilayer perceptron neural network design with 2 hidden layers and a total of 200 nodes and was previously trained to compute FA values from undersampled DTI signals at individual voxels. DiffNet can estimate FA without a full DTI dataset because it bypasses the intermediary tensor-model-fitting reconstruction step and directly infers FA from raw data. DiffNet was implemented in Python (python.org) and is available for download (github.com/ealiotta/diffnet).
ADC and FA Comparisons
Differences in ADC, FA, and dFA among LGG subgroups were assessed by computing mean whole-tumor values for each parameter and comparing distributions among subgroups using the Student t test. Statistical significance was assessed using the Bonferroni correction for multiple comparisons in which P values < 0.008 (.05/6) were considered statistically significant.
Histogram Feature Extraction
To assess the full distributions of each DTI parameter, we extracted several histogram features for ADC, FA, and dFA within whole-tumor ROIs. As described elsewhere,6 10th, 25th, 50th, 75th, 90th percentile values, skewness, and kurtosis were computed from ADC, FA, and dFA distributions.
Texture Feature Extraction
Texture analysis of the ADC, FA, and dFA maps was performed using gray level co-occurrence matrices as previously described in this context.6 For each map, homogeneity, correlation, energy, and contrast were computed within the whole-tumor ROIs using a Matlab-based radiomic toolbox (https://github.com/mvallieres/radiomics) developed by Vallières et al.20 Gray level co-occurrence parameters were computed within each ROI using equal-probability quantization at 8 quantization levels. The number of radiomic features was kept purposely small to avoid false-positive discoveries, given our cohort size.21
Multivariate Classification
In total, 12 features (mean, 7 histogram features, and 4 texture features) were compiled for each ADC, FA, and dFA map. To classify IDH-mutation and 1p/19q codeletion statuses using all available features, we developed multivariate logistic regression models using imbalance-adjusted bootstrap resampling.20,22 Imbalance-adjusted bootstrap resampling permits robust feature selection and generalizable multivariate modeling with a limited dataset by optimizing model parameters on bootstrapped training/testing data subsets while accounting for class imbalances within subsets at each bootstrap repetition.
First, the optimal feature sets were selected from the available histogram and texture features by optimizing classification performance across 50 bootstrapped samples with models containing between 1 and 10 features. With each repetition, patients were randomly divided into training and testing groups with a 60%/40% split, and class imbalances in each group (ie, a differing number of IDHMUT versus IDHWT or IDHMUT-Codel versus IDHMUT-Noncodel cases) were corrected by repeating instances from the underrepresented class. Regression models were then generated at each iteration using all combinations of available features to optimize prediction accuracy on the training group. The optimal model order (ie, number of features) was then selected by choosing the simplest model (ie, lowest number of features) for which classification area under the curve (AUC) in the testing group reached a maximum or plateau.
This procedure was repeated using ADC, ADC + FA, and ADC + dFA features for both IDH-mutation and 1p/19q codeletion classifications, generating an optimized feature set for each case. Once optimal feature sets were determined for each classification scheme, a final prediction model was generated by computing model coefficients using imbalance-adjusted bootstrap resampling with 1000 repetitions and taking the average regression coefficients across repetitions. This process ensured that the classification model was not overfitting to any specific subset of patients used for training. Model performance was then quantified in terms of AUC, sensitivity, and specificity in the testing group with each bootstrap repetition, generating a distribution of each parameter for each model. Model performance was evaluated according to the mean and standard error of each metric across repetitions.
Results
Quantitative Subgroup Differences
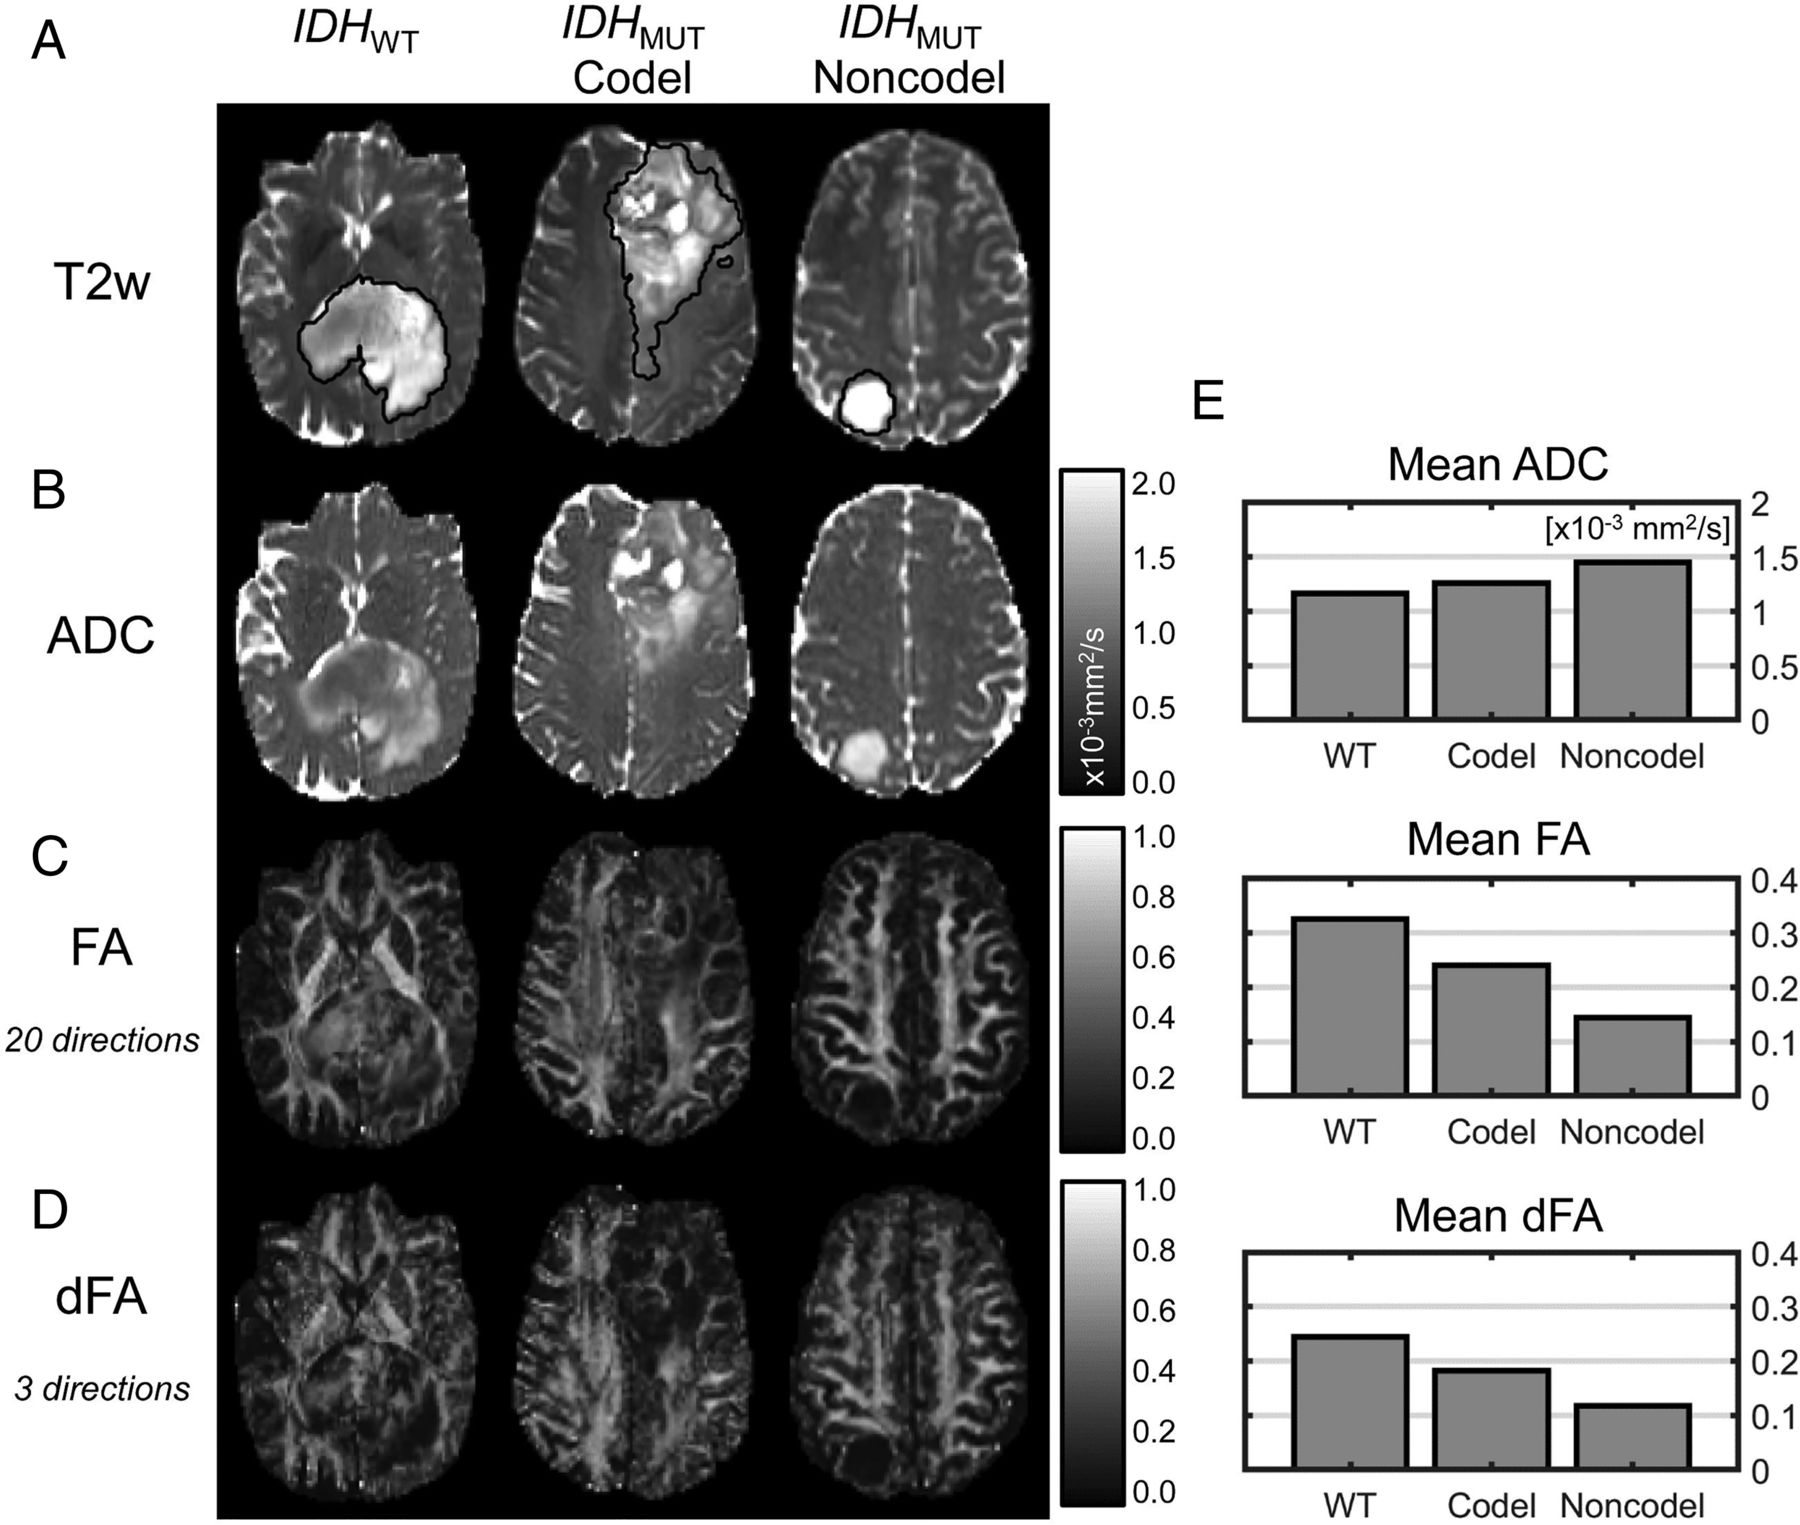
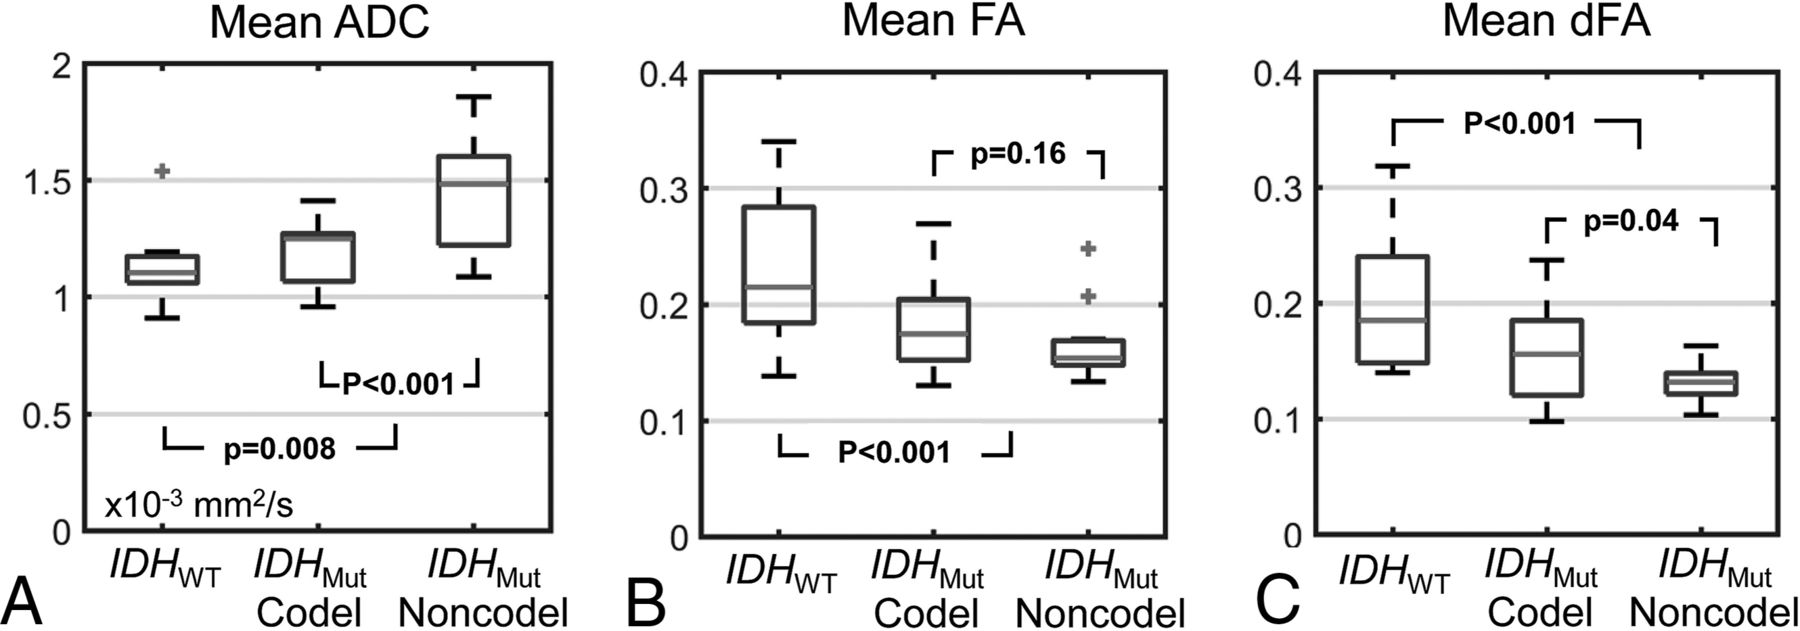
Sample ADC, FA, and dFA maps from each LGG subtype are shown in Fig 2, and mean values across patients within each LGG subtype are shown in Fig 3. For IDHWT versus IDHMUT, significant differences were observed in ADC (1.18 ± 0.16 versus 1.36 ± 0.24 × 10⁻³mm2/s, P = .008), FA (0.22 ± 0.05 versus 0.17 ± 0.04, P < .001), and dFA (0.19 ± 0.05 versus 0.14 ± 0.03, P < .001). For IDHMUT-Codel versus IDHMUT-Noncodel, a significant difference in ADC was observed (1.20 ± 0.14 versus 1.48 ± 0.23 × 10⁻³mm2/s, P < .001). Insignificant differences were observed in FA and dFA between IDHMUT-Codel and IDHMUT-Noncodel, though both were slightly higher in the IDHMUT-Codel group (FA: 0.18 ± 0.04 versus 0.16 ± 0.03, P = .16; dFA: 0.16 ± 0.04 versus 0.13 ± 0.01, P = .04). Comparisons among all other histogram and texture features are shown in On-line Tables 1 and 2.

Sample T2-weighted images with tumor segmentations (A), ADC maps (B), FA maps (C), and dFA maps (D) from each LGG molecular subtype as well as mean ADC, FA, and dFA values (E) from these individual cases.

Boxplots showing mean ADC (A), FA (B), and dFA (C) values across LGG subtypes. Central lines indicate median values, box edges indicate 25th and 75th percentiles, and whiskers extend to the full data range, excluding outliers (which are indicated by plus signs). P values < 0.008 indicate statistically significant differences to account for multiple comparisons.
Classification Feature Selection
Optimal feature combinations determined in the imbalance-adjusted bootstrap resampling feature selection process are listed in the Table.
Features selected in the imbalance-adjusted bootstrap resampling process for each classification schemea
Following feature selection, the ADC-only IDH-mutation status classification included only 1 histogram feature (75th percentile ADC); the ADC + FA model contained 3 histogram features (2 ADC features and 1 FA feature) and 3 texture features (1 ADC feature and 2 FA features); and the ADC + dFA model included 2 histogram features and 2 texture features (1 ADC and 1 FA feature each).
For 1p/19q codeletion status classification, the ADC-only model used 1 histogram feature (50th percentile ADC), the ADC + FA model used 5 histogram features (3 ADC features and 2 FA features), and the ADC + dFA model used 4 histogram features (2 ADC features and 2 dFA features).
Classification Performance
For IDH mutation status classification, the ADC-only model achieved AUC = 0.81 ± 0.03, sensitivity = 0.84 ± 0.06, and specificity = 0.67 ± 0.05. The ADC + FA model achieved AUC = 0.90 ± 0.03, sensitivity = 0.80 ± 0.07, and specificity = 0.80 ± 0.04. The ADC + dFA model achieved AUC = 0.89 ± 0.03, sensitivity = 0.83 ± 0.06, and specificity = 0.77 ± 0.04.
For codeletion status classification, the ADC only model achieved AUC = 0.83 ± 0.03, sensitivity = 0.81 ± 0.06, and specificity = 0.73 ± 0.04. The ADC + FA model achieved AUC = 0.94 ± 0.02, sensitivity = 0.83 ± 0.05, and specificity = 0.84 ± 0.05. The ADC + dFA model achieved AUC = 0.89 ± 0.03, sensitivity = 0.76 ± 0.07, and specificity = 0.79 ± 0.05.
Discussion
FA estimates obtained from 3-direction diffusion MR imaging scans using DiffNet added discriminatory value in classifying LGGs according to both IDH-mutation and 1p/19q codeletion statuses in addition to ADC maps alone. Although conventional FA values reconstructed from full DTI data provided marginally better classification performance than dFA, both parameters added to the performance of the ADC-only classification. This feature indicates that DiffNet can aid in LGG classification when only DWI is performed. Because DWI scans are included in most standard MR imaging brain protocols, clinical value can be added in many scenarios without the need for additional DTI scans. It should be noted, however, that DTI is often performed to aid in surgical planning and thus is available in many cases.
Several of our findings regarding conventional DTI analysis for LGG classification are consistent with prior work. For example, prior studies have reported lower ADC5,8,23⇓–25 and higher FA6,7 values in IDHWT LGG compared with IDHMUT gliomas. Others have also reported significantly higher ADC7,26 and slightly, but nonsignificantly, lower FA values7 in IDHMUT-Noncodel versus IDHMUT-Codel tumors.
Other imaging features have previously been used to classify gliomas into molecular subtypes. These include conventional imaging characteristics based on tumor location,27,28 contrast enhancement,27,28 margins,29,30 T2-FLAIR mismatch,31,32 and calcification.33 Advanced techniques including perfusion MR imaging,5,23,34,35 MR imaging spectroscopy,28,36,37 and radiomic texture analysis22 have also demonstrated discriminatory value. These features can potentially be combined with FA and ADC to further improve classification performance. Additional improvements may also be achievable through more sophisticated classification schemes than the logistic regressions used in this work, such as support-vector machines or random forests.
ADC energy had positive regression coefficients in the IDH-mutation classification, which indicates that uniform ADC values within the tumor are associated with IDHWT. On the other hand, FA homogeneity and dFA energy (both of which indicate parameter uniformity within the tumor) had negative regression coefficients indicating negative associations with IDHWT. These results further indicate that FA and dFA provide complementary information to ADC for LGG classification and agree with prior study results showing higher ADC orderliness and a lack of locally correlated FA values in IDHWT tumors.6
Our finding that increased ADC skewness is associated with IDHMUT-Noncodel tumors is also consistent with prior work.6 However, these authors also found FA energy and correlation as a significant predictor of IDHMUT-Noncodel. Neither these nor any ADC, FA, or dFA texture features were selected in our final codeletion-status classification models.
Notably, our codeletion-status classification models included FA skewness and dFA skewness but in opposite directions (increased FA skewness was associated with IDHMUT-Codel while increased dFA skewness was associated with IDHMUT-Noncodel). This is a surprising finding but may be due to a known FA-dependent bias in dFA. It was shown previously that dFA has a negative bias that gets larger as FA values increase,12 which affects the shape of dFA distributions. This can alter distribution skewness and thus associated relationships with molecular subtypes.
This study has limitations that should be discussed. This is a retrospective, single-institution study with a relatively small sample size, and prospective validation on larger samples is necessary. We have made DiffNet publicly available in hopes of facilitating independent validation of our results at separate institutions. Furthermore, although there is no technical difference between a subsampled DTI dataset containing only 3 diffusion-encoding directions and a conventional DWI scan, prospective analysis including only true DWI data is warranted.
Conclusions
DiffNet neural network–derived FA estimates based on 3-direction DTI scans improve IDH-mutation and 1p/19q codeletion classification in LGGs compared with ADC values alone. The application of the DiffNet neural network to conventional DWI data may improve the prediction of LGG molecular subtypes.
Footnotes
Disclosures: Sohil H. Patel—RELATED: Grant: Radiological Society of North America Research Scholar Grant*; UNRELATED: Other: I provided written expert opinion in a malpractice lawsuit.* *Money paid to the institution.
Sohil H. Patel was supported by a Radiological Society of North America Research Scholar Grant (RSCH1819).
REFERENCES
- 1.
- 2.
- 3.
- 4.
- 5.
- 6.
- 7.
- 8.
- 9.
- 10.
- 11.
- 12.
- 13.
- 14.
- 15.
- 16.
- 17.
- 18.
- 19.
- 20.
- 21.
- 22.
- 23.
- 24.
- 25.
- 26.
- 27.
- 28.
- 29.
- 30.
- 31.
- 32.
- 33.
- 34.
- 35.
- 36.
- 37.
- Received April 16, 2019.
- Accepted after revision July 1, 2019.
- © 2019 by American Journal of Neuroradiology