Abstract
BACKGROUND AND PURPOSE: The presence of IPH is considered the most dangerous feature because it is significantly associated with clinical ipsilateral cerebrovascular events. Our aim was to explore the characterization of plaque with CT in symptomatic subjects with bilateral intraplaque hemorrhage.
MATERIALS AND METHODS: Three-hundred-forty-three consecutive patients with recent anterior circulation ischemic events (<2 weeks) and CT of the carotid arteries (performed within 14 days of the cerebrovascular event) evaluated between June 2012 and September 2017 were analyzed for plaque volume composition to identify all subjects with bilateral intraplaque hemorrhage. Plaque volume was semiautomatically measured, and tissue components were classified according to the attenuation values such as the following: calcified (for values of ≥130 HU), mixed (for values of ≥60 and <130 HU), lipid (for values of ≥25 and <60 HU), and intraplaque hemorrhage (for values of <25 HU). Twenty-one subjects (15 men; mean age, 70 ± 11 years; range, 44–87 years) had bilateral intraplaque hemorrhage and were included in the analysis.
RESULTS: Volume measurement revealed significantly larger plaques on the symptomatic side compared with the asymptomatic one (mean, 28 ± 9 versus 22 ± 8 mm, P = .007). Intraplaque hemorrhage volume and percentage were also significantly higher in the plaque ipsilateral to the cerebrovascular event (P < .001 and < .001, respectively). The volume of other plaque components did not show a statically significant association except for lipid and lipid + intraplaque hemorrhage percentages (23% versus 18% and 11% versus 15%), which were significantly different between the symptomatic and the asymptomatic sides (.016 and .011, respectively). The intraplaque hemorrhage/lipid ratio was higher on the symptomatic side (0.596 versus 0.171, P = .001).
CONCLUSIONS: In patients with bilateral intraplaque hemorrhage and recent ischemic symptoms, the plaque ipsilateral to the symptomatic side has significantly larger volume and a higher percentage of intraplaque hemorrhage compared with the contralateral, asymptomatic side.
ABBREVIATIONS:
- IPH
- intraplaque hemorrhage
- ROC
- receiver operating characteristic
Recent studies of cervical carotid stenosis have shown that the degree of stenosis alone should not be considered the most important parameter to predict the risk of plaque rupture; instead, plaque composition should also be considered in making therapeutic decisions.1,2
Plaque features associated with an increased risk of plaque rupture include the following: intraplaque hemorrhage (IPH), thin or ruptured fibrous cap, the presence and size of the lipid-rich necrotic core, and active plaque inflammation.2⇓⇓–5 The presence of IPH is considered the most dangerous feature because it is significantly associated with clinical ipsilateral cerebrovascular events.6,7 Most interesting, only a portion of patients with IPH develop clinical cerebrovascular events. Therefore, it is possible that a plaque with IPH associated with ischemic events could have different characteristics compared with a plaque with IPH but no ischemic correlates.8 Indeed, a recent study showed that in patients with recent symptoms and bilateral IPH evaluated with MR imaging, the symptomatic side had stronger T1-weighted signals, larger necrotic cores, and longer plaques than the asymptomatic side.9
MR imaging is currently considered the criterion standard for visualization of IPH.10 However, recent investigations have suggested that CT can be useful for the detection and quantification of IPH as well.11,12 Unlike MR imaging, CT is routinely used in the urgent/emergent evaluation of patients with acute ischemic events, is widely available 24/7, and is more convenient for patients, especially the elderly with acute cerebrovascular syndromes. In this study, we explored plaque characterization in symptomatic subjects with bilateral IPH using CT, and we also aimed to identify plaque composition differences between symptomatic and asymptomatic carotid arteries.
Materials and Methods
Study Design and Patient Population
The institutional review board (Azienda Ospedaliero Universitaria di Cagliari) approved this study, and patient consent was waived because of the retrospective nature. Every patient with recent cerebrovascular ischemic events and concomitant CT of the carotid arteries (acquired within 14 days after the cerebrovascular event) was included in this retrospective study. Inclusion criteria were the following:
1. Older than 18 years of age.
2. Anterior circulation cerebrovascular ischemic events (ischemic stroke, transient ischemic attack, or amaurosis fugax) within the past 2 weeks before the CT of the carotid arteries. To avoid inclusion of subjects with cerebrovascular symptoms due to noncarotid atherosclerotic disease, we classified patients according to the neurologic assessment using the Trial of ORG 10172 in Acute Stroke Treatment (TOAST) criteria.13 Individuals with other potential causes of cerebrovascular events such as silent or paroxysmal atrial fibrillation, valvular heart disease, and ventricular endocardial thrombi were excluded.
3. The presence of bilateral carotid plaque (focal thickness of ≥1.5 mm in the right and left carotid arteries).
By applying these criteria, we screened a total of 343 subjects (289 men, 54 women; mean age, 72 years; age range, 39–86 years) investigated between June 2012 and September 2017 for bilateral IPH. Patient demographics and clinical characteristics were collected by the treating physicians. The degree of stenosis was quantified according the NASCET criteria.14
Of the 343 subjects included, 12 (3.49%) had poor image quality. Twenty-one of the 331 remaining patients (6.34%) were identified as having bilateral carotid IPH and were the subject of the present study (Fig 1). Plaque was defined according to the Mannheim consensus15 as a carotid wall thickness of >1500 μm.

Flow chart.
CTA Technique
In all patients, CT of the carotid arteries was performed with a 16–detector row CT system (Brilliance; Philips Healthcare, Best, the Netherlands) according to a standardized protocol. The coverage was from the aortic arch to the carotid siphon with a caudocranial direction, and examinations were performed before and after administration of contrast material. An angiographic phase was obtained with the administration of 60–80 mL of prewarmed contrast medium (iopromide, Ultravist 370; Bayer HealthCare, Berlin, Germany) injected at a flow rate of 4 mL/s. CT technical parameters included the following: slice thickness, 0.6 mm; interval, 0.3 mm; matrix size, 512 × 512; FOV, 14–19 cm. The C-filter algorithm of reconstruction was applied.
IPH and Plaque Analysis Quantification
The volume analysis16,17 was performed by 2 experienced radiologists (L.S. and P.L. with 11 and 8 years of experience, respectively, in CT of the supra-aortic vessels) unaware of the patient's symptomatic side, using as window/level settings W = 850 and L = 300,18 with a dedicated software (VascuCAP; Elucid Bioimaging, Wenham, Massachusetts) to semiautomatically quantify the volume of the subcomponents.19 The inner and outer boundaries of the plaque were automatically identified by the software, but each volume was checked manually by the radiologists to avoid mistakes in the segmentations. Special care was used to exclude the presence of thrombus attached to the carotid artery plaque, which was defined according to Eesa et al20 as “an eccentric pedunculated filling defect projecting into the lumen of the vessel.” For the plaque component analysis, the postcontrast scans were considered.
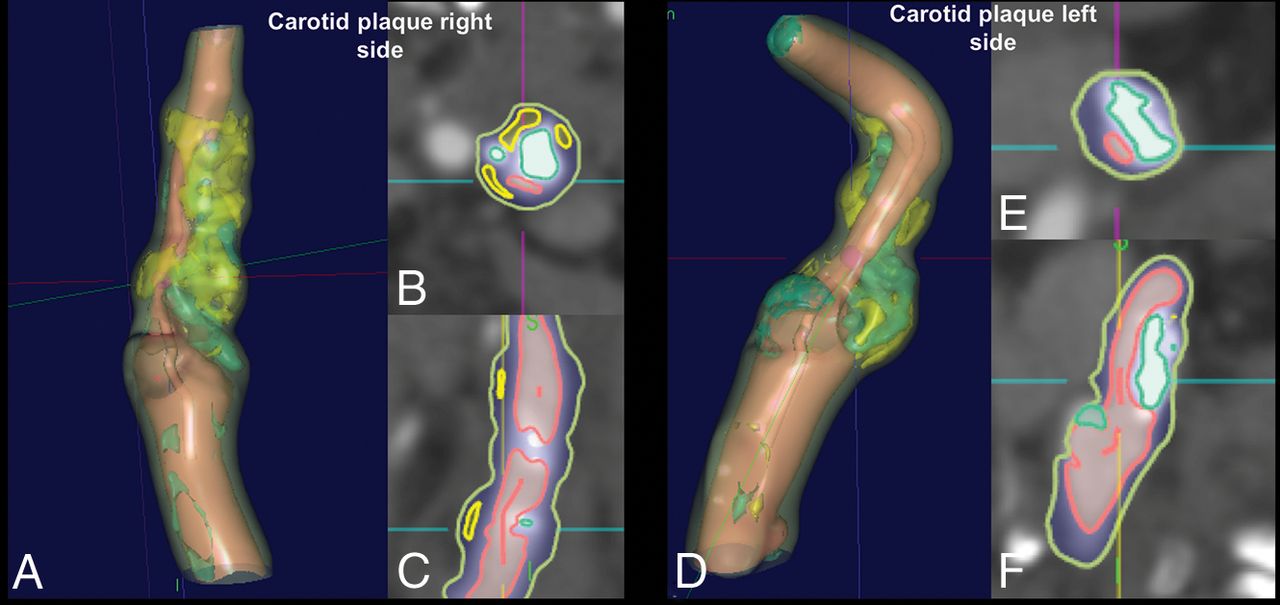
Attenuation values of all voxels within a plaque were measured, and Hounsfield units of each voxel were assumed to represent specific tissue using the thresholds defined by Saba et al11 as calcified (for values of ≥130 HU), mixed (for values of ≥60 and <130 HU), lipid (for values of ≥25 and <60 HU), and IPH (for values of <25 HU) (Fig 2).11,17 We also considered a fifth class (attenuation of <60 HU) by considering the fatty component. The percentages of all components were calculated as well as the ratio between IPH/fatty class (with values between 0, if no IPH was present, and 1 if the entire fatty plaque component was due to IPH).

Example of semiautomatic segmentation of the carotid artery plaque of a 63-year-old subject. Both right (A–C) and left (D–F) carotid arteries are shown, and the red lines in the axial (B and D) and coronal planes (C and F) show the IPH components.
The identification of IPH was the key point of the analysis and was based on the attenuation values of each voxel into the carotid plaque.
As explained previously, a semiautomated software was used to identify the tissue components, and the inclusion criteria for the study necessitated the presence of IPH on both sides (therefore, voxels of <25 HU of attenuation). Therefore, to avoid a bias related to the presence of a minimal amount of voxels of < 25 HU (such as the presence of a single voxel with a value < 25 HU), which can be due to simple statistical variability of the tissues, we considered that at least 1% of the voxels of the plaque, should have an attenuation of < 25 HU to serve as a cutoff for the presence of IPH within the plaque.
Bland-Altman plot analysis was performed to calculate the interobserver agreement in the IPH, fatty, lipid, mixed, and calcified volume calculations.
Statistical Analysis
The normality of each continuous variable group was tested using the Kolmogorov-Smirnov Z-test. Continuous data were described as mean ± SD, and binary variables were summarized as count (percentage). All subjects had bilateral carotid IPH and unilateral ischemic symptoms, so plaques were grouped by whether they were ipsilateral or contralateral to the ischemic symptoms. Because the normality assumption was rejected, differences between ipsilateral and contralateral IPH + plaques were assessed with the Wilcoxon test for continuous variables. The Pearson ρ correlation analysis was performed to assess the correlation between the degree of stenosis and the plaque volume in symptomatic and asymptomatic IPH. Comparison of the receiver operating characteristic (ROC) area under the curve was performed to test the strength and difference between parameters of IPH ipsilateral and contralateral to the symptoms. A P value < .05 indicated statistical significance, and all correlation values were calculated using a 2-tailed significance level. R statistical and computing software (www.r-project.org) was used for statistical analyses.
Results
General Results
Of the 343 patients screened, 21 subjects had bilateral IPH and were included in the analysis. Clinical characteristics of these patients are summarized in Table 1.
Clinical characteristics of the 21 subjects with bilateral IPH
The mean time interval between CT and the cerebrovascular event was 4 days (range, 1–12 days). Two of the 21 patients included in this study were also included in a previous publication on a different topic.11
Plaque Morphology
The plaque was significantly longer on the symptomatic side compared with the asymptomatic one (28 ± 9 versus 22 ± 8 mm, P = .007). There were no statistically significant differences in the maximum wall thickness (5.6 ± 2.1 versus 5.3 ± 1.9 mm, P = .093).
Wilcoxon Analysis
The analysis of IPH as well as plaque characteristics ipsilateral and contralateral to the ischemic events is summarized in Table 2. There was a statistically significant difference in IPH volume and IPH percentage between the 2 sides (P values < .001 and < .001, respectively). The volume of other components and percentages did not show a statistically significant difference, except for the lipid and fatty component percentages, which were significantly different between the symptomatic and the asymptomatic sides (respectively, greater in asymptomatic than in symptomatic subjects with P values of .016 and .011) (Fig 3). Finally, the IPH/fatty ratio also showed a statistically significant difference between the symptomatic and asymptomatic sides (0.596 versus 0.171, P value = .001). Wilcoxon analysis also showed that the degree of stenosis in the symptomatic plaque was not (P = 728) higher (49%; interquartile range, 38%–65%) than the contralateral, asymptomatic plaque (47%; interquartile range, 37%–59%).
Wilcoxon analysisa

Boxplot analysis of the volume of the plaque components (A) and percentages (B) for symptomatic (blue plots) and asymptomatic (red plots) sides.
Pearson ρ Correlation Analysis
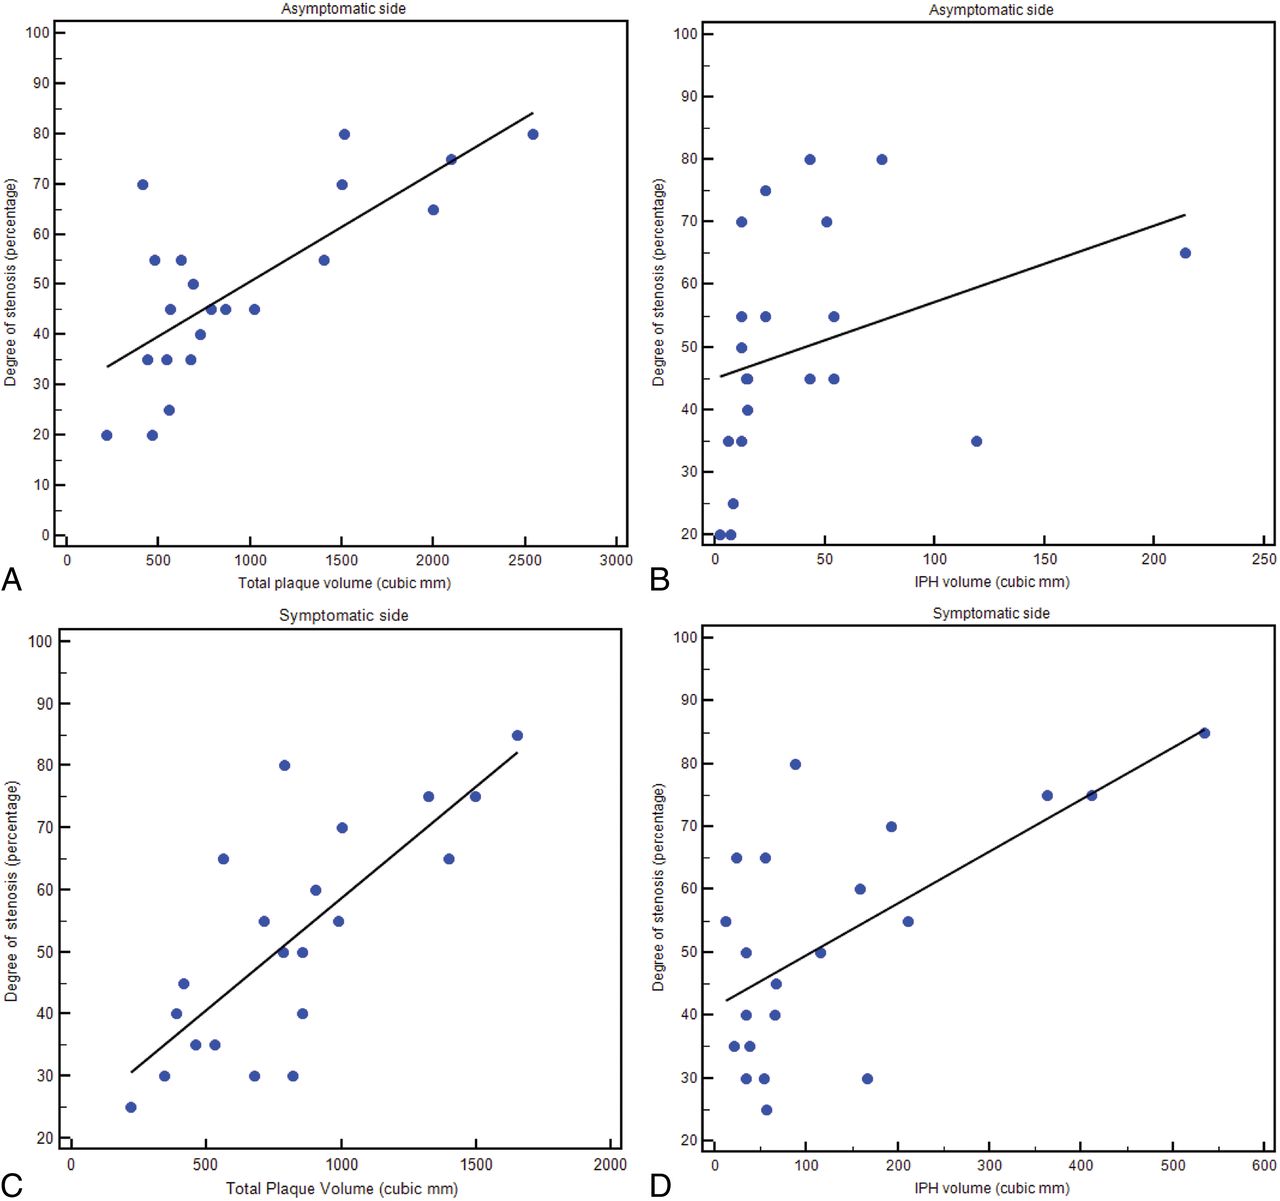
The Pearson ρ correlation analysis showed that for both symptomatic and asymptomatic IPH plaques, there was a strong correlation between the degree of stenosis and plaque volume (ρ value = 0.77, P value = .001; and ρ value = 0.76, P value = .001, respectively). However, by analyzing the relationship between the degree of stenosis and IPH volume in asymptomatic plaque, we found no correlation (ρ value = 0.326, P value = .1487), whereas a strong correlation was found in symptomatic subjects between IPH volume and the degree of stenosis (ρ value = 0.642, P value = .002) (Fig 4).

Regression analysis diagrams between total plaque and IPH volume on asymptomatic sides (A and B, respectively) and between total plaque and IPH volume on symptomatic sides (C and D, respectively).
ROC Curve Analysis
For each parameter (subcomponent volume and percentage), the ROC curve versus the presence of symptoms was calculated to test their impact. ROC curves are given in Fig 5. In Table 3 the area under the curve (AUC), standard error, SD, and P values are summarized.

ROC curve analysis of the volume of the plaque components (A) and percentages (B) versus the presence of symptoms.
ROC curve analysis
Interobserver Analysis
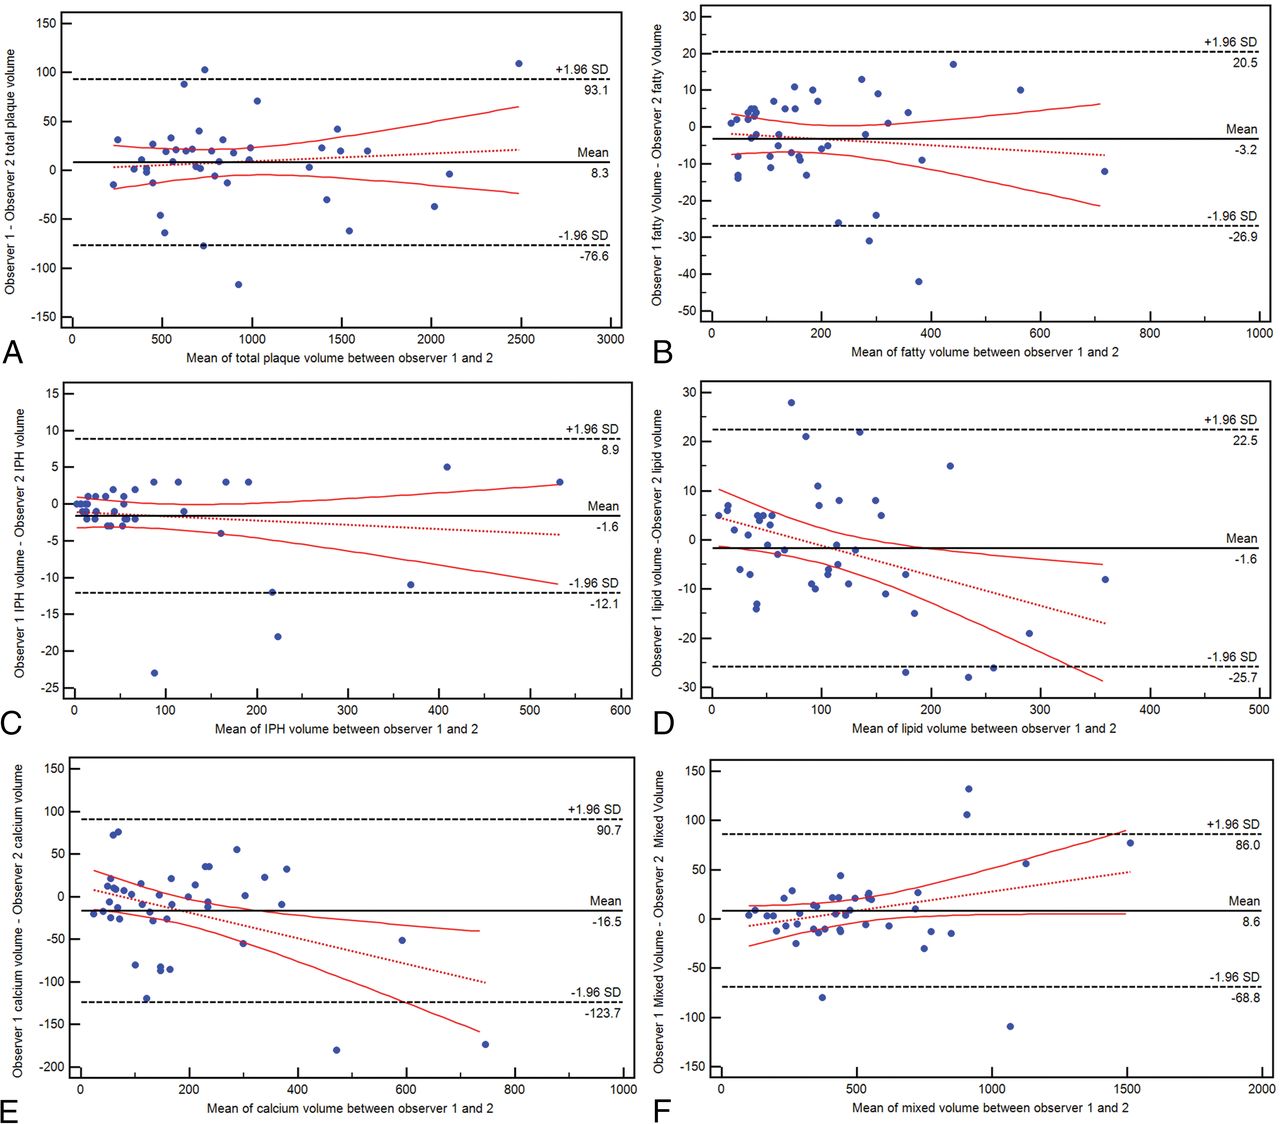
The Bland-Altman plot analysis is shown in Fig 6, and there are very good values of interobserver agreement for the total plaque volume (average difference, 8.3 mm3; 95% CI, −76.6–93.1 mm3) and subcomponents, in particular for the lipid (average difference, 1.6 mm3; 95% CI, −25.7–22.5 mm3) and IPH (average difference, 1.6 mm3; 95% CI, −12.1–8.9 mm3) values.

Bland-Altman plot analysis for the interobserver agreement in total volume (A) and fatty (B), IPH (C), lipid (D), calcified (E), and mixed (F) tissue.
Discussion
Previous studies have demonstrated that IPH is related to the occurrence of cerebrovascular events,6,7 yet not all plaques with IPH are associated with stroke/TIA.9,21,22 The occurrence and progression of IPH causes carotid plaque rupture in some cases, while in other subjects, there is an evolution of IPH to lipid core and inflammation without plaque rupture.23,24 Therefore, the mere presence of IPH alone does not explain plaque rupture and subsequent cerebrovascular events, but one can hypothesize that the specific IPH configuration and not its presence alone leads to plaque rupture.
In this study of patients with recent unilateral symptoms but bilateral IPH, we found that IPH volume and overall IPH percentage ipsilateral to the presenting cerebrovascular event are statistically higher than on the contralateral side. There was no difference between the 2 sides in the volume of other components. These results suggest that IPH occurs on the symptomatic side in larger amounts, and this feature could be the cumulative result of multiple hemorrhagic episodes. In this respect, previous studies using MR imaging have demonstrated that IPH can persist for years.25,26 Furthermore, it is also possible that after the acute/subacute phase, there is an evolution of the IPH toward the lipid-rich necrotic core because some authors have hypothesized that IPH could be a precursor of the lipid core.6
The lipid and fatty tissue percentages also showed a statistically significant difference between the symptomatic and asymptomatic sides. CT volumetric analysis of carotid plaque offers an important quantitative tool because of the possibility of computing the number of voxels with specific attenuation values and deriving tissue composition. The classification by de Weert et al17 showed that 60 HU is the optimal cutoff point to differentiate lipid from fibrous tissue. However, it is well-known that even though both lipid-rich necrotic core and IPH are associated with an increased occurrence of cerebrovascular events, the presence of IPH is much more important in increasing the risk of these events. Therefore, its identification on CT using a threshold of 25 HU11 represents an important step, and the results of our study suggest that the presence of symptoms is not so much related to the difference in the volume of lipid components but rather to the degree of IPH.
A useful parameter in the assessment of plaque vulnerability is not only the absolute volume of plaque components but their relative percentages. We found that if we consider percentages, a significant difference between symptomatic and asymptomatic plaque is seen not only for IPH but also for the lipid and fatty components. In particular, the percentage of the lipid component is significantly higher in asymptomatic plaques, whereas the fatty component is higher in symptomatic ones. These observations suggest that not only the total volume of plaque components but rather their unbalanced percentages could induce plaque vulnerability. Previous studies exploring the role of biomechanical properties of the atherosclerotic arterial plaque and their effect in plaque destabilization support this notion.27,28
In our study, the IPH/lipid ratio was also significantly different between symptomatic and asymptomatic sides (0.596 versus 0.171; P = .001). This observation could support the hypothesis that IPH can have a role in the formation and progression of the lipid-rich necrotic core.24 Of note, Wilcoxon analysis also showed that the symptomatic plaque was not (P = .728) associated with a higher degree of stenosis then the contralateral plaque (49% versus 47%); this finding further supports the emerging notion that plaque composition and not only degree of stenosis play a role in symptoms onset.
Pearson ρ correlation analysis showed that for both symptomatic and asymptomatic plaques with IPH, there is a strong correlation between the degree of stenosis and the total plaque volume (ρ value = 0.771, P value = .0001; and ρ value = .757, P value = .0001, respectively). However, by analyzing the relationship between the degree of stenosis and IPH volume in asymptomatic plaque, we found no correlation (ρ value = 0.326, P value = .1487), whereas a strong correlation was found in symptomatic subjects between IPH volume and the degree of stenosis (ρ value = 0.642, P value = .0017). This difference could be explained by a different carotid plaque remodelling occurring in the acute phase compared with the nonacute phase due to the fast spatial increase determined by the IPH: Sun et al25 showed that symptomatic advanced atherosclerotic carotid plaques have a higher tendency toward inward remodelling. Similarly, Takaya et al26 found that lesions with IPH at baseline had a greater increase in wall volume and a reduction in lumen volume compared with arteries without IPH.
For each parameter (subcomponent volume and percentage), the ROC curve versus the presence of symptoms was calculated to test its impact (Fig 5). The agreement (Fig 6) between observers was very good for the total plaque volume and subcomponents. In particular, almost similar values of volume were found for the IPH and lipid components, whereas some differences were present in the calcium volume, but this could be explained because the calcium volume is, as an average value, the largest component of the plaque.
Currently, among all available imaging techniques, MR imaging is considered the best technique for the detection of IPH because the appearance of IPH depends on the oxidative state of hemoglobin and is easily detected with common MR imaging.2,10,12 A recent investigation performed using MR imaging showed that in symptomatic patients with bilateral IPH, the symptomatic side had a stronger T1-weighted signal than the asymptomatic side.9 The effects determined by the volume of the carotid plaque and carotid plaque subcomponents remain to be explored because of the limited ability of MR imaging to adequately calculate the volume of these tissues. The use of CT for the detection and characterization of IPH is still debated because this technique shows nondefinitive results and only 3 studies with relatively few patients have been published with this technique.11,29,30 However, other studies suggest that by using CT, it is possible to analyze, with very good detail, the volume of different plaque components.19,31 The observation that plaque composition and IPH can be analyzed with CT has very important practical consequences in clinical practice. Unlike MR imaging, CT is routinely used in the urgent/emergent evaluation of patients with acute ischemic events, it is widely available 24/7, and is more convenient for patients, especially the elderly with acute cerebrovascular syndromes because in such cases, good quality MR images are challenging to obtain because of patient movement, discomfort, and lack of cooperation.
Our study has limitations. The cohort analyzed is relatively small (n = 21). However, the occurrence of bilateral plaques with IPH in a patient with unilateral symptoms is a relatively uncommon event. Nevertheless, it was important to analyze this specific population because the contralateral (to the symptoms) side functions as an internal control and the ability to analyze plaque differences in the same patients removes many of the variables associated with the use of other types of controls. To include only subjects with bilateral IPH, we introduced an arbitrary threshold to avoid inclusion of subjects with a minimal presence of Hounsfield voxels (eg, only 1 voxel) with a value of <25 HU (ie, a threshold of 1% minimum of the plaque should have <25-HU voxels to be accepted as plaque with IPH). We recognize that this may be arbitrary and may potentially introduce a bias because a small amount of IPH may have been a priori excluded. Moreover, it is possible that some patients with IPH could be excluded because of blooming artifacts due to a cluster of calcium within the plaque.
In this study, there was no histopathologic comparison. Therefore, when we consider IPH, lipid, fatty, mixed, and calcified tissues, the classification is only based on the attenuation values of the tissues. This could be a source of bias (common to any study using CT) because the same type of tissue, even if the same energy levels are applied (as in the current study), could have subtle differences in the Hounsfield attenuation due to body habitus (such as body mass index, size of the neck, and so forth); also in this case, this is a general limitation of CT when attenuation values are considered but which could affect, in some degree, the measurements and tissue classification. Another limit is that IPH (or a portion of the IPH) denser than 25 HU would be excluded from the analysis by determining a bias. In the study by Saba et al,11 it was demonstrated that in some cases, the IPH could have an attenuation of >25 HU. However, this would introduce only a minor bias because it has been demonstrated that most IPH shows values of <25 HU.
Conclusions
We have found that in symptomatic subjects with bilateral IPH on CT, the plaque ipsilateral to the symptomatic side has a significantly larger volume and a higher percentage of IPH compared with the contralateral side. In symptomatic plaques, the IPH component is increased compared with the lipid one. These observations have important practical ramifications in the acute evaluation of these patients.
Footnotes
Disclosures: Giuseppe Lanzino—UNRELATED: Board Membership: Superior Medical Editing; Other: Marblehead, Comments: shareholder, shares directly purchased. Chun Yuan—UNRELATED: Grants/Grants Pending: Philips Healthcare.* *Money paid to the institution.
REFERENCES
- 1.
- 2.
- 3.
- 4.
- 5.
- 6.
- 7.
- 8.
- 9.
- 10.
- 11.
- 12.
- 13.
- 14.
- 15.
- 16.
- 17.
- 18.
- 19.
- 20.
- 21.
- 22.
- 23.
- 24.
- 25.
- 26.
- 27.
- 28.
- 29.
- 30.
- 31.
- Received January 30, 2019.
- Accepted after revision June 28, 2019.
- © 2019 by American Journal of Neuroradiology