Abstract
BACKGROUND AND PURPOSE: The default mode network normally decreases in activity during externally directed tasks. Although default mode network connectivity is disrupted in numerous brain pathologies, default mode network deactivation has not been studied in patients with brain tumors. We investigated default mode network deactivation with language task–based fMRI by measuring the anticorrelation of a critical default mode network node, the posterior cingulate cortex, in patients with gliomas and controls; furthermore, we examined default mode network functional connectivity in these patients with task-based and resting-state fMRI.
MATERIALS AND METHODS: In 10 healthy controls and 30 patients with gliomas, the posterior cingulate cortex was identified on task-based fMRI and was used as an ROI to create connectivity maps from task-based and resting-state fMRI data. We compared the average correlation in each default mode network region between patients and controls for each correlation map and stratified patients by tumor location, hemisphere, and grade.
RESULTS: Patients with gliomas (P = .001) and, in particular, patients with tumors near the posterior default mode network (P < .001) showed less posterior cingulate cortex anticorrelation in task-based fMRI than controls. Patients with both left- and right-hemisphere tumors, as well as those with grade IV tumors, showed significantly lower posterior cingulate cortex anticorrelation than controls (P = .02, .03, and <.001, respectively). Functional connectivity in each default mode network region was not significantly different between task-based and resting-state maps.
CONCLUSIONS: Task-based fMRI showed impaired deactivation of the default mode network in patients with gliomas. The functional connectivity of the default mode network in both task-based and resting-state fMRI in patients with gliomas using the posterior cingulate cortex identified in task-based fMRI as an ROI for seed-based correlation analysis has strong overlap.
ABBREVIATIONS:
- BOLD
- blood oxygen level–dependent
- DMN
- default mode network
- FC
- functional connectivity
- IPL
- inferior parietal lobule
- LIPL
- left inferior parietal lobule
- mPFC
- medial prefrontal cortex
- PCC
- posterior cingulate cortex
- RIPL
- right inferior parietal lobule
- rs-fMRI
- resting-state fMRI
- tb-fMRI
- task-based fMRI
The default mode network (DMN) is a functionally connected brain network1,2 that demonstrates deactivation during tasks that require external attention relative to nontask conditions.3⇓-5 The functions of the DMN appear to be central in spontaneous cognition,6 stimulus-independent thoughts,7 and self-referential mental activity.8 DMN deactivation has been correlated with functions such as memory-encoding9 and goal-directed external task performance.10
The DMN has been studied extensively using blood oxygen level–dependent (BOLD) fMRI, both in healthy volunteers and in patients with a variety of neurologic and psychiatric conditions. Because DMN deactivation is known to be important for cognitive function,10 exploring the impact of brain tumors on DMN deactivation could help elucidate the underpinnings of accelerated cognitive decline in patients with brain tumors.11 Subclinical cognitive decline in middle-aged healthy men has been associated with decreased deactivation of the posterior DMN during a visual-motor task paradigm.12 Decreased DMN deactivation has also been demonstrated in patients with schizophrenia during a semantic and perceptual encoding task paradigm,13 in patients with Alzheimer disease during a face-name recognition paradigm,14 and in patients with stroke during a motor-task paradigm.15 However, task-induced deactivation of the DMN has not yet been studied with fMRI in patients with gliomas.
Functional connectivity (FC) refers to the degree of the correlation of simultaneous activity of disparate brain regions, either during a task or at rest, as measured by fMRI.16 Disruptions in the FC of the DMN have been associated with cognitive impairment in patients with focal lesions, including patients with stroke17 and brain tumors,18⇓-20 as well as in patients with autism,21 schizophrenia,22 and neurodegenerative diseases such as Alzheimer disease23 and Parkinson disease.24 However, while decreases in the FC of the DMN have been found in patients with brain tumors, the data are varied regarding the impact of tumor location, grade, and hemisphere.18⇓-20 Additionally, there are no data comparing the FC of the DMN using both task-based fMRI (tb-fMRI) and resting-state fMRI (rs-fMRI) in the same cohort of patients with gliomas.
Thus, the purpose of this study was to investigate the effect of gliomas on DMN deactivation using tb-fMRI with a language task paradigm and DMN FC using a seed-based correlation analysis in both tb-fMRI and rs-fMRI. To measure DMN deactivation during tb-fMRI, we recorded the degree of negative correlation (anticorrelation) in the posterior cingulate cortex (PCC), a major node of the DMN, relative to the language task waveform in both healthy volunteers and patients with gliomas. Then, we measured the FC to the PCC of the other major nodes of the DMN: the medial prefrontal cortex (mPFC) and the left and right inferior parietal lobules (LIPL and RIPL).3 We also compared these 2 different methods of measuring tumor-induced functional changes in the DMN. We hypothesized that DMN regions impacted by tumors would demonstrate less anticorrelation in tb-fMRI and a correspondingly reduced resting-state connectivity compared with healthy volunteers.
MATERIALS AND METHODS
Subject Selection
This retrospective study was approved by the institutional review board of Memorial Sloan Kettering Cancer Center and was conducted in compliance with the Health Insurance Portability and Accountability Act. We analyzed the fMRI scans of 10 healthy controls and 30 patients diagnosed with gliomas who underwent both language tb-fMRI and rs-fMRI in the same sitting between 2017 and 2018. The control subjects gave consent for a funded study. Patient data were all acquired for the purpose of the presurgical planning protocol in addition to routine MR imaging. A summary of patient clinical data, including tumor type, location, and grade, is shown in the Table.
Clinical data and tumor pathology
MR Imaging Acquisition
Both tb-fMRI and rs-fMRI were performed using a 3T scanner (Discovery 750W, GE Healthcare) with 24-channel head coils. fMRI was acquired with single-shot EPI (TR/TE = 2500/32 ms, section thickness = 4 mm, matrix = 64 × 64, FOV = 240 mm, scanning duration = 6 minutes 55 seconds). fMRI coverage matching FLAIR parameters (TR/TE = 10,000/106 ms, TI = 220 ms, matrix = 256 × 256), T1 postcontrast (TR/TE = 600/20 ms, matrix = 256 × 256), and 3D T1-weighted anatomic images using a spoiled gradient recalled-echo sequence (TR/TE = 22/4 ms, matrix = 256 × 256, section thickness = 1 mm) were acquired as routine clinical scans.
Tb-fMRI and rs-fMRI Paradigms
The fMRI examination consisted of 8 cycles of alternating task (20 seconds) and rest periods (30 seconds). During the phonemic fluency task, subjects were presented with different letters and were asked to silently generate words starting with that letter. During the rs-fMRI scan, subjects were instructed to relax, fixate on a central cross, and try not to think during the scan. Brain activity and head motion were monitored in real-time during the scan using BrainWave software (Medical Numerics).
fMRI Data Preprocessing
Images were preprocessed and analyzed with the Analysis of Functional Neuro Images (AFNI; http://afni.nimh.nih.gov/afni) software.25 Images were assessed for noise and artifacts. To correct for head motion, we performed 3D volume registration. Spatial smoothing using a Gaussian filter with 6-mm full width at half maximum was applied to suppress noise and increase the SNR. In addition, rs-fMRI data were filtered (range, 0.01–0.08 Hz) to extract functional integration processes and remove respiratory and cardiac noise during rest.
DMN Deactivation and FC Analysis
We measured the DMN with 3 different methods in controls and patients: language-task-based deactivation, functional connectivity using the task-based fMRI map, and functional connectivity using the resting-state fMRI map.
Deactivation: To assess DMN deactivation in tb-fMRI, we performed a seed-based correlation analysis based on the functional ROI for each subject. For each subject, 3 correlation maps were sequentially generated. First, a correlation map was created from the BOLD response to the word-generation task, depicting both positively correlated and anticorrelated areas (tb-fMRI map). The region of the PCC that was anticorrelated in the tb-fMRI map was then selected as an ROI. A correlation threshold with an absolute value of 0.4 (P < .0001, and Q = .01) was set to minimize the possible false-positive rate. All anticorrelated voxels of less than −0.4 at the level of PCC on the axial view of the functional image were used to generate the PCC ROI.
Functional connectivity, task-based: To assess DMN FC, we used this PCC ROI to create a second correlation map from the same task-based functional data (PCC ROI task-based map), to measure the correlation of the other DMN regions (mPFC, LIPL, and RIPL) with the PCC.
Functional connectivity, resting-state: The same PCC ROI was transferred to the rs-fMRI data and used to create a third correlation map (PCC ROI resting-state map), again to measure the correlation of the other DMN regions with the PCC.
For quantitative analysis, the number of voxels, average correlation value, maximum correlation value, and correlation threshold were recorded from each DMN region.
For group analysis of controls, the correlation maps generated from PCC ROIs in tb-fMRI and rs-fMRI were normalized to the Montreal Neurological Institute 152 T1_2-mm template and averaged over the subjects using the FMRIB Software Library (FSL; http://www.fmrib.ox.ac.uk/fsl)26 to create the mean correlation map. The final map was thresholded at t > 6 (P < .001) and overlayered on the Montreal Neurological Institute 15 T1_2-mm template image. Patient data were then separated by tumor location into 3 groups for analysis: tumors near or invading the posterior DMN (n = 14), tumors near or invading the anterior DMN (n = 8), and tumors outside the DMN (n = 8), as indicated by abnormal findings on FLAIR. The tumor-location group classification was supervised by a Certificate of Added Qualification–certified neuroradiologist with 20 years' experience. DMN symmetry was measured with the inferior parietal lobe (IPL) ratio, which was calculated by dividing the correlation of the IPL on the nontumor side by the correlation of the IPL on the tumor side for both tb-fMRI and rs-fMRI. In controls, because the DMN is symmetric, the ratio was arbitrarily calculated as the LIPL correlation divided by the RIPL correlation. Patient data were also separated by tumor hemisphere (right-sided = 7, left-sided = 23) and tumor grade (II = 11, III/IV = 19).
Statistical Analysis
The 2-tailed Mann-Whitney U test was used to assess the impact of tumor location, tumor hemisphere, and tumor grade on the average correlation value of the PCC in the tb-fMRI map and of the correlation values of the mPFC, LIPL, and RIPL to the PCC in the PCC ROI task-based and resting-state maps. The Benjamini-Hochberg procedure (Benjamini-Hochberg critical value = i/m × Q, where i = rank order, m = total number of tests, and Q = FDR =0.05) was used to adjust the P value and control the false discovery rate (FDR). For analyses of tumor location and tumor grade, we used m = 3 because there were 3 control-to-patient comparisons for deactivation and FC in each brain region in tb-fMRI and in rs-fMRI. For analysis of tumor hemisphere, there were 2 patient-to-control comparisons; consequently, m = 2. P values lower than their respective critical values were considered significant.
RESULTS
DMN Deactivation and the FC of Patients versus Controls
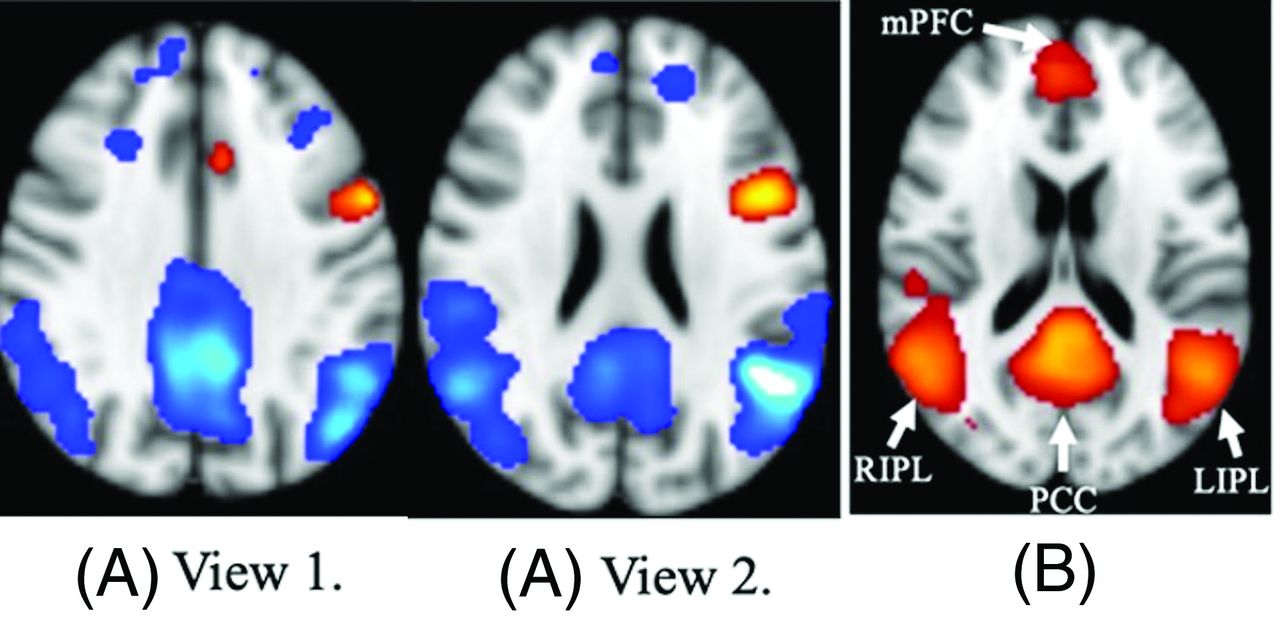
While performing the language task in tb-fMRI, all patients and controls demonstrated anticorrelation in the PCC. Healthy controls demonstrated anticorrelation with the language task in the 4 major DMN regions (PCC, mPFC, LIPL, and RIPL) (Fig 1A), as well as a baseline level of DMN FC on a mean PCC ROI task-based map (Fig 1B).

Group correlation maps for controls (n = 10). A, Group analysis map created from task-paradigm correlation maps (2 axial views). A positive correlation (orange) in the Broca area can be seen in the left hemisphere. A negative correlation (blue) in the DMN is also apparent. The 4 major DMN regions (PCC, mPFC, LIPL, and RIPL) are clearly anticorrelated, and the left-hemisphere Broca area is positively correlated with the language task. B, Mean group analysis map (t = 6, P < .001) created from PCC ROI task-based correlation maps. DMN connectivity is apparent (orange). As expected, the regions of strongest connectivity to the PCC are the other major DMN regions. Thus, this figure illustrates a baseline level of DMN FC in healthy controls that can be visualized using the tb-fMRI correlation map with a PCC ROI.
DMN anticorrelation, FC in tb-fMRI, and FC in rs-fMRI were all similarly disrupted in patients with gliomas compared with controls. Compared with the group of controls (n = 10), the group of patients (n = 30) showed significantly less anticorrelation in the PCC in tb-fMRI (P = .001). Patients also showed significantly lower FC of the other 3 DMN regions to the PCC (mPFC, P = .004; LIPL, P = .04; RIPL, P = .048) in tb-fMRI. While undergoing rs-fMRI, patients also showed lower FC to the PCC compared with controls, but the difference was only significant for the mPFC (P = .02).
Effect of Tumor Location on DMN Deactivation and FC
Figure 2 shows the fMRI maps of 3 patients, 1 from each tumor location group. Patient A, who had a tumor infiltrating the RIPL, had less anticorrelation of the RIPL (compared with the LIPL) in both tb-fMRI and rs-fMRI. Patient A also showed less FC of the RIPL (compared with the LIPL) to the PCC in both tb-fMRI and rs-fMRI. Patient B had a tumor near the mPFC in the left hemisphere, and patient C had a tumor outside the DMN in the left hemisphere. Notably, across all patients including these 3, no significant differences were found in terms of FC of the mPFC, LIPL, and RIPL to the PCC between tb-fMRI and rs-fMRI. In addition, the ratio of FC values in each DMN region in tb-fMRI versus rs-fMRI was not significantly different between controls and patients.

Examples of correlation maps in an axial view for patients with gliomas in different locations (patient A, posterior DMN; patient B, anterior DMN; patient C, outside DMN). The first row of images shows task-paradigm correlation maps. Blue represents areas of negative correlation, and orange represents areas of positive correlation to the language task. The second row of images illustrates the PCC ROI task-based fMRI correlation maps. Red and yellow represent areas of increased connectivity to the PCC ROI. The third row of images illustrates PCC ROI resting-state fMRI correlation maps. Patient A has a right-hemisphere glioblastoma invading the posterior DMN. Patient B has a left-hemisphere anaplastic oligodendroglioma invading the anterior DMN. Patient C has a left-hemisphere oligodendroglioma outside the DMN. The first 2 rows demonstrate a decreased anticorrelation in the DMN in the area of the tumor that corresponds to a decrease in both resting-state and task-based fMRI connectivity.
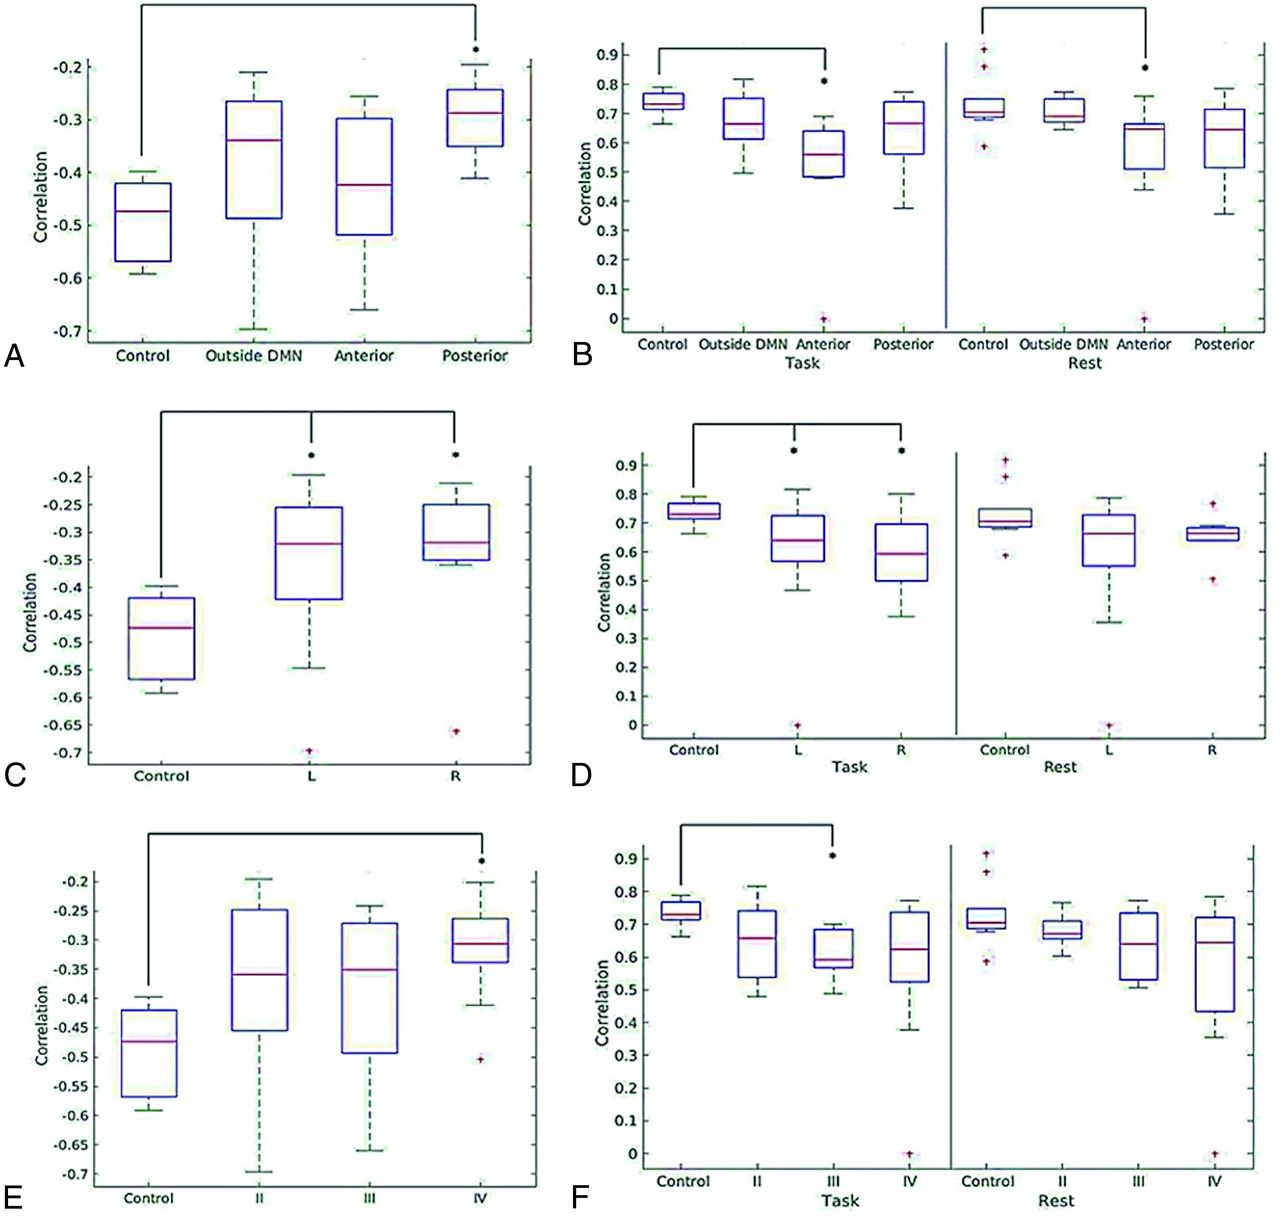
When we stratified the data by tumor location (Fig 3A, -B), only patients with posterior DMN tumors showed significantly lower anticorrelation in the PCC compared with controls (P < .001) in tb-fMRI. In terms of DMN FC, significantly lower FC of the mPFC to the PCC was found in patients with anterior DMN tumors in tb-fMRI (P = .001) and rs-fMRI (P = .01). Patients with posterior DMN tumors also demonstrated significantly lower FC to the LIPL in tb-fMRI (P = .02) and rs-fMRI (P = .02).

Box-and-whisker plots illustrating the distribution of average correlation values in the term of task-induced deactivation of PCC region of the DMN for controls and patients by tumor location (A), tumor hemisphere (C), and tumor grade (E) and average correlation values of the mPFC region of the DMN for controls and patients in both the PCC ROI task-based correlation map and the PCC ROI resting-state correlation map by tumor location (B), tumor hemisphere (D), and tumor grade (F) .
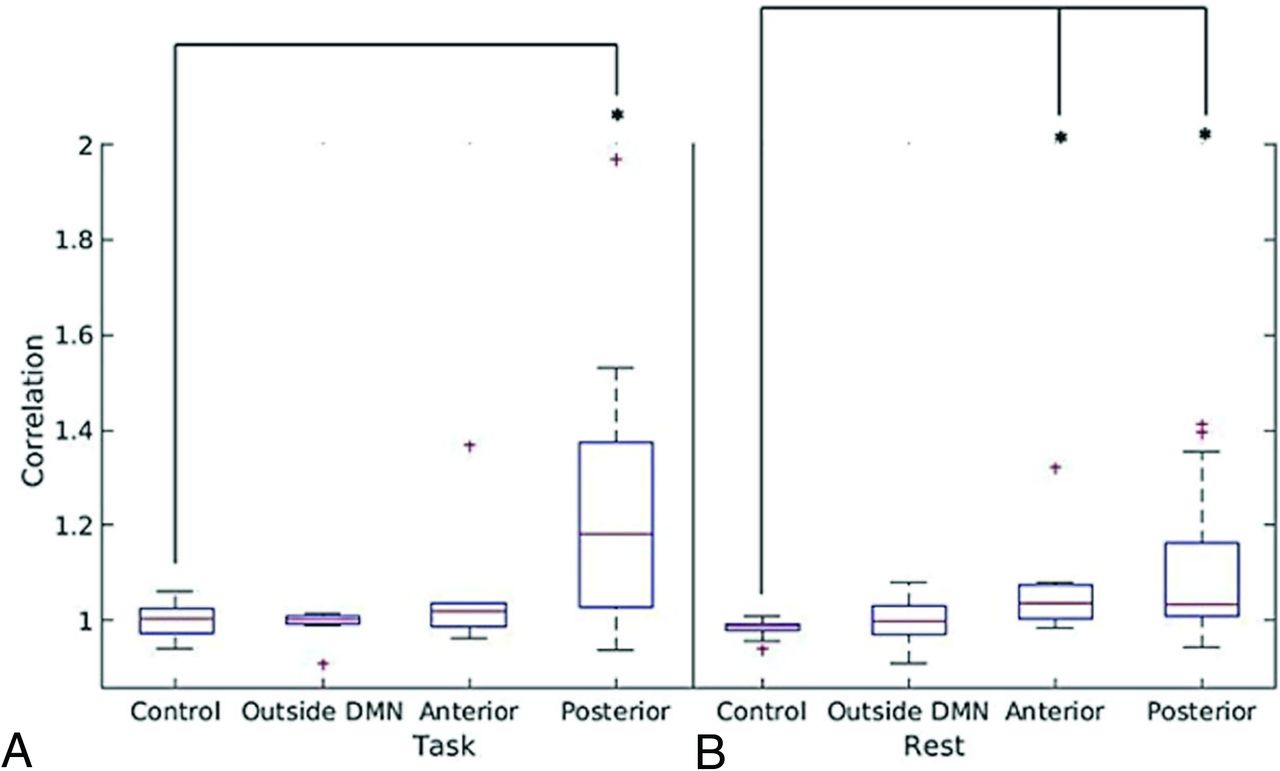
The IPL ratio of patients with posterior DMN tumors was significantly greater than that of controls (tb-fMRI, P = .006; rs-fMRI, P = .008) (Fig 4). The IPL ratio of patients with anterior DMN tumors was significantly greater than that of controls in rs-fMRI (P = .004), but not in tb-fMRI. Patients with tumors outside the DMN showed no significant differences from controls.

Box-and-whisker plots illustrating the ratio of the average correlation values of nontumor/tumor IPL versus tumor location for patients and of left/right IPL versus tumor location for controls in task-based fMRI (A) and resting-state fMRI (B).
Effect of Tumor Hemisphere on DMN Deactivation and FC
Significantly lower PCC anticorrelation was found for patients with both left tumors (P = .003) and right tumors (P = .015) compared with controls (Fig 3C, -D). The FC of the mPFC to the PCC was significantly lower for patients with both left (P = .02) and right (P = .03) tumors in tb-fMRI, but not in rs-fMRI. No hemispheric differences in PCC anticorrelation or FC were found when directly comparing patients with left tumors with those with right tumors.
Effect of Tumor Grade on DMN Deactivation and FC
After we stratified by tumor grade (Fig 3E, -F), only patients with grade IV tumors showed significantly lower PCC anticorrelation (P < .001) compared with controls. Only patients with grade III tumors showed significantly lower mPFC connectivity in tb-fMRI (P = .005) compared with controls, while rs-fMRI revealed no significant differences in FC compared with controls. No significant differences in PCC anticorrelation or mPFC connectivity were found when directly comparing grade II with high-grade (grades III and IV) tumors.
DISCUSSION
Our study has 2 major findings: First, we showed that patients with gliomas have significantly less anticorrelation in the PCC on tb-fMRI than healthy controls. Second, our study successfully used the PCC identified in tb-fMRI as an ROI for seed-based correlation analysis to examine the FC of the DMN in both task-based and resting-state fMRI in patients with gliomas. We found strong overlap between the task-based and resting-state maps.
We found significantly lower anticorrelation in the PCC as well as significantly lower FC of the 3 regions of the DMN (mPFC, LIPL, and RIPL) to the PCC in patients compared with controls during task-based fMRI. The decrease in anticorrelation was more pronounced for patients with tumors in or near the posterior regions of the DMN (including the PCC, LIPL, and RIPL). When patients were stratified by tumor hemisphere or tumor grade, both patients with left- and right-hemisphere tumors as well as patients with grade IV tumors demonstrated decreased anticorrelation in the PCC compared with controls. No significant differences were found for either anticorrelation in the PCC or FC when comparing left- with right-hemisphere tumors or grade II tumors with high-grade (grades III and IV) tumors. Due to the relatively small sample size of the overall study, especially of each subgroup, and the statistical adjustments for multiple comparisons, underpowering may have contributed to these negative results.
While DMN deactivation has not been previously studied in patients with brain tumors, alterations in DMN connectivity have been shown. Esposito et al18 used independent component analysis to show globally reduced DMN connectivity in patients with left-hemisphere gliomas during a language task. Our results not only affirm their findings but also show the same results in right-hemisphere gliomas. Furthermore, we showed decreased DMN FC for right- and left-hemisphere gliomas in the resting state.
The PCC has been described as a critical node of the DMN.17 The location-dependent change in PCC anticorrelation indicates that tumors near or directly infiltrating the posterior DMN regions have a greater impact on PCC anticorrelation. The physical proximity of these tumors to the PCC is likely part of the explanation. Anterior DMN tumors showed a smaller difference in PCC anticorrelation than tumors outside the DMN; overall, tumors outside the DMN were closer in distance to the PCC than anterior DMN tumors.
Meanwhile, the location-dependent asymmetry of IPL connectivity means that posterior DMN tumors affect the ipsilateral IPL more than the contralateral IPL; therefore, these tumors have a greater impact on ipsilateral connectivity. Again, this may be largely due to proximity, given that many of the posterior DMN tumors were near the ipsilateral IPL.
Local tumor effects, such as parenchymal infiltration, local necrosis, and tumor neoangiogenesis, may result in neurovascular uncoupling. Neurovascular uncoupling has been shown to cause false-negative results in both tb-fMRI and rs-fMRI data.27⇓⇓⇓⇓⇓⇓⇓⇓⇓⇓-38 It remains unclear whether our findings are due to a global decrease in DMN function, neurovascular uncoupling, or some combination thereof. Our data showed—in patients with both left- and right-hemisphere tumors, compared with controls—lower PCC anticorrelation and lower FC of the mPFC to the PCC in tb-fMRI. In contrast, a rs-fMRI study by Ghumman et al20 found decreased overall DMN connectivity in patients with left-hemisphere cerebral tumors, but not in patients with right-hemisphere tumors. Their study included gliomas along with other tumor pathologies such as meningiomas and metastases, which may impact DMN connectivity differently. However, Ghumman et al20 did not find a significant difference among histologic types of tumor. Again, we studied connectivity of individual regions to the PCC, not overall network connectivity, but this difference likely does not explain the discrepancy in our findings.
In another study, Harris et al19 showed that brain tumors of higher grades corresponded to a greater reduction in global DMN connectivity in pseudo-resting-state fMRI. However, after false discovery rate correction, our data did not corroborate this finding, with lower FC found only in grade III tumors between the PCC and mPFC. An important difference is that their study also measured global DMN connectivity, while our study directly measured connectivity between individual regions and the PCC. Additionally, their data were acquired using pseudo-resting-state fMRI, which analyzes residual tb-fMRI signals after taking into account activation due to the task. On the other hand, 1 possible explanation for our negative results is underpowering due to false discovery rate correction for multiple comparisons and a smaller sample size. Esposito et al18 actually found increased correspondence in the global DMN spatial pattern of controls and patients with high-grade gliomas compared with those with low-grade gliomas; they attributed this finding to the slow-growing nature of low-grade gliomas, which allows time for network reorganization due to neuronal plasticity.
The decreased DMN deactivation and connectivity have clinical implications for cognitive decline in patients with brain tumors. Deficits in behavioral and cognitive function in patients with tumors in or near the posterior DMN may be explained by the location-dependent effects of brain tumors. Deficits in activities such as memory-encoding and external task performance may be at least partially due to the disruption of DMN deactivation and connectivity by the tumor. Because our patients' scans were all preoperative, comparison with postoperative fMRI could assess whether resection or debulking is associated with restoration of DMN deactivation and FC.
Our study was limited by a number of factors. Although ROIs were systematically placed in each patient by 1 investigator, they were selected manually, which creates the possibility of human variation in ROI placement. At the same time, manual selection allowed us to better account for small variations in the location of positive or negative correlations in each region, especially because tumors and their accompanying edema often induce mass effect that distorts regional anatomy. Another limitation is the variation in the precise location of each tumor; the reduced number of patients with tumors in each DMN region necessitated grouping tumors in the PCC or bilateral IPLs into the broader “posterior DMN” group. Each tumor that was classified as in or near the anterior or posterior DMN was determined by the investigators visually, and the amount of overlap between the DMN region and the tumor or surrounding edema was variable. Limited patient volume also prohibited further analysis of tumors “outside the DMN” by a more specific location.
CONCLUSIONS
Task-based fMRI shows impaired deactivation in patients with gliomas. In particular, patients with posterior DMN tumors and grade IV tumors showed decreased anticorrelation in the PCC. Our study also, for the first time, directly examined the FC of the DMN in both task-based and resting-state fMRI in patients with gliomas, using the PCC identified in tb-fMRI as an ROI for seed-based correlation analysis. DMN maps created from a PCC ROI using the tb-fMRI and rs-fMRI waveforms are strongly correlated. Hence, in DMN regions impacted by tumors, the decrease in anticorrelation in tb-fMRI corresponds to a reduced resting-state connectivity compared with healthy volunteers.
ACKNOWLEDGMENT
The authors would like to acknowledge Joanne Chin, Senior Editor/Grant Writer of the Department of Radiology at Memorial Sloan Kettering Cancer Center, for her valuable contributions.
Footnotes
This work was supported by the following grants from the National Institutes of Health: National Institutes of Health–National Cancer Institute P30 CA008748, National Institutes of Health–National Institute of Biomedical Imaging and Bioengineering R01 EB022720 (Holodny AI, Principal Investigator), National Institutes of Health–National Cancer Institute R21 CA220144 (Holodny AI and Peck KK, Principal Investigators), National Institutes of Health–National Cancer Institute U54 CA137788, National Institutes of Health–National Cancer Institute R25CA020449.
The content is solely the responsibility of the authors and does not necessarily represent the official views of the National Institutes of Health.
Previously presented as an abstract at: Annual Meeting of the American Society of Neuroradiology, May 18–23, 2019; Boston, Massachusetts.
Disclosures: Yash M. Maniar—RELATED: Support for Travel to Meetings for the Study or Other Purposes: Icahn School of Medicine at Mount Sinai Medical Student Research Office, Comments: funding for the national meeting of the American Society of Neuroradiology, poster submission/registration. Andrei I. Holodny—UNRELATED: Other: fMRI Consultants, LLC, Comments: a purely educational entity.
References
- 1.
- 2.
- 3.
- 4.
- 5.
- 6.
- 7.
- 8.
- 9.
- 10.
- 11.
- 12.
- 13.
- 14.
- 15.
- 16.
- 17.
- 18.
- 19.
- 20.
- 21.
- 22.
- 23.
- 24.
- 25.
- 26.
- 27.
- 28.
- 29.
- 30.
- 31.
- 32.
- 33.
- 34.
- 35.
- 36.
- 37.
- 38.
- Received October 19, 2020.
- Accepted after revision February 19, 2021.
- © 2021 by American Journal of Neuroradiology