Abstract
BACKGROUND AND PURPOSE: The prognosis and treatment of pediatric low-grade gliomas is influenced by their molecular subtype. MR imaging remains the mainstay for initial work-up and surgical planning. We aimed to determine the relationship between imaging patterns and molecular subtypes of pediatric low-grade gliomas.
MATERIALS AND METHODS: This was a retrospective bi-institutional study for patients diagnosed from 2004 to 2021 with pathologically confirmed pediatric low-grade gliomas molecularly defined as BRAF fusion, BRAF V600E mutant, or wild-type (which is neither BRAF V600E mutant nor BRAF fusion). Two neuroradiologists, blinded, independently reviewed imaging parameters from diagnostic MRIs, and discrepancies were resolved by consensus. Bivariate analysis was used followed by pair-wise comparison of the Dwass-Steel-Critchlow-Fligner method to compare the 3 molecular subtypes. Interreader agreement was assessed using κ.
RESULTS: We included 70 patients: 30 BRAF fusion, 19 BRAF V600E mutant, and 21 wild-type. There was substantial agreement between the readers for overall imaging variables (κ = 0.75). BRAF fusion tumors compared with BRAF V600E and wild-type tumors were larger (P = .0022), and had a greater mass effect (P = .0053), increased frequency of hydrocephalus (P = .0002), and diffuse enhancement (p <.0001). BRAF V600E mutant tumors were more often hemispheric (P < .0001), appeared more infiltrative (P = .0002), and, though infrequent, were the only group demonstrating diffusion restriction (qualitatively; P = .0042) with a lower ADC ratio (quantitatively) (P = .003).
CONCLUSIONS: BRAF fusion and BRAF V600E mutant pediatric low-grade gliomas have unique imaging features that can be used to differentiate them from each other and wild-type pediatric low-grade glioma using a standard radiology review with high interreader agreement. In the era of targeted therapy, these features can be useful for therapeutic planning before surgery.
ABBREVIATIONS:
- IQR
- interquartile range
- pLGG
- pediatric low-grade glioma
- WHO
- World Health Organization
Pediatric low-grade gliomas (pLGGs) make up the largest proportion, about 30%, of all pediatric CNS tumors.1 pLGGs have a favorable 10- to 20-year overall survival of approximately 90%–95%.2 However, pLGGs can lead to severe morbidity.3 Upfront surgical resection can result in a cure;4 however, more than half of the pLGGs are not completely resected, and subsequent treatment with chemotherapy is commonly required.5,6 Five-year progression-free survival for those requiring chemotherapy is 39%–53%.7,8
Mutations that cause up-regulation of the RAS/mitogen-activated protein kinase pathway have been implicated in most pLGGs, the most common being KIAA1549-BRAF fusion (BRAF fusion), followed by neurofibromatosis-1 (NF1) alterations and the BRAF V600E mutation.9 Recently there has been a shift to determine the prognosis of pLGGs on a molecular basis,6 and therapeutics are moving toward targeting the specific pLGG driver mutation.10⇓-12
Neuroimaging with MR imaging is the mainstay for the initial diagnostic work-up and surgical planning for a definitive pathologic diagnosis.13 There is an increasing desire to determine imaging surrogates for molecular subtypes for various pediatric CNS tumors.14⇓-16 Currently, determination of the pLGG molecular subtype requires tissue acquisition and subsequent molecular testing, which might not be readily accessible in all centers. A molecular determination using imaging surrogates would be beneficial to guide appropriate therapy, including the aggressiveness of upfront surgical resection, selection of chemotherapy agents, the timeframe to initiating therapy, and to direct the sequence of multimodality therapy application.
To date, few studies have evaluated the correlation between MR imaging features and pLGG molecular subtypes. Ishi et al,17 in 2021, investigated this correlation in individuals with optic pathway/hypothalamic pilocytic astrocytoma with a small sample size. Wagner et al,18 in 2021, evaluated the same relationship using machine learning techniques, a promising radiologic tool that still needs full incorporation into the clinical routine. Our study aimed to assess MR imaging features of pLGGs associated with BRAF fusions, BRAF V600E mutations, and those negative for BRAF V600E and BRAF fusions (wild-type) in patients without NF-1, using an approach that simulates the routine clinical practice, including a radiologist’s imaging review.
MATERIALS AND METHODS
This retrospective bi-institutional study was a collaboration between the British Columbia Children’s Hospital (Vancouver, British Columbia, Canada) and the IWK Health Center (Halifax, Nova Scotia, Canada) tertiary care hospitals in Canada. There was institutional review board approval and a waiver of consent from both institutions. An interinstitutional data-transfer agreement was obtained for data-sharing.
Patients
Data were retrieved from the 2 tertiary pediatric hospitals from 2004 to 2021. Patients who had a pathologically confirmed diagnosis of BRAF fusion, BRAF V600E, or wild-type, were younger than 19 years of age at diagnosis, and who had a diagnostic MR imaging at presentation were eligible. BRAF fusion tumors in this study refer only to KIAA1549-BRAF fusions. Patients with pLGGs in the setting of NF-1 were excluded, because these patients generally have distinguishing imaging features, a positive family history, and frequently do not undergo confirmatory tissue diagnosis.
Demographics and Clinical Details
Information collected included sex, age at diagnosis, disease progression, molecular subtype, World Health Organization (WHO) grade, tumor location, spine imaging at diagnosis, metastasis within the spine, and metastasis within the brain. Disease progression was determined through retrospective chart review of patients’ MR imaging reports and clinical documentation.
Histopathology and Molecular Grouping
BRAF fusion status was determined using NanoString Technologies (https://nanostring.com/) or fluorescence in situ hybridization, while the BRAF V600E mutation was determined using immunohistochemistry and/or droplet digital polymerase chain reaction as previously described.6,19 Molecular analysis was performed with formalin-fixed paraffin-embedded tissue obtained at the time of the operation.
MR Imaging
All patients from the IWK Health Center underwent brain MR imaging, some with spine MR imaging, at 1.5T from a single vendor (Signa HDxt; GE Healthcare). Patients from British Columbia Children’s Hospital underwent brain MR imaging, some with spine MR imaging, at 1.5T or 3T (Magnetom Avanto, Magnetom Prisma; Siemens). As expected, MR imaging protocols for brain tumors have changed with time during the 17-year study period. However, the MR imaging protocols used in the 2 institutions include, at minimum, the following: 2D axial and/or coronal T2WI, 2D axial or coronal T2 FLAIR, 2D axial DWI, ADC, 2D axial or sagittal precontrast T1WI, and 2D axial gadolinium-based contrast agent–enhanced T1WI.
MR Imaging Review
Two neuroradiologists (D.M.-M. and M.A.S.), who were blinded to demographic, clinical, pathologic, and molecular data, independently reviewed imaging parameters on the initial diagnostic MR imaging. Before commencement, the 2 readers determined the definition of each imaging parameter through a consensus reading of 10 randomly selected cases that were not included in the study cohort, to refine and standardize the definition of parameters. These included the following: 1) tumor location, which was grouped as cerebral hemisphere, brainstem, optic pathway/hypothalamic glioma, posterior fossa (other than brainstem), or spinal cord; 2) tumor size, which was obtained as a product of perpendicular diameters of the tumor on axial T2 FLAIR; 3) the presence and extent of peritumoral vasogenic edema judged as none, mild, moderate, or massive; 4) the presence and magnitude of mass effect, judged as none, mild, moderate, or massive; 5) diffusion restriction subjectively judged as yes or no relative to normal brain while comparing the ADC with the b = 1000 s/mm2 images; 6) the presence and degree of enhancement based on the tumor solid component, judged as none/minimal if less than one-third of the solid component enhances; moderate if the enhancement involves one-third to two-thirds of the solid component; or diffuse if more than two-thirds of the tumor enhances; 7) tumor signals on T1WI, T2WI, and FLAIR judged as hyper-, iso-, or hypointense; 8) cyst/cavitation change judged as present or not; 9) hemorrhage/calcification judged as present or not; 10) metastatic status judged as present or not; 11) hydrocephalus judged as present or not; and 12) tumor margins judged as infiltrative or well-defined. For MR spectroscopy, the following ratios were obtained from MR imaging–generated data: Cho/Cr, Cho/NAA, and lactate/Cr, which were judged as high, normal, or low. For any discordant readings between the 2 readers, an agreement was reached in a separate meeting through consensus.
MR Imaging Quantitative ADC Ratio Calculation
Quantitative ADC analysis was performed using a US Food and Drug Administration–approved commercial software package (AW Server 3.2; GE Healthcare). Blinded to clinical, pathologic, and molecular data, another author (C.C.) independently created nonoverlapping oval or circular ROIs within the solid portions of the tumor on all consecutive sections. The calcification/hemorrhagic foci or cystic/necrosis foci were excluded. In patients with supratentorial tumors, the ADCs of the normal-appearing contralateral brain were recorded, and in patients with tumors located in the posterior fossa, the ADC of the normal cerebellum was recorded. The ROI placement on the normal cerebellum was performed as remotely as possible from the tumor and with exclusion of vasogenic edema, when present, and adjacent CSF signal, if any. The mean tumor ADCs were calculated by averaging the ADCs obtained from all the ROIs. Tumor-to-normal brain ADC ratios (hereafter, ADC ratios) were calculated using the mean tumor ADCs.
Statistics and Analysis
All statistical analyses were performed using the software SPSS, Version 26 (IBM), and P values < .05 were considered statistically significant. Continuous variables were summarized using descriptive statistics, including number, median, interquartile range (IQR), SD, and range, while categoric variables were summarized using number and percentage. A κ statistic was generated from the 2 readers’ data, and values <0.20 were interpreted as poor, 0.21–0.40 as fair, 0.41–0.60 as moderate, 0.61–0.80 as substantial, and 0.81–1.00 as excellent agreements. First, we used bivariate analyses, including the Fisher exact test for categoric variables or ANOVA for continuous variables, to compare the 3 molecular groups of pLGGs (BRAF fusion, BRAF V600E, or wild-type). This procedure was followed by pair-wise comparison of the Dwass-Steel-Critchlow-Fligner method to compare 2 of the 3 molecular groups head-to-head, which provided the comparison of BRAF fusion and BRAF V600E.
RESULTS
Patients
Seventy patients (31 males and 39 females) were included in this study. The median age at diagnosis was 6.3 years (IQR, 2.3–11.7 years). Thirty patients (43%) had tumors with BRAF fusion, 19 (27%) with the BRAF V600E mutation, and 21 (30%) with wild-type (negative for BRAF V600E/BRAF fusion). A summary of patient demographic and clinical information is shown in Table 1. There was no statistically significant difference in the age of patients, sex, tumor location, or tumor mutation status when comparing the patients from the 2 different institutions (Online Supplemental Data).
Cohort information
Clinical and Histopathologic Characteristics
A summary of clinical and histopathologic characteristics of patients is shown in Table 2.
Univariate analysis of demographics and clinical characteristics by molecular group
Patients with BRAF fusion were younger (median, 3.3 years) at diagnosis compared with the 2 other groups (BRAF V600E [9.7 years] and wild-type [10.5 years], P = .0012). Compared with the BRAF fusion and wild-type, there was a trend for BRAF V600E to show an increased frequency of WHO grade II histology (P = .07 and P = .09 for 2-group and 3-group comparisons, respectively). There was no statistically significant difference among the 3 groups with respect to metastatic status at diagnosis or tumor progression.
Interreader Agreement
Overall κ agreement among the readers for radiologic variables was substantial (κ = 0.75; 95% CI, 71.5–99.2).
MR Imaging Features
A summary of the imaging characteristics by molecular subtype can be found in the Online Supplemental Data.
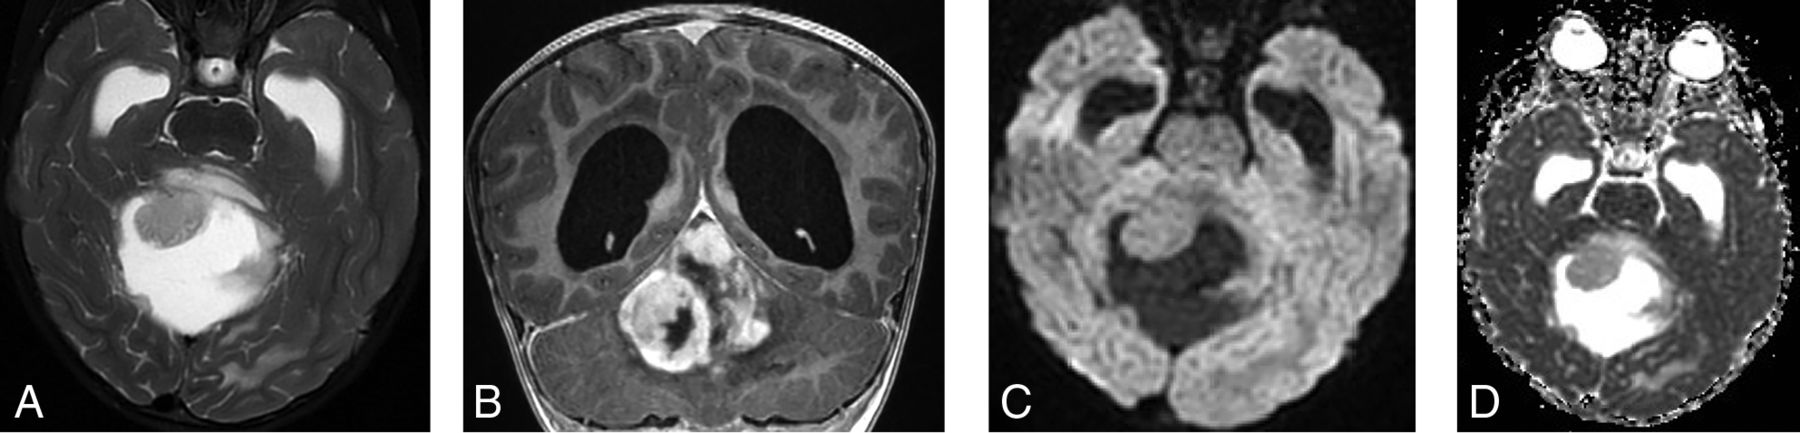
Tumor location was strongly associated with molecular subtype because those with BRAF fusion tumors were more likely to be found in the posterior fossa (excluding the brainstem), while BRAF V600E tumors were more commonly found in a cerebral hemisphere (P = < .0001). BRAF fusion tumors compared with BRAF V600E and wild-type were larger (P = .0022) and demonstrated an increased frequency of moderate-to-massive mass effect (P = .0053) and hydrocephalus (P = .0002); these differences remained statistically significant when directly comparing BRAF fusion and BRAF V600E (all, P = < .05) (Fig 1). BRAF fusion tumors also showed an increased frequency of diffuse enhancement compared with BRAF V600E and wild-type tumors (P = < .0001) and when directly compared with BRAF V600E (P = .0036).

A 3-year-old girl who presented with symptoms related to increased intracranial pressure. The brain MR imaging shows a large complex cystic/solid mass lesion arising from the vermis and anteriorly compressing the fourth ventricle, therefore causing supratentorial massive hydrocephalus. The solid component of the tumor shows slight hyperintense signal on T2WI (A) and diffuse enhancement (B) but not with diffusion restriction (C and D). The tissue diagnosis was pilocytic astrocytoma with KIAA1549:BRAF fusion.
Tumors with BRAF V600E were more infiltrative compared with BRAF fusion and wild-type tumors (P = .0002) and when directly compared with BRAF fusion (P = .0001). BRAF V600E tumors were more likely to be isointense on T1WI compared with BRAF fusion and wild-type (P = .0023) and when directly compared with BRAF fusion (P = .008).
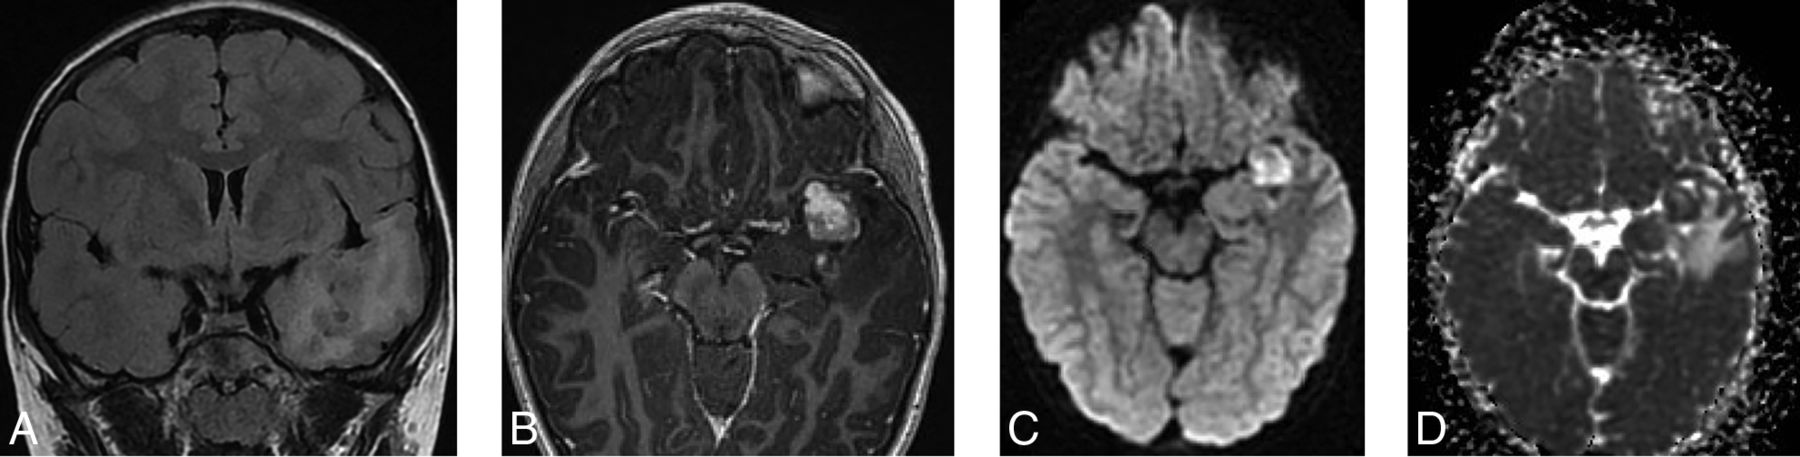
Diffusion restriction was uncommon in our cohort. However, when it occurred, only BRAF V600E tumors demonstrated diffusion restriction. Qualitative assessment demonstrated diffusion restriction in 4 of 19 BRAF V600E tumors (P = .0042) (Fig 2). On quantitative assessment, BRAF V600E showed a lower ADC ratio compared with BRAF fusion and wild-type (P = .003), and this difference was more statistically significant when compared directly with BRAF fusion (P = . 0003).

A 9-year-old boy with seizures. The brain MR imaging shows an ill-defined mass lesion with tiny internal cystic changes on T2 FLAIR (A) involving the mesial aspect of the left temporal lobe. The lesion shows moderate surrounding edema, mild mass effect against surrounding structures, as well as moderate enhancement (B). On DWI (C) and ADC (D), the mass shows diffusion restriction. The final tissue diagnosis was ganglioglioma with a BRAF V600E mutation.
Only a subset of patients underwent MR imaging spectroscopy (n = 21; 30% [11 BRAF fusion, 7 BRAF V600E, and 3 wild-type]). While spectroscopy was not in any way discriminating across molecular subtypes (P > .05, all), most tumors had high Cho/Cr (n = 19; 90%), high Cho/NAA (n = 19; 90%), and elevated lactate (n = 19; 90%) (Online Supplemental Data).
DISCUSSION
In this bi-institutional study, we evaluated the relationship between MR imaging characteristics and pLGG molecular groups to distinguish among BRAF fusion, BRAF V600E, and wild-type tumors. Our results show features that enable some pretherapeutic prediction of pLGG molecular subtypes. In our series, BRAF V600E tumors were more infiltrative, were the only ones to show diffusion restriction with a low ADC ratio, and were likely to be located within the cerebral hemispheres, whereas BRAF fusion tumors were more well-defined, larger with significant mass effect including hydrocephalus, and more likely to demonstrate diffuse enhancement.
Our study is the first to report the association of BRAF V600E and diffusion restriction, both qualitatively and quantitatively, findings suggestive of higher tumor cellularity and tumor aggressiveness.20 BRAF V600E tumors were more infiltrative compared with BRAF fusion tumors. Ho et al,21 in 2015, had comparable results, citing BRAF V600E tumors as having a low T2 signal and infiltrative margins, but in their study, diffusion restriction was not assessed. Ishi et al17 found a lower T2WI signal and larger T2WI/contrast-enhanced FLAIR mismatch to be indicative of BRAF V600E mutation for optic pathway gliomas. However, signal mismatches were not assessed in our series. In contrast to previous studies that have found BRAF V600E tumors showing higher rates of tumor invasiveness and recurrence,6,21⇓-23 our study found a trend for BRAF V600E tumors to be classified as WHO grade II tumors but with no statistically significant difference in tumor progression compared with BRAF fusion tumors. This finding could be partially due to the retrospective nature of the study, in which tumors that progressed were more likely to have had molecular testing, leading to a potential over-representation of progression in these cohorts. This could also be due to the limited sample size in this study. Otherwise, our other key clinical results showing younger age and predilection of posterior fossa location for patients with BRAF fusion tumors corroborate the findings in the literature.18,24
BRAF fusion tumors, in our study, were associated with larger size and greater mass effect including hydrocephalus, yet were well-defined. The lack of diffusion restriction in BRAF fusion tumors supports a less aggressive biology. Our observation is supported by the findings of Hawkins et al,25 in 2011, and Reitman et al,26 in 2019, who postulated that BRAF fusion is associated with less aggressive tumor behavior, possibly because of the eventual predilection to undergo tumor senescence. Our observations suggest that one of the main reasons patients with BRAF fusion tumors come to medical attention is due to mass effect and the resultant hydrocephalus as opposed to the more infiltrative pattern noted in BRAF V600E tumors. The diffuse enhancement noted in BRAF fusion tumors may be related to angiogenesis, as opposed to higher cellularity.27 In the current era, in which machine learning is increasing in the research setting, there has been a shift toward the use of genomics to assess the relationship between brain tumors and molecular subgroups, including pLGG.6
The main strength of our study is that we used a clinical model, simulating routine clinical practice, to assess both clinical and diagnostic imaging characteristics of pLGGs associated with molecular subtype using a relatively large number of patients and including all histologic types of pLGGs. Therefore, we believe that our findings may be used on a case-to-case basis during routine clinical practice, potentially impacting patient care. Recently, Wagner et al,18 in 2021, used radiomic software for ROIs to determine the predictive factors of BRAF status in pLGGs of 115 pediatric patients via machine learning, followed by the development of a model to predict the mutational status of the tumor. However, they did not include wild-type tumors in their study, which constitute about one-third of patients with pLGGs,9 and they solely used FLAIR sequences. To that end, our study seems more robust because it includes DWI/ADC, FLAIR, and gadolinium-based contrast agent–enhanced T1WI, which, altogether, constitute MR imaging sequences that allow evaluating the aggressiveness of brain tumors. Therefore, our results could be used in the routine clinical setting to support patient management.
Our study did not show the utility of MR spectroscopy in differentiating pLGG molecular subtypes from one another; however, only 30% of the cohort underwent spectroscopy, and larger studies are needed. In this study, no other advanced MR images were consistently used because some of our data were obtained before implementation of these techniques was more common in the clinical setting.
There are several limitations in this study. Given that it was retrospective and combined data from 2 centers, the imaging lacked homogeneity due to different scanners, MR field strengths, and techniques used. We cannot comment on the metastatic potential because of the low frequency of metastases. The sample size was also not large enough to be considered representative of the greater population. Further studies that incorporate clinical assessment of imaging features and MR machine learning approaches should be conducted.
CONCLUSIONS
This study simulates routine clinical practice in the assessment of clinical and diagnostic imaging characteristics of pLGG subtypes, BRAF fusion, BRAF V600E, and wild-type. We determined particular tumor features of BRAF fusion, such as younger age, posterior fossa location, well-defined margins, larger size with a surrounding mass effect, and hydrocephalus. BRAF V600E tumors were found more commonly in the cerebral hemispheres, had a lower ADC ratio, and were more likely to be infiltrative. Our study offers a baseline for radiologic determination of pLGG molecular subtypes in the clinical setting, with high interreader agreement, which may aid future pLGG molecular subtype identification and therapeutic management strategies.
Acknowledgments
The authors would like to thank John Bryden for his work in the diagnostic imaging department to de-identify subject imaging.
Footnotes
This work was funded through a foundation grant from the IWK Health Center.
Disclosure forms provided by the authors are available with the full text and PDF of this article at www.ajnr.org.
References
- 1.
- 2.
- 3.
- 4.
- 5.
- 6.
- 7.
- 8.
- 9.
- 10.
- 11.
- 12.
- 13.
- 14.
- 15.
- 16.
- 17.
- 18.
- 19.
- 20.
- 21.
- 22.
- 23.
- 24.
- 25.
- 26.
- 27.
- Received February 9, 2022.
- Accepted after revision May 24, 2022.
- © 2022 by American Journal of Neuroradiology