
Abstract
BACKGROUND AND PURPOSE: The volume of decreased cerebral blood flow (CBF) in acute stroke perfusion-weighted imaging frequently overestimates final infarct volume. We hypothesized that surviving tissue exists even in patients without recanalization and tried to determine perfusion thresholds from initial MR imaging.
METHODS: Stroke MR imaging including MR angiography was carried out at days 0, 1, and 7 after stroke onset in 19 patients without recanalization at least until day 1. The following lesions were defined: L0 = diffusion restriction at day 0; LG1 = lesion growth until day 1; LG7 = lesion growth until day 7; ST7 = initially hypoperfused, but surviving tissue. These lesions were transferred on initial MR imaging within 4.7 hours and perfusion values at day 0 were determined.
RESULTS: Median lesion volume L0 at day 0 was 18.2 mL and increased to 39.4 and 43.8 mL at days 1 and 7. Volume of decreased rCBF not progressing to infarction was 148.5 mL (ST7). Mean ST7 perfusion values were different from L0 and LG1, but only mean relative cerebral blood volume (rCBV) was different from LG7, discriminating survival against death of tissue. A threshold value of 0.82 CBV for death versus survival was determined with a sensitivity of 0.56 and specificity of 0.95. Carotid T occlusions showed the greatest potential of lesion growth.
CONCLUSION: Even when vessel occlusion persists, hypoperfused tissue on MR imaging does not necessarily progress toward infarction. The most conclusive inferences can be drawn from CBV images. The site of arterial occlusion also determines progression to infarction.
Over the past decade, MR imaging protocols for studying acute ischemic stroke were developed (1–3). From a number of reports, a mismatch between perfusion (PWI) - and diffusion-weighted imaging (DWI) was suggested as an estimation of the ischemic penumbra (4–6), depicting tissue with the potential to recover but at risk of final infarction in case of permanent ischemia. This concept to identify the penumbra in the individual stroke patient by using MR imaging has raised hopes prolonging the still-narrow 3-hour time window for intravenous thrombolysis (7–9).
Several perfusion parameters (time to peak, TTP; mean transit time, MTT; cerebral blood flow, CBF; and cerebral blood volume, CBV) can be deduced from bolus-tracking PWI based on the central volume theorem (10–12). Nearly all studies trying to characterize the penumbra in human ischemic stroke, however, were not corrected for the salvage of brain tissue due to vessel recanalization in the course of time. Only in the worst case of stroke without recanalization should realistic estimates of the penumbral tissue be extractable by subtracting the initial suspected region of the core infarct by DWI from the PWI lesion area. We tried to find perfusion thresholds of this “true” penumbra in an analysis of acute stroke MR imaging within 6 hours after the onset of symptoms.
Methods
Patients
From August 1999 to March 2003, 189 patients with symptoms of acute ischemic stroke in the carotid artery territory were studied by a standardized MR imaging protocol within 6 hours after symptom onset following the Kompetenznetzwerk Schlaganfall B5 study (8). Of these patients, 17 and an additional two patients studied at Berlin Charité were included because of successful follow-up by MR imaging at day 1 and around day 7 (4–18) after stroke. Only patients without any signs of recanalization in MR angiography (MRA) and PWI at least until day 1 were selected. Most frequent exclusion criteria were incomplete follow-up imaging (n = 79) and partial or complete recanalization (n = 70).
MR Imaging
Imaging details have been published elsewhere (13). In brief, images of the apparent diffusion coefficient (ADC) were calculated from an isotropic diffusion-weighted sequence at b values of 0, 500, and 1000 s/mm2 on a 1.5T MR imaging unit. PWI was derived from changes in the relaxation rate ΔR2* in serial images of a gradient echo, echo-planar sequence during the passage of an intravenous bolus of contrast media. Eleven to 20 sections were acquired, with a section thickness of 6 or 7 mm, interslice gap of 10% (0%), FOV of 240 × 240 mm, and an interpolated image matrix of 128 × 128 pixels. Calculation of perfusion parameter maps was done according to the method suggested by Ostergaard et al (11), by using singular value decomposition to fit an arterial input function from the middle cerebral artery contralateral to the occlusion, yielding PWIs (Makeperf!, Massachusetts General Hospital, Charlestown, MA) of cerebral blood flow (CBF) and volume (CBV) in arbitrary units. MTT images were calculated by CBV/CBF in seconds from the software. TTP was determined from launch of the sequence, which was the time point starting the contrast media injection, to the maximal signal intensity drop. Lack of recanalization to any of the specified regions of interest L0, LG1, LG7, and ST7 was ruled out by visual inspection of follow-up PWI.
Postprocessing
All imaging data sets were transferred into a 3D image format, and spatial alignment was performed as described elsewhere (14) to enable region of interest analysis across all modalities (ADC, PWI, T2) and time points (day 0, 1, 7). Regions of interest of ADC reduction were manually delineated and denoted as lesion at day 0 (L0). At day 1, the outer rim of the T2 lesion subtracted by L0 was defined as the lesion growth until day 1 (LG1). In the same way, lesion growth until day 7 (LG7) was depicted as the outer rim of the T2 lesion at day 7 subtracted by LG1 + L0. Finally, surviving tissue (ST7) was tissue appearing normal on T2 images at day 7 but initially included within the CBF perfusion abnormality at day 0 (Fig 1). These regions of interest were then transferred onto PWIs at day 0 to yield initial mean signal intensities and relative differences (rCBF, rCBV, rMTT, rTTP) by comparison with contralateral mirrored regions of interest.

Illustration of lesion definitions on a representative ADC image at day 0. Lesion on day 0 in black = ADC lesion at day 0; dark gray = lesion growth until day 1 (LG1); pale gray = lesion growth until day 7 (LG7); white = surviving tissue (ST7). LG1 and LG7 were found by surrounding follow-up T2 lesions at day 1 and 7 and transfer onto day 0 PWI images. ST7 is tissue initially showing CBF decrease but without T2 changes at day 7.
Angiography
Time-of-flight MRA determined the intracranial vessel occlusion site. Distal occlusions of the middle cerebral artery (MCA) branches were deduced from smaller territorial PWI lesions. Four occlusion types were distinguished: occlusion of the internal carotid artery with accompanying occlusion of the MCA (ICA/MCA), occlusion of the intracranial ICA bifurcation (carotid T occlusion, CTO), MCA occlusion of the trunk or trifurcation (M1/2), and MCA branch occlusion (M3 or M4 segments). In cases with involvement of the ICA (ICA/MCA or CTO), contrast-enhanced MRA was used to determine the proximal and distal ends of the occlusion independent from inflow phenomena. Acquisition was done before PWI with the standard head and cervical spine coil to avoid unnecessary prolongation of MR imaging.
Statistical Analysis
Mean values of signal intensity in regions of interest of L0, LG1, LG7, and ST7 were taken from CBF, CBV, MTT, and TTP images at day 0 and compared by paired t test. In case of data not following the normal distribution (i.e., lesion volumes), the nonparametric Mann-Whitney U and Kruskal-Wallis tests were used. Analysis was done with SPSS 11.5 (SPSS, Chicago, IL); P values were interpreted descriptively in the context of an explorative data analysis. Thresholds of perfusion values between LG7 and ST7 were investigated by receiver operating characteristic (ROC) analysis with the use of statistical software (ROCKIT 0.9B; http://xray.bsd.uchicago.edu/krl/KRL_ROC/software_index.htm). Thresholds resulted from optimization of the area under the ROC curve.
Results
Of the 19 enrolled patients, seven were female, mean age was 61 years (range, 27–79 years), and National Institute of Health Stroke Scale (NIHSS) was 12 (range, 4–22). At day 0, time from symptom onset to imaging was 2.8 hours (range, 1.7–4.7 hours), and 13 patients were treated by systemic thrombolysis with recombinant tissue plasminogen activator (rt-PA) immediately after MR imaging; however, complete vessel occlusion persisted at least until day 1 in all patients and until day 7 in 6. Recanalization at day 7 was less frequent in CTO than in MCA branch occlusions, despite less-frequent thrombolysis with rt-PA in the latter (Table 1). Recanalization at day 7 had no influence on lesion growth LG1 (P = .58) or LG7 (P = .95).
Occlusion types, therapy, recanalization and lesion volumes L0-LG7
The overall median ADC lesion volume (L0) in all patients was 18.2 mL and increased to 39.4 and 43.8 mL on T2 images at days 1 and 7. The volume of surviving tissue (ST7) was about three times larger (148.5 mL) than the tissue volume finally progressing to infarction. Perfusion values in L0—as well as LG1, LG7, and ST7—are summarized in Table 2. The most severe reduction of rCBF and rCBV occurred in L0 and these values increased continuously to ST7. This results in an “onion-like” distribution of hypoperfusion with the most severe changes in the center of the ischemic territory (Fig 1). The same pattern of initial perfusion values was found in time parameters with a continuous decrease of relative and absolute prolongation of MTT and TTP from the center to the periphery. Pairwise testing between ST7 and all parameters revealed differences of ST7 versus LG0 or LG1. Only rCBV, however, showed a difference between ST7 and LG7 (P = .02). Thus, rCBV was the only candidate parameter distinguishing finally infarcted tissue from surviving brain at day 7. Estimation of a CBV threshold revealed a decrease to 0.82 compared with contralateral control regions with a sensitivity of 0.56 and specificity of 0.95.
Mean initial perfusion values at day 0
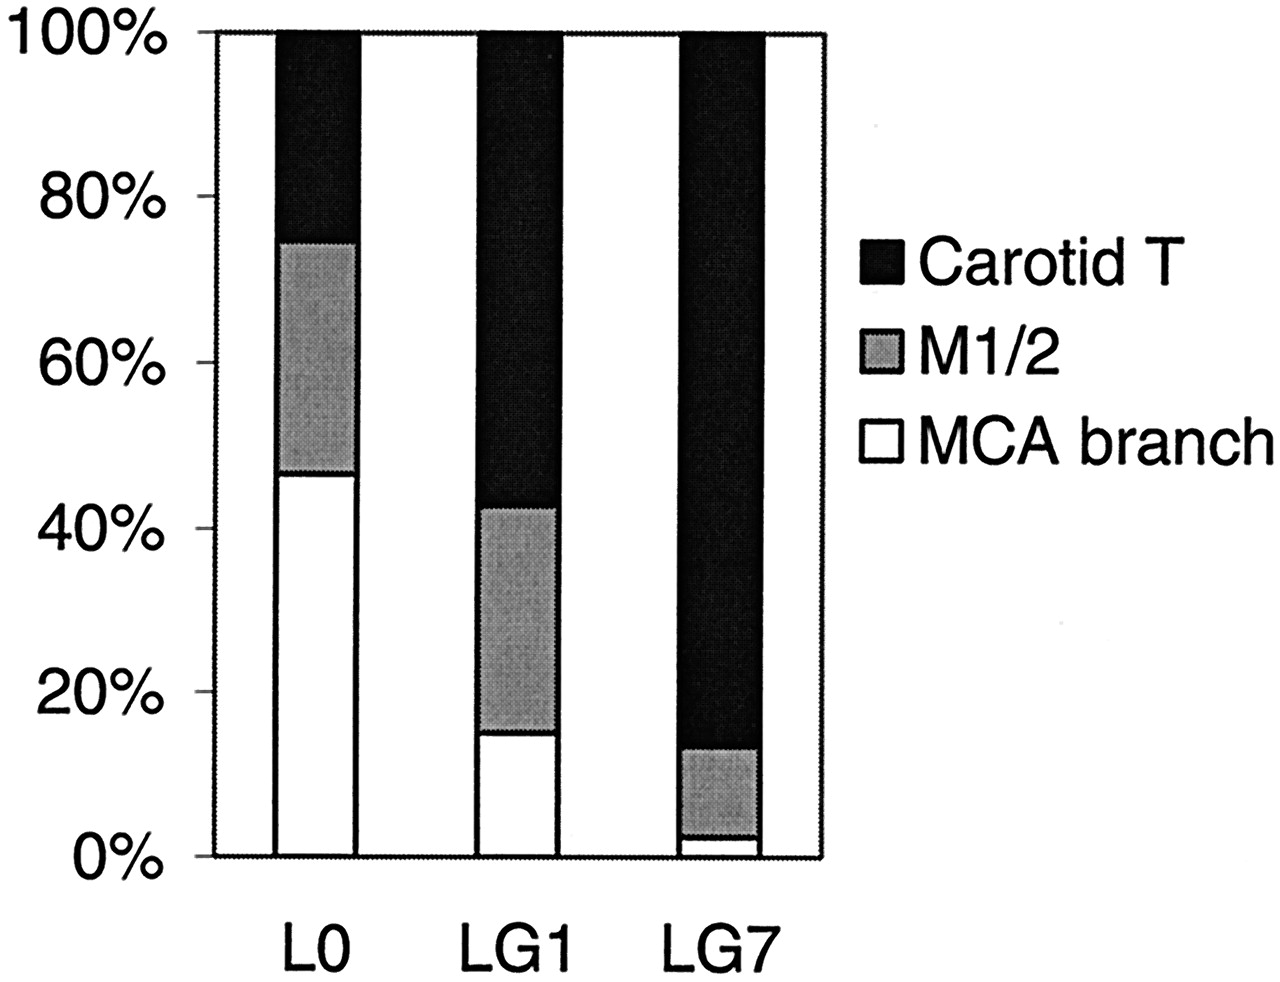
Comparing the three most frequent occlusion types, lesion growth was larger in CTO than in M1/2 occlusions or MCA branch occlusions (Table 1, Fig 2), with the most prominent increase in CTO until day 7 (P < .01). Although the initial lesion volume in MCA branch occlusion was largest, lesion growth was very small in these peripheral occlusions despite failed recanalization at least at day 1.

Relative contribution of the three most frequent occlusion types to the total lesion volumes at day 0 (L0) or lesion growth LG1 and LG7. 100% is the sum of the lesions volumes of the three occlusion types.
Discussion
We determined initial lesion volumes and relative perfusion impairment on MR imaging at initial presentation of acute stroke patients. Because none of these patients showed recanalization at least up to day 1, reperfusion and salvage of severely hypoperfused tissue in the penumbra should not have occurred and tissue at risk should be expected to progress to infarction. This is the only setting in which an analysis of perfusion thresholds in the penumbra zone is valid and will not be confounded by recanalization. The most important question to be answered is whether a perfusion threshold exists between still viable tissue threatened to progress to infarction and surviving tissue. This perfusion threshold would define the real, potentially salvageable tissue and is equivalent to the threshold between LG7 and ST7.
The severity of hypoperfusion decreased from the center of the lesion defined by initial ADC decrease (L0) to the penumbra zone (LG1 and LG7) and finally to surviving tissue in all relative values of CBF, CBV, MTT, and TTP. This is consistent with pathophysiologic assumptions and the penumbra concept (4, 15). A considerable overlap exists in all perfusion values, and only rCBV was found to differentiate between LG7 and ST7. A CBV threshold was estimated with a moderate sensitivity for detecting surviving tissue beyond a CBV of 0.82 compared with contralateral control values, but with a high specificity for infarction below 0.82. This supports the clinical observation of frequent lesion growth in patients without recanalization and definite infarction of regions with visible CBV reduction (6). The slight increase of rCBV in ST7 results from an CBV increase in oligemic regions of the affected arterial territory due to leptomeningeal collateral flow (16) and vasodilatation (4, 17, 18).
Our results are not comparable to previous studies, because of inclusion of patients with failed recanalization only. Similar perfusion values within regions of initial diffusion restriction (L0) (4, 19) or regions progressing to infarction (LG1 and LG7) were, however, reported (5, 20–24). Contrary to our results, some recent studies found rCBF thresholds (20) and MTT (21) more useful to differentiate between tissue progressing to infarction and surviving tissue. In both studies, no spatial normalization of initial and follow-up imaging into a standardized 3D space was performed, also correcting for asymmetrical brain morphology. More importantly, previous studies did not consider whether recanalization had occurred and the time point of imaging was later (20) or the outer rim of hypoperfused tissue was defined by the MTT (20, 21), which is known to overestimate penumbral tissue (25, 26). Because differences also exist in patient inclusion criteria, time points of MR imaging, therapy, and methodology of image data evaluation, a generally accepted consent on perfusion thresholds is not in sight. Regions of visible CBV reduction predict the final infarct with high specificity, but sensitivity for lesion growth may be low, resulting in misinterpretation and underestimation of the final infarct. By contrast, the time parameters TTP and MTT bear the risk of frequent overestimation. Therefore, we suggest outlining perfusion lesions on CBF images until further refinements of the singular value decomposition have been evaluated (25).
Although the assessment of hypoperfused tissue by CBF was more conservative compared with others who used perfusion time parameters MTT or TTP (5, 21, 27), we found a large volume of initially hypoperfused tissue not progressing to infarction. In line with previous findings (16), lesion growth was dependent on the site of the vessel occlusion (27), with the greatest progression in CTO until day 1 and especially day 7. Because M1/2 occlusions experienced moderate progression until day 1, the lesion growth in MCA branch occlusions was very small (28) even though they showed the largest initial ADC lesion. Obviously, the penumbra defined by ADC decrease (as the core lesion) and CBF reduction (the outer border) is very small in branch occlusions, but is this simple penumbra concept valuable? Studies on the normalization of ADC indicate the salvage of even severe ADC decrease (13), especially in more distal occlusions in case of recanalization at early time points (29). Thrombolysis should not be withheld in patients with MCA branch occlusions even if there is no PWI/DWI mismatch, because there might be a chance of ADC recovery. Nevertheless, our results indicate that the penumbra is very large in CTO and may persist for a period of days, so more-aggressive approaches to recanalize CTOs are necessary, because thrombolysis is often ineffective (16, 30, 31). Decision making and further evaluation of penumbral thresholds need to consider the vessel status, because routine brain parenchymal imaging by CT (early signs of ischemia) or MR imaging (PWI/DWI mismatch) alone may not be sufficient.
Some limitations of the present study must be discussed. First, the number of patients included is low, especially after differentiation of occlusion types, although 189 candidates for thrombolysis have been screened by MR imaging within 6 hours of the onset of symptoms. Persisting occlusion without any region of reperfusion on follow-up imaging was rare. This led to the inclusion of patients showing recanalization until day 7, which may have influenced LG7 perfusion values at day 0. On the other hand, the volume of infarct growth between day 1 and 7 (LG7) was relative small and independent from recanalization. Recanalization at day 7 was improper to influence initial perfusion values at day 0 directly. Furthermore, only insignificant differences in recanalization rates were found between the occlusion types (Table 1) and the larger LG7 volume in CTO could not be attributed to less frequent recanalization. Second, one may argue that lesion growth may be dependent on anatomic prerequisites with more proximal occlusions naturally supplying a greater territory; however, relative lesion growth LG1 + LG7/L0 + ST7 was also different: CTO, 42.8%; M1/2, 12.1%; and MCA branch, 14.9%.
Conclusion
Perfusion thresholds of the real penumbra are difficult to determine on initial MR imaging and only reduced CBV was found to be highly specific for final infarction. If recanalization fails, the occlusion type is predictive of lesion growth and is an important variable for therapeutic conclusions. More aggressive treatment regimens such as mechanical clot retrieval or fragmentation may be considered in selected cases of carotid T occlusions beyond the accepted time limits of 3 hours and when the actual ADC lesion volume is still small.
Acknowledgments
We are grateful for the helpful discussions with our partners within the Kompetenznetzwerk Schlaganfall, sponsored by the Bundesministerium für Bildung und Forschung (grant B5; Nr. 01GI9902/4).
Footnotes
Presented at the 14th European Stroke Conference, Mannheim, Germany, May 12–15, 2004.
R.K. supported by the Bundesministerium für Bildung und Forschung (grant Nr. 01GI9902/4).
References
- Received June 20, 2004.
- Accepted after revision August 30, 2004.
- American Society of Neuroradiology
In this issue


Jump to section
Related Articles
Cited By...
- Infarct Volume Is a Pivotal Biomarker After Intra-Arterial Stroke Therapy
- CT Perfusion Mean Transit Time Maps Optimally Distinguish Benign Oligemia from True "At-Risk" Ischemic Penumbra, but Thresholds Vary by Postprocessing Technique
- Recommendations for Imaging of Acute Ischemic Stroke: A Scientific Statement From the American Heart Association
- Comparison of 10 Perfusion MRI Parameters in 97 Sub-6-Hour Stroke Patients Using Voxel-Based Receiver Operating Characteristics Analysis
- Blood Oxygen Level-Dependent MRI Allows Metabolic Description of Tissue at Risk in Acute Stroke Patients
- Identification of Penumbra and Infarct in Acute Ischemic Stroke Using Computed Tomography Perfusion-Derived Blood Flow and Blood Volume Measurements