Abstract
BACKGROUND AND PURPOSE: Multiple studies have demonstrated evidence of sex differences in patients with MS, including differences in disease progression, cognitive decline, and biologic markers. This study used functional connectivity MRI to investigate sex differences in the strength of functional connectivity of the default mode network in patients with MS and healthy control subjects.
MATERIALS AND METHODS: A total of 16 men and 16 women with MS and 32 age- and sex-matched healthy control subjects underwent a whole-brain resting-state functional connectivity MRI scan. A group-based seed in the posterior cingulate was used to create whole-brain correlation maps. A 2 × 2 ANOVA was used to assess whether disease status and sex affected the strength of connectivity to the posterior cingulate.
RESULTS: Patients with MS showed significantly stronger connectivity from the posterior cingulate to the bilateral medial frontal gyri, the left ventral anterior cingulate, the right putamen, and the left middle temporal gyrus (P < .0005). In the left dorsal lateral prefrontal cortex, female patients showed significantly stronger connectivity to the posterior cingulate cortex compared with female control subjects (P = 3 × 10⁴), and male control subjects showed stronger posterior cingulate cortex–left dorsal lateral prefrontal cortex connectivity in comparison to female control subjects (P = .002). Male patients showed significantly weaker connectivity to the caudate compared with female patients (P = .004).
CONCLUSIONS: Disease status and sex interact to produce differences in the strength of functional connectivity from the posterior cingulate to the caudate and the left dorsal lateral prefrontal cortex.
ABBREVIATIONS:
- ACC
- anterior cingulate cortex
- DMN
- default mode network
- fcMRI
- functional connectivity MRI
- DLPFC
- dorsal lateral prefrontal cortex
- MNI
- Montreal Neurological Institute
- PCC
- posterior cingulate cortex
There have been numerous reports of sex differences in patients with the neurodegenerative disorder MS. It has long been known that women are more likely to have MS than men, and recent reports have found a widening sex gap in diagnosis.1⇓–3 Although sex has a less dramatic effect on disease progression and clinical outcomes, several studies have reported more severe symptoms and faster progression in men.4⇓⇓–7 The underlying processes thought to be involved in the development and progression of MS demonstrate significant sex differences. For example, male and female patients with MS have shown differences in the markers of autoimmune function,8⇓–10 and there has been extensive research on the effects of sex hormones on disease progression, particularly during and after pregnancy.11,12 There is evidence that fluctuations in hormone levels can affect tissue damage in the brain13; these observations have prompted research on the use of sex hormones as a treatment for MS.14,15 It is unclear, however, whether there are sex differences in conventional MR imaging measures of disease status. One review concluded that sex does not appear to affect conventional MR imaging measures,16 whereas other research has found increased gray matter atrophy and decreased development of T2-weighted lesions in men and increased white matter atrophy in women.17⇓–19 Recently, sex differences in expression levels of markers involved in demyelination were found in an animal model of MS.20
The measure of low-frequency blood oxygen level–dependent signal fluctuations in a patient at rest, referred to as resting-state functional connectivity MRI (fcMRI), is thought to capture information about intrinsic functional networks in the brain.21 Patients with MS show differences in both the pattern and magnitude of fcMRI values, and there is some indication that these changes are related to the level of disease burden and cognitive deficits.20,22⇓⇓⇓–26 In particular, connectivity between the posterior cingulate and other structures in the default mode network has shown a relationship with cognition.23,27
It is unclear whether fcMRI values are affected by sex. One study found no differences between men and women in a sample of more than 600 participants,28 whereas another study in a similar sample found higher fcMRI values in the default mode network, the left inferior frontal gyrus, and bilateral basal ganglia in women and higher fcMRI values in motor and sensory networks in men.29 Other studies have found higher fcMRI values in the parietal, insular, and occipital regions in men; higher connectivity in the frontal and temporal regions, posterior cingulate, and parietal lobe in women; greater hemispheric asymmetry in men; and higher overall internetwork connectivity in men.29⇓⇓⇓–33
Two studies have specifically assessed the effect of sex on fcMRI values in patients with MS. In a study that used synchronization likelihood and graph analysis, healthy men showed significantly higher synchronization and network efficiency when compared with healthy women, whereas men with MS had lower synchronization levels and reduced network efficiency compared with healthy men.34 In contrast, Schoonheim et al25 found higher synchronization in men with MS compared with healthy men when these factors were assessed with magnetoencephalography.
The default mode network (DMN) is a well-characterized resting-state network, comprising portions of the anterior (ACC) and posterior cingulate (PCC), precuneus, inferior parietal lobules, and prefrontal cortex.35 Although the DMN is most active during a “resting” state, many studies have shown a relationship between DMN characteristics, cognitive performance, and disease status.23,26,36 Compared with control subjects, patients with MS show decreases in DMN connectivity in the left medial prefrontal cortex, left precentral gyrus, right inferior frontal gyrus, left inferior temporal gyrus, and the ACC.23,26,37 The ACC and left medial prefrontal cortex have shown a relationship with cognitive performance in MS, with better performance leading to increased DMN activity.26 Several regions have shown increased DMN connectivity in patients with MS, including the right inferior parietal lobule and the lateral regions of the PCC.23 Although the DMN has shown a clear relationship to disease status in MS, to date no studies have examined sex differences.
In the present study, we used a seed-based approach to assess sex differences among patients with MS and control subjects in fcMRI of the whole brain to the posterior cingulate, a primary node in the DMN. A seed-based approach allows investigation of the DMN while also allowing investigation of peripherally related regions that may be involved in disease processes. We also considered the relationships among cognitive function, sex, and functional connectivity in MS. We found regional variations in the strength of connectivity to the PCC in patients with MS, and we found sex- and disease-status interactions in connectivity to the right caudate and left dorsal lateral prefrontal cortex (DLPFC).
Materials and Methods
From a larger dataset of patients with MS and control subjects, on the basis of being able to make an age- and sex-matched subsample, we selected 32 patients with MS and 32 healthy control subjects. Participants with MS were diagnosed by use of the International Panel Criteria for MS, with the diagnosis confirmed by a neurologist at the time of participation.38 There were equal numbers of men and women in both samples (Table 1). All study participants were scanned by use of a 12-channel receive-only head coil on a Trio 3T scanner (Siemens, Erlangen, Germany). All participants used a bite bar during the scanning session to restrict head motion. After informed consent was given, the study participants were scanned in a single session by use of the following Cleveland Clinic Institutional Review Board–approved protocol:
Demographic information
Scan 1: Whole-brain T1 MPRAGE: 120 axial sections; thickness, 1.2 mm; FOV 256 × 256 mm; TI/TE/TR/flip angle, 900/1.71/1900 ms/8°; matrix, 256 × 128; band width, 62 kHz.
Scan 2: Whole-brain resting-state fcMRI study, with eyes closed: 132 repetitions of 31 4-mm-thick axial sections (no gap); matrix, 128 × 128; in-plane resolution, 2 × 2 mm; TE/TR/flip angle, 29/2800 ms/80°; FOV, 256 × 256 mm2; band width, 1954 Hz/pixel.
Image Postprocessing
Functional connectivity data were postprocessed as follows: Cardiac and respiratory fluctuations, measured duringscanning, were regressed out at the voxel level with the use of RETROICOR.39 Data were retrospectively motion-corrected by use of the AFNI (http://afni.nimh.nih.gov/afni/) program 3dvolreg, and output from 3dvolreg was used to identify and regress signal fluctuations that corresponded to voxel-level displacement.40 Data were spatially filtered with a Hamming filter, temporally filtered to remove fluctuations >0.08 Hz, and smoothed by use of the AFNI program 3dmerge with a 6-mm kernel.40
Volumetric Analysis
Tissue volume was estimated with the FSL (http://www.fmrib.ox.ac.uk/fsl) program SIENAX.41,42 With the use of the T1 volume, SIENAX first applies an affine registration to Montreal Neurological Institute (MNI) 152 space to obtain a volumetric scaling factor.43,44 Total gray matter, white matter, and CSF are calculated by means of tissue segmentation and are then normalized for head size by means of the scaling factor.45 Segmentation maps were visually inspected to ensure accuracy, and a 2-way ANOVA and Tukey honest significance test were used to calculate between-group differences for gray and white matter volumes.46
Image Analysis
The AFNI tool InstaCorr was used to identify a seed for fcMRI analysis.47 This tool can be used to create individual fcMRI maps on the basis of a given seed voxel and can determine how strongly voxels are related to an fcMRI network of interest. In the current study, a subset of 15 patients and 15 matched control subjects was used in a preliminary analysis to identify the midline PCC region of interest. For each of the 30 participants, InstaCorr was used to manually select the posterior cingulate voxel that had the highest correlation with traditional DMN regions, including the ACC, inferior parietal lobules, and medial prefrontal cortex. One-voxel PCC ROIs in native space were aligned to the anatomic volume by use of the AFNI program align_epi_anat.py,48 and were then transferred to common space by use of a 12-degree of freedom affine coregistration to the MNI template.49 Through manual inspection, it was determined that the spatial variation in MNI space was small enough across all 30 participants to justify generalizing a group-based region of interest to the entire sample of 32 patients and 32 control subjects. It was verified that a 4-mm diameter sphere at [1 −43 16] was sufficient to encompass the location of the PCC region of interest in all 30 of the tested participants. The 4-mm diameter sphere represents an estimate of the location of the PCC node of the default mode network and served as our fcMRI seed for the remainder of the analysis.
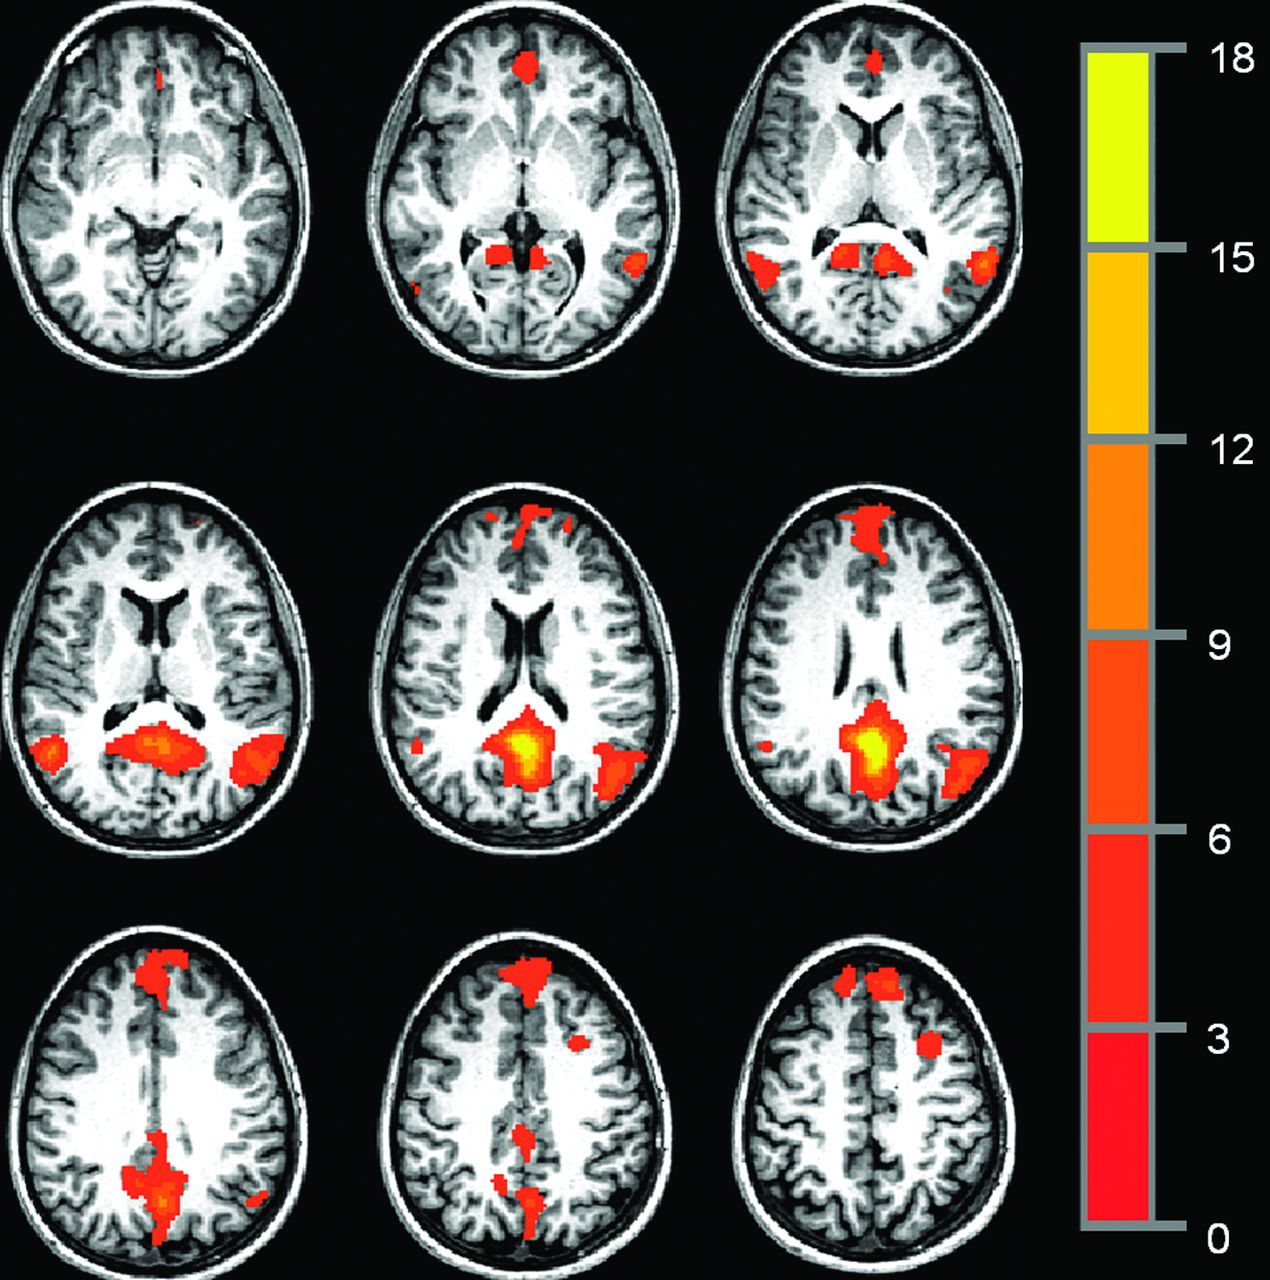
To avoid issues of resampling, PCC functional connectivity maps were created in native space. The group-based PCC ROI was warped into native space for each of the 64 participants and manually inspected to ensure that the transformation to native space resulted in placement of the ROI within the PCC. Any voxels included in the ROI that were not within PCC were excluded from the analysis. Through the use of Matlab (MathWorks, Natick, Massachusetts), a resting-state reference time-series was produced by taking the linearly detrended average time-series of all voxels in the PCC ROI, and a cross-correlation was calculated between the reference time-series and the linearly detrended resting-state time-series on a voxel-by-voxel basis.46 The correlation was converted to a Student t, and the distribution was then normalized to unit variance and zero mean.50 The resulting map indicates the strength of connection to the reference time-series in the PCC ROI. Fig 1 shows a representative single-participant PCC functional connectivity map, thresholded at P = .0005, with a cluster size of 36, for an effective voxelwise P of 1 × 10⁻⁷.

Representative single-participant PCC functional connectivity map, thresholded at P = .005, cluster size = 36, for an effective voxelwise P of 1 × 10⁻⁷.
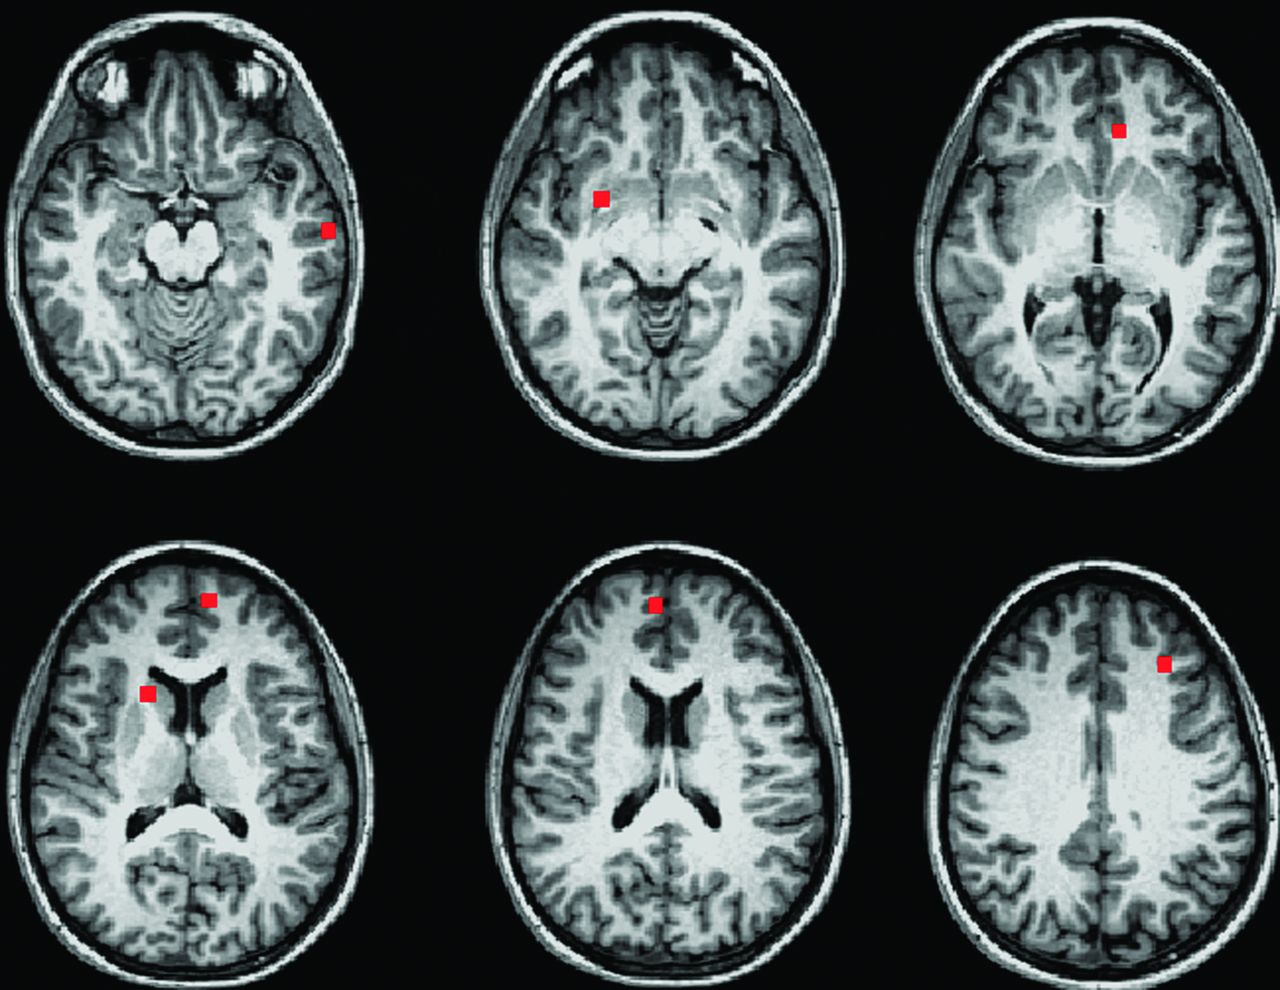
Participants were then divided into 4 age-matched groups: male control subjects, female control subjects, male patients, and female patients (Table 1). Connectivity maps from the 32 patients and their matched healthy control subjects were transferred to MNI space and entered into a 2-way ANOVA by use of the AFNI program 3danova2.40 The categories for the ANOVA were sex and disease status. The resulting maps were thresholded at P = .01 with a cluster size of 74, for an effective voxelwise P of 1 × 10⁻⁵. In MNI space, a 9-voxel in-plane ROI was centered at the voxel of highest significance for each region identified in the ANOVA (Fig 2). To obtain individual subject fcMRI measures for post hoc analysis, ROIs for regions identified in the ANOVA were transferred to native space, aligned to the PCC fcMRI map, and visually inspected to ensure placement within the structure of interest. The mean values of connectivity to the PCC in significant ROIs were compared in a post hoc analysis by use of paired Student t tests and Tukey range test for correction of multiple comparisons.46

Nine-voxel in-plane ROIs centered at the voxel of highest significance for each region showing significant group differences in a 2-way ANOVA (P = 1 × 10⁻⁵).
Behavioral Data
All participants completed 5 cognitive tests, with the exception of 4 male control subjects. These 4 male control subjects were included in the fcMRI analysis but were not included in the cognitive performance/fcMRI comparison because of missing cognitive test data. The tests included measures of verbal and spatial memory (the California Verbal Learning Test-II and the Brief Visuospatial Memory Test-Revised), speed of processing and sustained attention (the Paced Auditory Serial Addition Test, 3 second administration and the oral version of the Symbol Digit Modalities Test), and verbal fluency (the Controlled Word Association Test). In addition, all participants were rated by a trained clinician on the Expanded Disability Status Scale.51
Results
Demographics
Thirty-two patients with MS and 32 healthy control subjects were divided into 4 age-matched groups on the basis of sex (Table 1). Groups showed no differences in age or education, and the male and female patient groups showed no differences in Expanded Disability Status Scale or disease duration.
Behavioral Data
For each test, all study patients scored within 2 standard deviations of the mean performance of healthy control subjects. Raw score mean and standard deviation for each test are reported in Table 1. For group comparisons and correlation with imaging measures, cognitive measures were corrected on the basis of available norms. Both California Verbal Learning Test-II and Brief Visuospatial Memory Test-Revised total recall scores were converted to t-scores on the basis of age-corrected norms.52,53 Raw scores for the oral Symbol Digit Modalities Test and the Controlled Word Association Test were converted to z-scores by means of norms corrected for age and level of education.54,55 Paced Auditory Serial Addition Test raw scores were converted to z-scores by means of norms corrected for level of education.56
Unpaired Student t tests were used to compare cognitive performance. No significant differences in cognitive performance were found between patients and control subjects or between sexes.
Volumetric Analysis
In a 2-way ANOVA, white matter differences were significant in both the disease and sex conditions, with no significant interaction effect. Although patients showed lower white matter volume as compared with control subjects (P = 9 × 10⁻⁴), when all female participants (patient and control) were compared with all male participants, female participants showed significantly less white matter overall (P = 1 × 10⁻⁴). The difference in white matter volume between sexes was greater in control subjects (P = 6 × 10⁻⁴) than in patients (P = .033). The opposite pattern emerged for gray matter. In the 2-way ANOVA, gray matter showed significance only in the sex condition (P = 3 × 10⁻³), in which female participants showed higher gray matter volume as compared with male participants. The difference between sexes was of similar magnitude in control subjects (P = .035) and patients (P = .017).
Motion
All functional connectivity datasets were assessed for motion by use of mean peak-to-peak displacement. Participants with a mean peak-to-peak displacement >0.4 mm were flagged for visual inspection of the fcMRI time-series and subsequent correlation maps. Data from 3 patients and 3 control subjects were flagged for inspection. No evidence of motion-related artifact, including rings of correlation around the outside of the head, correlation in the ventricles, and rapid correlation pattern changes from section to section (a consequence of motion in an interleaved style acquisition), was found. On the basis of these criteria, no participants were excluded because of motion. No significant differences in motion characteristics were found between patients and control subjects or between sexes (Table 1).
Functional Connectivity
The voxelwise 2-way ANOVA showed significant differences in strength of connectivity to the PCC between patients and control subjects in the bilateral medial frontal gyri, the left ventral anterior cingulate, the right putamen, and the left middle temporal gyrus (P < 1 × 10⁻⁵). Analysis of the sex/disease status interaction demonstrated a significant difference between groups in the right caudate (P = 4 × 10⁻⁴) and the left middle frontal gyrus (specifically the left DLPFC) (P = 2 × 10⁻⁴). There were no significant differences between regions on the basis of sex alone.
In the post hoc comparison, the bilateral medial frontal gyri, left ventral anterior cingulate, right putamen, and left middle temporal gyrus showed significant differences between the full patient and control groups (P < 5 × 10⁻⁴) (Table 2). The right caudate and left DLPFC showed a disease status/sex interaction effect (Fig 3). These regions were compared by use of 4 t tests: 1) female patient versus female control; 2) male patient versus male control; 3) male patient versus female patient; and 4) male control versus female control. In the right caudate, male patients showed significantly weaker connectivity to the PCC compared with female patients (P = .004). In the left DLPFC, female patients showed significantly stronger connectivity to the PCC compared with female control subjects (P = 3 × 10⁴). Control subjects also showed a significant difference, with male subjects showing stronger PCC–left DLPFC connectivity in comparison with female subjects (P = .002).
Mean fcMRI values for MS and healthy control groups, by sex

Mean functional connectivity to the PCC for regions that showed a sex-disease status.
To rule out caudate atrophy as a cause of between-sex differences, we used the FreeSurfer image analysis suite (http://surfer.nmr.mgh.harvard.edu) to automatically segment the right and left caudate.57,58 After manual inspection for accuracy, caudate volumes were corrected for head size and a 2-way ANOVA was used to compare volumes among the 4 groups. Disease status showed a significant effect on the left side only, with patients showing significantly smaller volumes than control subjects (P = .327). Neither right nor left caudate volume correlated with connectivity measures.
In regions that showed differences between the patient and control groups, connectivity was compared with overall gray and white matter volume by use of a Pearson correlation. Connectivity values did not correlate with overall gray or white matter volumes in the control group. In patients, overall gray matter volume was positively associated with increased connectivity between the PCC and the left middle temporal gyrus (r = −0.5297, P = .001). There were no correlations between fcMRI and cognition in any of the groups, and patients did not show correlations between connectivity measures and disease duration.
Discussion
The present study demonstrated that specific fcMRI differences between patients with MS and control subjects are influenced by sex and disease status. The bilateral medial frontal gyri, right putamen, left anterior cingulate, and left middle temporal gyrus appear to have clear patient/control effects in both sexes, whereas differences in the left middle frontal gyrus and the right caudate are dependent on sex interactions.
In the present study, sex effects were most obvious in the left DLPFC and the right caudate. Although the levels of connectivity were low overall, the patterns of connectivity were opposite for male/female control subjects and patients in both regions. In the caudate, sex differences were significant in patients but not in healthy control subjects. The caudate is a frequent site of gray matter atrophy in MS,59 and there is some indication that men experience a greater level of gray matter atrophy.17 Although we did find that patients had a decrease in left caudate volume, we did not find that caudate volumes differed by sex. Both this finding and the use of a small, targeted ROI, manually inspected for placement, greatly diminish potential effects of atrophy and partial voluming on fcMRI measures.
Female control subjects and female patients had a significant difference in fcMRI values in the left DLPFC; this area was also the only region to demonstrate sex differences in connectivity between healthy control subjects. Previous studies have found that atrophy in the DLPFC may be linked to cognitive decline and alterations in functional activation in MS.60⇓–62 In our study, increased connectivity to the DLPFC was seen in female patients only, with male patients showing a weaker connectivity similar to that of female control subjects. In contrast, male control subjects demonstrated stronger connectivity to the DLPFC than did female control subjects, with values similar to those of female patients. Although it is difficult to directly compare this finding to the results of previous studies of sex differences in fcMRI, our use of a seed-based region of interest in the PCC is similar to that of Biswal et al,32 whose work also found stronger connectivity to the left middle frontal gyrus in men.
We also found sex and disease effects in an analysis of white and gray matter volumes, corrected for head size. In patient and control groups, overall white matter volume was lower in women than in men, whereas overall gray matter volume was higher, a finding in line with a number of previous studies.63,64 Patients with MS showed lower white matter volume than that in control subjects but showed no difference in gray matter volumes. Both gray and white matter volume loss is a common finding in MS,65 though it has been suggested that gray matter loss is more closely associated with increased levels of disability.66 Although we did find that fcMRI of the PCC–left middle temporal gyrus was related to gray matter loss in patients, the finding of equivalent gray matter and the lack of correlations between cognition and fcMRI measures in patients may be the result of the lack of cognitive impairment in our patient group. In a study of control subjects and both cognitively preserved and cognitively impaired patients with MS, Bonavita et al23 found that patients showed lower connectivity in the anterior and midline posterior cingulate compared with healthy control subjects, with increased connectivity at the boundaries of the posterior cingulate and in parieto-occipital regions. The investigators also found a positive relationship between cognitive ability and fcMRI values in the anterior cingulate in cognitively preserved patients, whereas a negative relationship was observed between cognitive ability and fcMRI values in the PCC in cognitively impaired patients. These data and similar results from a study by Rocca et al26 suggest that a sample without cognitively impaired patients may not fully capture links between fcMRI and cognition. Although our population is not significantly impaired, we already see a number of changes in functional connectivity. Ideally, a longitudinal study of patients with MS could verify which imaging changes precede cognitive decline and which changes are the result of further disease progression.
The dataset used in the current study was small, and although male and female patients with MS were matched with control subjects for age, sex, education, and Expanded Disability Status Scale, lesion load or other measures of disability may have affected the results. A larger sample is necessary to further assess sex differences in MS and to clarify the relationships among sex, disease progression, cognitive decline, and potential imaging markers such as fcMRI.
Conclusions
Our results suggest that female and male patients with MS have differences in the strength of functional connectivity from the posterior cingulate to the caudate and the DLPFC. This finding builds on the growing evidence of sex differences in MS and should serve as a reminder that sex differences must be taken into account in MS research.
Acknowledgments
The authors thank John Cowan, Tami Gaebelein, Sarah Gallucci, Blessy Mathews, Katie Murphy, and Derrek Tew for their contributions to this work.
Footnotes
Disclosures: Katherine Koenig—RELATED: Grant: National Multiple Sclerosis Society,* NIH,* Comments: NMSS RG 4110-A-two “fMRI & DTI Evaluation of Hippocampal Damage and Episodic Memory Loss in MS”; NIH R01NS035058 “Pathogenesis of demyelination of MS Brains“; UNRELATED: Grants/Grants Pending: CHDI Foundation.* Mark Lowe—RELATED: Grant: National Multiple Sclerosis Society.* Jian Lin—UNRELATED: Grants/Grants Pending: NIH,* National Multiple Sclerosis Society,* Lincy Foundation.* Ken Sakaie—RELATED: Grant: National Institutes of Health,* National Multiple Sclerosis Society.* Robert Bermel—UNRELATED: Consultancy: Biogen Idec, Novartis, Teva Astellas, Questcor. Erik Beall—RELATED: Grant: “Enhancing the PESTICA Toolkit: Open-Source Physiologic Noise Detection and Removal” 1R03EB012968–01A1, PI, 25%*; “Functional MRI of Human Brain Language Systems” 2R01NS035929–10A1, Co-I, 10%*; Stephen Rao—UNRELATED: Consultancy: Novartis, Genzyme, Biogen Idec; Grants/Grants Pending: NIH,* CHDI Foundation,* DoD,* National MS Society*; Payment for Manuscript Preparation: Biogen Idec, Novartis; Royalties: American Psychological Association. Bruce Trapp—RELATED: Grant: NIH,* Comments: Pathogenesis in Demyelination of MS Brains R01NS035058; UNRELATED: Consultancy: Renovo Neural, Biogen Idec, Teva, Novartis Pharmaceuticals; Payment for Lectures (including service on speakers bureaus): EMD Serono. Michael Phillips—RELATED: Grant: National Multiple Sclerosis Society; Support for Travel to Meetings for the Study or Other Purposes: National Multiple Sclerosis Society*; UNRELATED: Grants/Grants Pending: National Multiple Sclerosis Society (*money paid to institution).
This work was supported by grants from the National Multiple Sclerosis Society and the National Institutes of Health (NS035058).
Indicates open access to non-subscribers at www.ajnr.org
REFERENCES
- 1.
- 2.
- 3.
- 4.
- 5.
- 6.
- 7.
- 8.
- 9.
- 10.
- 11.
- 12.
- 13.
- 14.
- 15.
- 16.
- 17.
- 18.
- 19.
- 20.
- 21.
- 22.
- 23.
- 24.
- 25.
- 26.
- 27.
- 28.
- 29.
- 30.
- 31.
- 32.
- 33.
- 34.
- 35.
- 36.
- 37.
- 38.
- 39.
- 40.
- 41.
- 42.
- 43.
- 44.
- 45.
- 46.
- 47.
- 48.
- 49.
- 50.
- 51.
- 52.
- 53.
- 54.
- 55.
- 56.
- 57.
- 58.
- 59.
- 60.
- 61.
- 62.
- 63.
- 64.
- 65.
- 66.
- Received December 17, 2012.
- Accepted after revision March 16, 2013.
- © 2013 by American Journal of Neuroradiology