Abstract
BACKGROUND AND PURPOSE: Alzheimer disease is the most common degenerative dementia affecting humans and mild cognitive impairment is considered the forerunner of this devastating illness with variable progression. Differentiating between them has become all the more essential with the advent of disease-modifying medications. The aim of this study was to test the utility of the entorhinal cortical atrophy score in combination with quantitative CBF in the posterior cingulate and precuneus using arterial spin-labeling to differentiate mild cognitive impairment and early Alzheimer disease.
MATERIALS AND METHODS: We analyzed MR imaging from a prospective data base of 3 age-matched groups: 21 cognitively healthy controls, 20 patients with mild cognitive impairment, and 19 patients with early Alzheimer disease. The highest entorhinal cortical atrophy score and an atlas-based measurement of CBF in the posterior cingulate and precuneus were estimated in these groups. Statistical comparison was performed among the groups for disease-prediction probability with these parameters independently and in combination using a binary logistic regression model.
RESULTS: The entorhinal cortical atrophy score performed well in distinguishing AD from HC, with a predicted probability of .887 (area under the curve, P < .001). The mean CBF of the posterior cingulate and precuneus was also found to be a useful discriminator (area under the curve, 0.810, P = < .001). Combining the entorhinal cortical atrophy score and CBF was the best predictor (area under the curve, 0.957, P < .001). In distinguishing mild cognitive impairment and Alzheimer disease, entorhinal cortical atrophy also did well with an area under the curve of 0.838 (P < .001). However regional CBF was not useful in differentiating them (area under the curve = 0.589, P = .339). Entorhinal cortical atrophy scored poorly in distinguishing mild cognitive impairment from healthy controls (AUC = 0.571, P = .493), but CBF fared well, with an area under the curve of 0.776 (P = .002).
CONCLUSIONS: Combining entorhinal cortical atrophy and regional CBF could be a potential imaging biomarker in distinguishing mild cognitive impairment and Alzheimer disease.
ABBREVIATIONS:
- ACE-M
- South Indian language of Malayalam version of Addenbrooke's Cognitive Examination
- AD
- Alzheimer disease
- ASL
- arterial spin-labeling
- ERICA
- entorhinal cortical atrophy
- HC
- healthy controls
- MCI
- mild cognitive impairment
- PCG
- posterior cingulate gyrus
- PC
- precuneus
- ROI
- region of interest
Alzheimer disease (AD) is the most common degenerative dementia affecting humans with marked socio-economic burden for care of the affected.1,2 Mild cognitive impairment (MCI) is considered the forerunner of this devastating illness with variable progression.3 With the advent of disease-modifying medications, early detection and classification of preclinical dementia have become essential. Exploration of possible biomarkers identifying individuals who are at high risk for developing AD is the focus of current research. Validated biomarkers for diagnosing MCI at risk of progression include Pittsburgh compound–based PET and CSF biomarkers, which are either not available in many centers worldwide or are prohibitively expensive.4 The relevance of validating instruments from widely available multimodality imaging techniques has been demonstrated by our group previously.5
Cerebral blood flow alterations in patients with AD and MCI have been identified as an important marker in understanding the neurophysiologic changes even before development of neuronal loss.6 Arterial spin-labeling (ASL) uses tagged arterial blood as an endogenous contrast for detecting regional CBF perfusion changes. Many recent studies have highlighted its role in imaging AD and MCI, in which different brain regions have been found to show hypo- or hyperperfusion.7⇓⇓⇓⇓⇓–13 ASL is a noninvasive MR perfusion technique, without the use of any ionizing radiation, intravenous contrast agents, or radioactive isotopes, and it is considered a potential alternative to FDG-PET imaging.14,15 Using ASL, many studies have consistently shown statistically significant hypoperfusion involving the posterior cingulate gyrus (PCG) and precuneus (PC), among many regions studied in MCI-AD.10,11,13 Only a few studies have correlated quantitative CBF with neuropsychology in AD and MCI.16 No consistent correlation has been established between CBF and gray matter volume changes in the corresponding regions in patients with AD and MCI in the existing literature.13
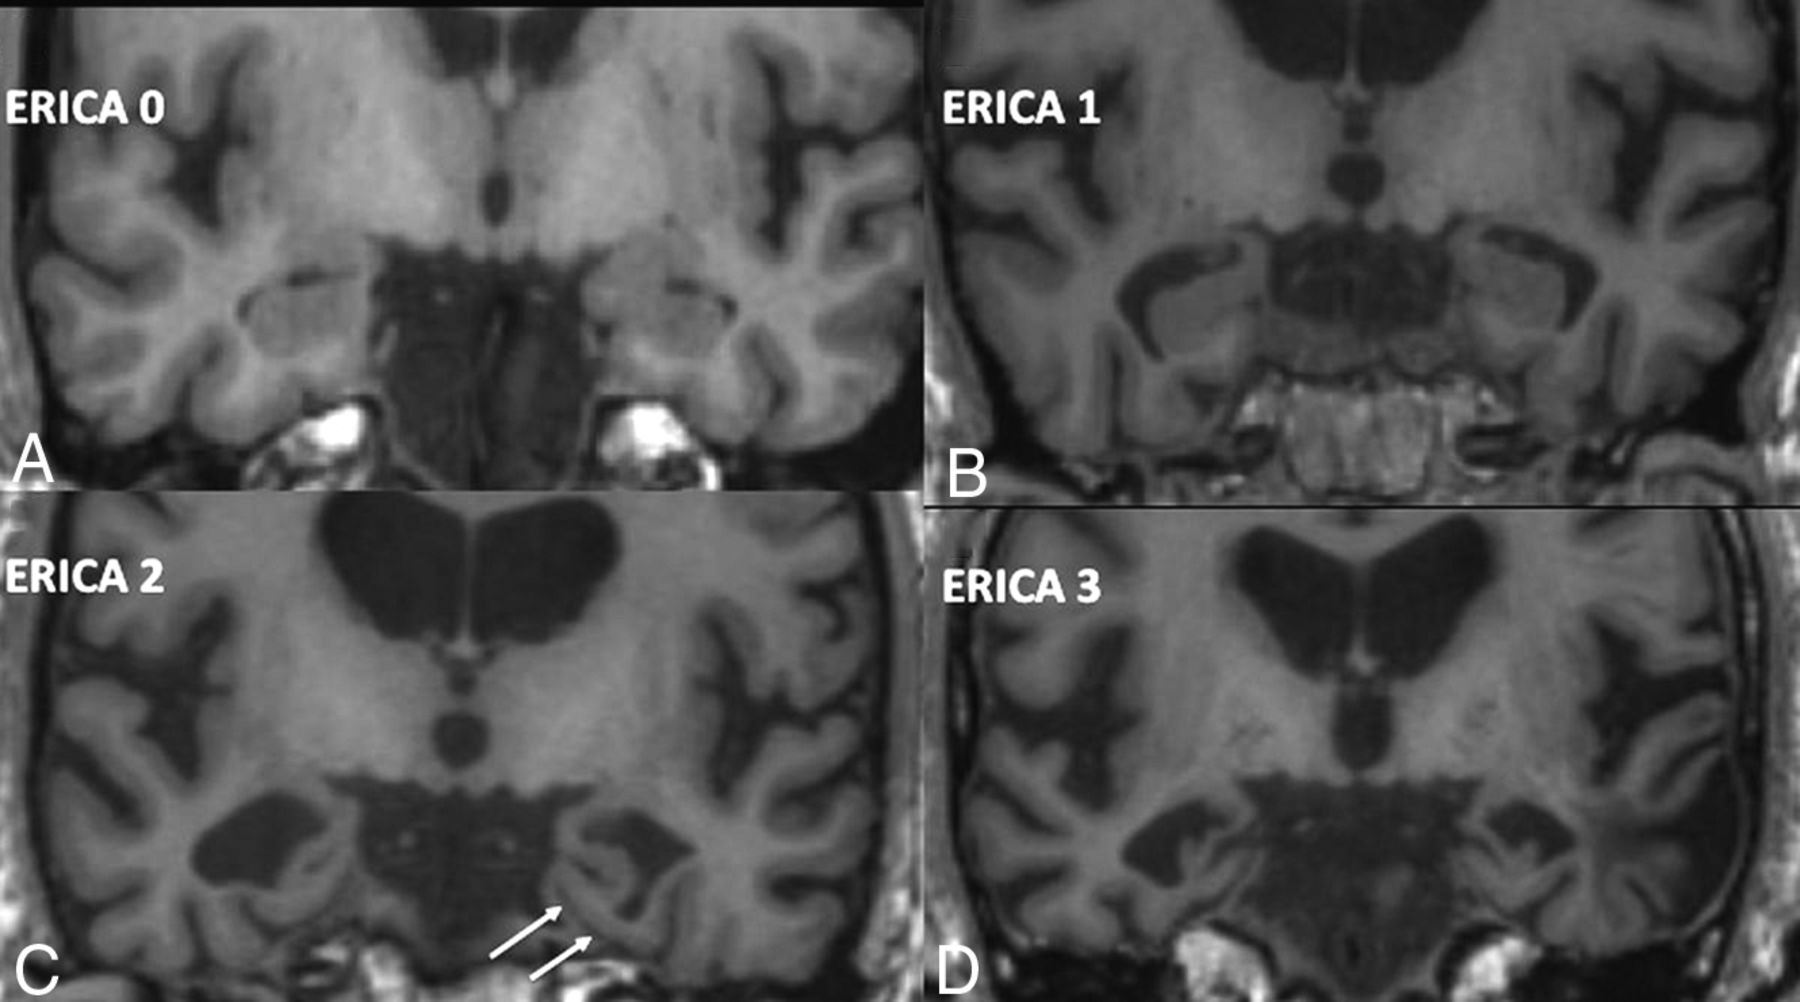
The entorhinal cortex has been shown to undergo graded atrophy in the MCI-AD complex and is thought to be one of the early areas of the brain that shows gray matter atrophy in AD.17 A recently described numeric atrophy scale of the entorhinal cortex (ERICA) score has been shown to correlate well with the cognitive changes and the diagnosis of AD.17 It has also been shown to be better than the previously described medial temporal lobe atrophy score in differentiating AD from subjectively reported cognitive impairment in patients.17 The ERICA score is a 4-point atrophy rating scale from 0 to 3, where 0 indicates no evidence for atrophy of the entorhinal cortex, and 3, marked atrophy (Fig 1). This was shown to be handy because the scoring system is very simple, but powerful enough to be used for the distinction of these conditions. However, this scoring system has not yet been validated by further studies.

ERICA scoring. A, Score 0 with no parahippocampal atrophy. B, Score 1 with mild atrophy with prominence of collateral sulcus. C, Score 2 with moderate entorhinal cortical atrophy with tentorial cleft sign (arrows). D, Score 3 with marked parahippocampal atrophy. Adapted from Enkirch et al.17
The aim of the present study was to test the hypothesis that the regional CBF changes measured in the posterior cingulate and precuneus (PCG + PC) region using the 3D fast spin-echo pseudocontinuous ASL sequence along with ERICA scoring of entorhinal cortical atrophy will be a better biomarker in differentiating patients with AD and MCI compared with healthy controls (HC).
MATERIALS AND METHODS
MR images from the data base of prospectively recruited consecutive subjects attending the Memory and Neurobehavioral Disorders Clinic of a tertiary referral teaching hospital in the South Indian state of Kerala, between 2016 and 2018, were included in this study. Age-matched control data were also collected during the period from the data base. Five subjects were excluded due to insufficient image quality. The final sample consisted of 21 controls, 20 patients with MCI, and 19 patients with AD. All subjects provided written consent according to procedures approved by the Institutional Ethics Committee of our institution. The diagnosis of MCI and AD was based on subjective cognitive symptoms verified by objective evidence of decline by a family member compared with the previous status and confirmed by evidence of a decline in ≥1 neuropsychological domain4 as shown below. Participants with a global cognitive assessment score, as determined on the vernacular version (in the South Indian language of Malayalam of Addenbrooke's Cognitive Examination [ACE-M]), between 88 and 100; a Clinical Dementia Rating score of 0; with formal education of >10 years; no subjective memory symptoms; and with no serious neurologic/psychiatric issues were selected as healthy controls.18,19 Participants with a Clinical Dementia Rating of <2 and an ACE-M score between 60 and 78 were confirmed as having AD according to standard National Institute of Neurological and Communicative Diseases and Stroke/Alzheimer's Disease and Related Disorders Association diagnostic criteria.20
Because we wanted to recruit patients with early AD who were largely independent for activities of daily living and capable of giving informed consent, we decided to include subjects with a Clinical Dementia Rating of only 0.5–1. Patients with MCI were diagnosed per the Modified Petersen Criteria with a Clinical Dementia Rating of ≤0.5 and an ACE-M score between 78 and 88 with evidence of impairment in ≥1 cognitive domain, defined as test performance on at least 2 tests (which also included the ACE-M subcomponent scores) for a given domain falling below a mean −1.5 SD of the normative scores for the corresponding age and education status.21 Exclusion criteria included the presence of a major neurologic disorder (stroke), medical comorbidities (cardiovascular, renal), and psychiatric illness (clinically significant anxiety and depression [Hospital Anxiety Depression Scale score should be <7], psychosis), similar to those in our previous study.19
Imaging Protocol
A 3T scanner (Discovery MR750w, GE Healthcare, Milwaukee, Wisconsin) with a 32-channel phased array head coil was used to acquire structural and ASL images. Structural images were obtained using a high-resolution 3D brain volume imaging sequence (3D-BRAVO) with the following parameters: TR/TE = 7/2.98 ms, section thickness = 1 mm, flip angle = 12°, matrix size = 256 × 256, and voxel size = 1 × 1 × 1 mm3. A 3D fast spin-echo pseudocontinuous ASL sequence was performed with the following acquisition parameters: TR/TE = 4852/10.70 ms, flip angle = 111°, voxel size = 1.875 × 1.875 × 4, section thickness = 4 mm, NEX = 3, and postlabel delay = 2025 ms.
Data Analysis
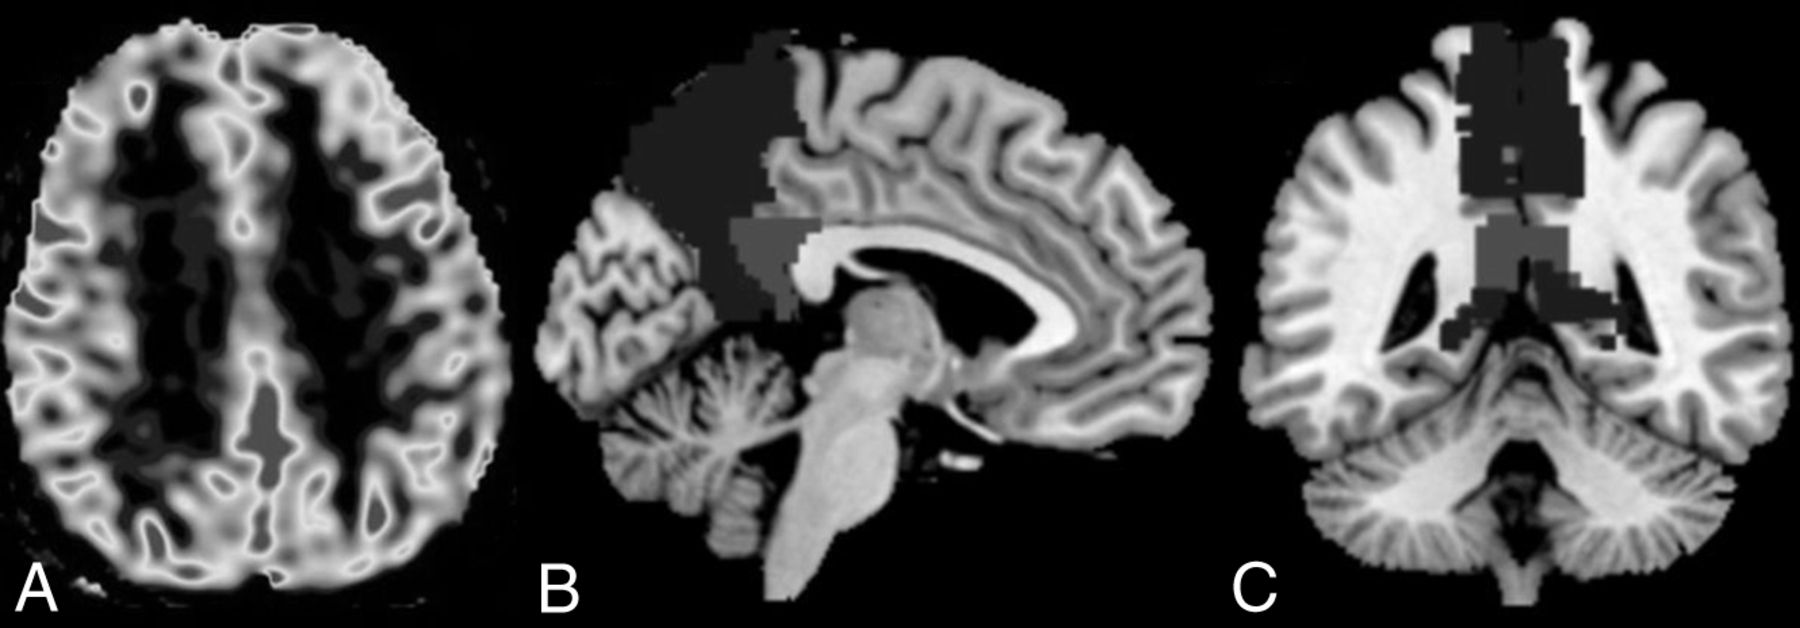
Structural and ASL data were processed using an off-line PC workstation. For ASL processing, quantitative CBF maps with values measured in units of milliliters/100 g/min in each subject were used. All the structural images and CBF maps were oriented in the anterior/posterior commissure line using Statistical Parameter Mapping software (SPM12; http://www.fil.ion.ucl.ac.uk/spm/download/spm12/). CBF maps of all the participants were then normalized to a standard stereotactic space and spatially smoothed with an 8-mm isotropic Gaussian kernel to improve the signal-to-noise ratio. Second-level statistical procedures implemented in SPM12 were used to analyze the CBF maps. The value of total intracranial volume was used as a covariate in the statistical design to correct variability among groups. Information on regional perfusion values was extracted by means of an ROI analysis. Anatomic ROIs for the posterior cingulate and precuneus were defined by means of the WFU PickAtlas tool (https://www.nitrc.org/projects/wfu_pickatlas/) (Fig 2). Regional CBF was estimated using parameter extraction with MarsBaR (https://www.nitrc.org/projects/marsbar/). Values within ROIs of both sides were then averaged and tabulated for HC, MCI, and AD groups.

A, Axial ASL CBF gray-scale map. B and C, Sagittal and coronal representative images, respectively, of the template for automated segmentation and extraction of posterior cingulate (light gray) and precuneus (dark gray) ASL CBF perfusion maps.
ERICA scoring was performed on coronally reformatted 3D-T1 BRAVO images in all subjects by 2 independent neuroradiologists (B.T. and S.K.) with 19 and 10 years of experience, respectively, at the level of the mamillary bodies as described by Enkirch et al.17 The interobserver agreement was calculated using Cohen κ statistics. Values on the right and left sides were tabulated, and the highest ERICA score in consensus in each subject was used for further analysis.
Statistical Analysis
The χ2 test was used for comparison of sex differences and vascular risk factors among groups (Table 1). The clinical differentiation scores are also summarized in the same table. For comparison of age, 1-way ANOVA was performed. The ERICA score and CBF measures in the ROI were used to derive the predicted probability of MCI and AD based on a binary logistic regression model. The derived measures were used for generating the receiver operating characteristic curves, and the area under the curve was used to compare them (Table 2 and Fig 3). Statistical analyses were performed using the software SPSS for Windows, Version 21.0 (IBM, Armonk, New York).
Demographic data, comorbidities, and clinical scores of subjects
Performance of the ERICA score and CBF of PCG + PC in predicting HC, MCI, and AD

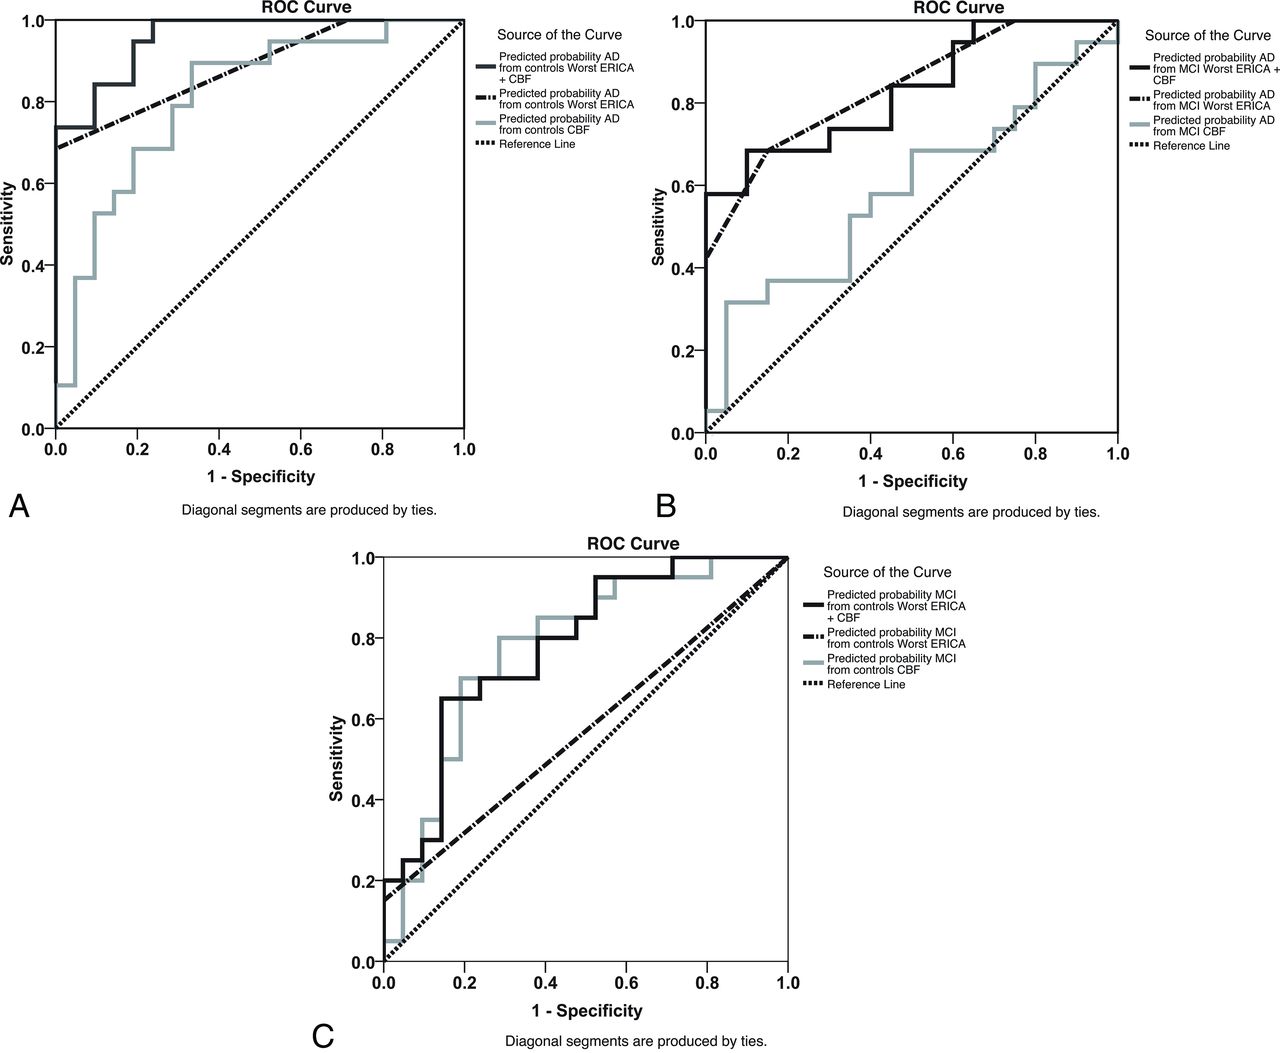
Receiver operating characteristic curves for predicted probability from ERICA (dot-dash lines) and regional CBF (light gray continuous lines) and a combination of both (black continuous lines). AD versus HC (A), AD versus MCI (B), MCI versus HC (C).
RESULTS
The demographics, clinical cognitive scores, and vascular risk factors of each group are summarized in Table 1. There was no significant difference in age, sex, or vascular risk factors among these 3 cohorts.
The average highest ERICA score was 0.71 ± 0.46 in HC, 0.90 ± 0.64 in MCI, and 2.15 ± 0.83 in AD. There was overall substantial interrater agreement for ERICA scoring (Cohen κ = 0.783 for the right side, 0. 777 for the left side, and 0.797 for the highest ERICA score). The mean CBF in PCG + PC was 46.64 ± 8.4, 39.08 ± 6.6, and 36.51 ± 8.4 mL/100/min in HC, MCI, and AD, respectively (Table 2).
Both ERICA scores and mean CBF were highly predictive of distinguishing AD from HC, with a predicted probability of 0.887 (P < .001) and 0.810 (P < .001), respectively. However, combining the ERICA score and mean CBF significantly increased the discriminatory power between AD and HC with the predicted probability of 0.957 (P < .001) (Fig 3A). While the ERICA score was found to be useful in distinguishing MCI from AD (predictive probability of 0.838, P < .001), regional mean CBF was not useful to differentiate these 2 groups (predictive probability of 0.589, P = .339). Marginal reduction of predictive probability (0.829, P < .001) was observed after a combination of ERICA scores and CBF without loss of discriminant ability (Fig 3B).
Significantly, the ERICA score was not found to be effective in distinguishing MCI from HC (predictive probability = 0.571, P = .493). On the contrary, regional CBF demonstrated a higher predictive probability of 0.776 (P = .002) to differentiate these groups. Combined ERICA scores and CBF maintained this predictive power, with a marginal increase of the predictive probability of 0.781 (P = .002). (Fig 3C).
DISCUSSION
ASL is a noninvasive technique for cerebral perfusion measurement using electromagnetically labeled arterial water as a diffusible tracer. Several ASL perfusion studies have highlighted regional hypo- and hyperperfusion in multiple areas of the brain in MCI-AD.7⇓⇓⇓⇓⇓–13 However, due to the variability of clinical subsets studied and the usage of nonreplicable sequences, these studies were not directly comparable.13 In the past, differences in technical implementation schemes and lack of standardized protocols hindered the routine use of ASL as a robust perfusion method in the clinical setting. International consensus guidelines have been developed recently for standardized ASL acquisitions.22 A 3D fast spin-echo pseudocontinuous ASL with a spiral readout is now generally considered the standard method of ASL in clinical research. In this study, we used a 3D fast spin-echo pseudocontinuous ASL technique on 3T MR imaging to investigate regional perfusion differences in patients with MCI and AD compared with HC. ROIs were extracted using atlas-based semiautomated techniques to avoid errors due to manual contouring.
Although several brain areas have been shown to be involved, one of the most consistent regions of hypoperfusion reported in MCI-AD is the PCG and anterior PC.10,11,13 Identification of hypoperfusion in the PCG + PC has been reported to have a sensitivity of 91% and a specificity of 80% for diagnosing AD.23 This method is in contrast to inclusion of a combination of different regions in subjects with amnestic and dysexecutive MCI, in which an accuracy of only 60%–70% was observed.24 From the existing literature, it is not clear whether the hypoperfusion is the cause or consequence of the disease process.25 In our study, the regional mean CBF in PCG + PC was 46.64, 39.08, and 36.51 mL/100/min in HC, MCI, and AD, respectively, and it performed well in distinguishing AD-HC and MCI-HC, but not between MCI and AD. This finding may be because the perfusion deficit in the PCG + PC occurs early in the course of this dementing illness spectrum, and this particular feature may be used as a reliable marker to delineate patients with MCI and AD from HC. However, from MCI to AD transformation, the perfusion reduction in these regions may be less remarkable and hence may not have significant diagnostic utility as a stand-alone measure.
There is no consistent correlation established between CBF and gray matter changes in the corresponding regions in patients with AD and MCI.13 In the initial stages of AD, changes such as intraneuronal alterations in the form of neurofibrillary tangles and neuropil threads are observed more frequently in the entorhinal cortex compared with hippocampus.26 This accumulation may be noted in other conditions, including normal aging, and when this is associated with neuronal loss, it leads to global cognitive decline. MR volumetric studies have also shown entorhinal cortex volume loss in dementia due to Alzheimer spectrum diseases.27,28 It has been shown in studies that in early stages of AD, certain areas such as the prefrontal cortex or medial temporal lobe structures would eventually have the ability to compensate for the cognitive decline.29 Simultaneously, perfusion deficits might also be present from the very early preclinical phases of AD, including MCI at risk of conversion, persisting into the advanced stages of the disease, demonstrating a progressive hypoperfusion with disease development, leading to brain atrophy and underlying neuronal loss that correlates with cognitive and functional decline.13 With regard to the pathophysiologic interpretation of the regional hypoperfusion consistently found in the PCG + PC, in comparison with ERICA, controversy exists about whether this is a cause or consequence of the disease process.25 It is well known that risk factors such as ischemic stroke, amyloid angiopathy, atherosclerosis, hypertension, diabetes, and cardiac disease are repeatedly implicated in the risk of MCI converting to AD.30 While AD and vascular dementia have traditionally been considered as independent entities, there is growing evidence implicating vascular pathology in AD to the extent of suggesting an overlap between AD and vascular dementia.31 Moreover, evidence from aging and stroke studies suggests that chronic brain hypoperfusion is the key pathophysiology that leads to neurodegeneration and consequent cognitive decline.25 Neuropsychologic correlations have also been established between perfusion measures in the parieto-occipital region and the parietal cortex along with the PCG + PC.32 Hypoperfusion may lead to changes in cortical thickness, as measured on structural MR imaging scans, in areas most vulnerable to aging (medial prefrontal and pericentral cortices) as well as in areas associated with amyloid aggregation (eg, occipitotemporal and basal temporal cortices), more so in apolipoprotein E4 carriers.33 Hence, there is the necessity to address disparate or nonconcordant topographic areas rather than looking at concordant brain volumes underlying areas of hypoperfusion while attempting to combine hypoperfusion and volumetric measures as with ERICA.
Compared with conventional MR imaging–medial temporal lobe atrophy scoring, which reported a sensitivity of 81% and a specificity of 67%, ERICA had a higher sensitivity of 83% and specificity of 98% in differentiating AD.17,34 ERICA is also easier to comprehend and score compared with the more complex medial temporal lobe atrophy score. It is also reliable and reproducible as confirmed in our study. The tentorial cleft sign (Fig 1C), which indicated an ERICA score of ≥2, had a high diagnostic accuracy for AD.17 In our study, the average ERICA score of patients with AD was 2.15. ERICA performed well in differentiating AD from MCI and AD from HC, but not MCI from HC. This performance may mean that significant parahippocampal atrophy does not happen early in MCI and probably is a much later occurrence compared with CBF reduction in PCG + PC in the course of progression of dementia. This hypothesis is further validated by the observations of neuropathology studies by Braak and Braak published in 1991.26
ASL hypoperfusion abnormality in PCG + PC and parahippocampal atrophy may be considered as complementary imaging biomarkers to distinguish MCI and AD. In our study combining the ERICA score with regional CBF in PCG + PC showed a promising trend to differentiate MCI, AD, and HC groups rather than individual parameters. However, MCI-AD is a more heterogeneous disease process, and not all patients with MCI are converters to AD.17 Further prospective studies are needed to validate the usefulness of combined ERICA and regional CBF in predicting this conversion. Although the pattern of results in MCI-HC comparison indicates better utility of CBF PCG + PC as opposed to the ERICA score, nosologically, there are important considerations while stratifying MCI at risk of AD using biomarkers. Per available criteria, to identify MCI at an intermediate or higher likelihood of AD requires combining biomarkers of -β amyloid accumulation (PET or CSF) with markers of neuronal injury (τ, FDG-PET, structural MR imaging).35 A combined instrument using 2 MR imaging markers of neuronal injury rather than -β amyloid accumulation precludes prediction of the proportion of the MCI cohort who are likely to convert in our series.
One also needs to consider that MCI is a heterogeneous condition and potentially could be due to other causes like vascular cognitive impairment. There is evidence in the literature available from MCI negative for β amyloid, where common etiologies include vascular diseases and depression.36 It is possible that a subset of our MCI cohort may, with time, evolve as vascular cognitive impairment or other alternative trajectories or may potentially remain stable without converting to AD. This possibility is perhaps part of the reason that the ERICA score did not show a significant difference between MCI and HC as opposed to the other 2 comparisons. Lack of longitudinal data to ascertain the trajectory of the MCI group with time precludes confirmation of the same in the present study and warrants future prospective follow-up studies. A relatively small sample size in our study also might have resulted in a lower ability to detect differences between MCI and AD using CBF alone at baseline. All these facts point to the relevance of including multiple MR imaging markers as implemented in one of our previous studies on multimodality neuroimaging.37
The study was performed on a prospectively acquired dataset with measurement of only 2 parameters, which could be easily reproduced in a clinical setting. We preferred to use computed segmentation of the ROI CBF to avoid any bias due to manual drawing of contours. However, this study had several limitations. Though ASL is a robust technique to measure cerebral perfusion, technical parameters and patient-specific factors could variably influence the CBF calculation and confound the results. Specific to dementia, one of the major confounders is the arterial transit time, which can be different for each subject due to associated vascular or nonvascular comorbidities. The possible vascular risk contributors like diabetes mellitus and hypertension were not considerably different in each subgroup in the present study (Table 1). Again, transit delay can be higher in some of the ROIs in dementia imaging like the posterior parietal lobes, leading to erroneous CBF measurements.38 The appropriately increased postlabeling delay time could be used to reduce this error. Alternatively, a multidelay ASL can potentially solve this problem, but it is not ready for prime time imaging yet. Also, a small sample size and cross-sectional study design did not permit analyzing a causal relationship between the biomarkers and the development of MCI and AD, and further large longitudinal studies are needed to confirm its role in predicting progression of the disease. Additionally, head-to-head comparisons between Pittsburgh compound PET imaging and CSF biomarkers (which are currently not available at our center) and MR imaging markers would have enabled us to ascertain the sensitivity and specificity; however, this comparison remains a concern across many centers in the developing world, and only multicentric collaborative ventures can transcend the issue.
CONCLUSIONS
This study explored the utility of measuring structural and perfusion changes in specific and nonoverlapping ROIs in differentiating MCI and AD. Combining regional perfusion measurements in the PCG + PC using ASL along with the ERICA score on structural imaging has the potential to be a better imaging biomarker to distinguish among Alzheimer spectrum disorders. In centers that do not have access to nuclear imaging scans including FDG Pittsburgh compound PET, this study has shown the utility of objective multimodal imaging scores to distinguish MCI at risk of progression to AD. This use of scores has the potential to serve as a noninvasive tool to stratify MCI etiologically, which is a heterogeneous entity in itself. Future studies are needed to explore the longitudinal risk of cognitive decline in MCI due to AD (using markers of amyloid accumulation) as opposed to MCI due to non-AD pathology, including vascular cognitive impairment, in direct correlation with ERICA and regional CBF measures. This categorization should also account for confounding factors such as age, education status, hypertension, coronary artery disease, body mass index, dyslipidemia, and impaired glucose tolerance in these groups.
Footnotes
This work was supported by CSI/90/2012, SATYAM/278/2015, and SERB N-PDF 2017 grants from the Government of India.
Disclosures: Bejoy Thomas—RELATED: Grant: Department of Science and Technology (DST), Government of India*; Support for Travel to Meetings for the Study or Other Purposes: DST, Government of India*; UNRELATED: Grants/Grants Pending: GE Healthcare, research grant*; Patents (Planned, Pending or Issued): applied for Indian patent*; Stock/Stock Options: Minority stocks in Wipro India. Ramshekhar N. Menon—RELATED: Grant: Department of Science and Technology, Comments: grant numbers mentioned in the article*; UNRELATED: Grants/Grants Pending: Department of Science and Technology, Comments: Details are provided in terms of grant numbers in the article.* *Money paid to institution.
Indicates open access to non-subscribers at www.ajnr.org
References
- 1.
- 2.
- 3.
- 4.
- 5.
- 6.
- 7.
- 8.
- 9.
- 10.
- 11.
- 12.
- 13.
- 14.
- 15.
- 16.
- 17.
- 18.
- 19.
- 20.
- 21.
- 22.
- 23.
- 24.
- 25.
- 26.
- 27.
- 28.
- 29.
- 30.
- 31.
- 32.
- 33.
- 34.
- 35.
- 36.
- 37.
- 38.
- Received April 22, 2019.
- Accepted after revision August 1, 2019.
- © 2019 by American Journal of Neuroradiology