
Graphical Abstract

Abstract
BACKGROUND AND PURPOSE: Quantitative susceptibility mapping is an emerging method for characterizing tissue composition and studying myelination and iron deposition. However, accurate assessment of myelin and iron content in the neonate brain using this method is challenging because these 2 susceptibility sources of opposite signs (myelin, negative; iron, positive) occupy the same voxel, with minimal and comparable content in both sources. In this study, susceptibilities were measured in the healthy neonate brain using susceptibility source separation.
MATERIALS AND METHODS: Sixty-nine healthy neonates without clinical indications were prospectively recruited for MRI. All neonates underwent gradient-echo imaging for quantitative susceptibility mapping. Positive (paramagnetic) and negative (diamagnetic) susceptibility sources were separated using additional information from R2* with linear modeling performed for the neonate brain. Average susceptibility maps were generated by normalizing all susceptibility maps to an atlas space. Mean regional susceptibility measurements were obtained in the cortical GM, WM, deep GM, caudate nucleus, putamen, globus pallidus, thalamus, and the 4 brain lobes.
RESULTS: A total of 65 healthy neonates (mean postmenstrual age, 42.8 [SD, 2.3] weeks; 34 females) were studied. The negative susceptibility maps visually demonstrated high signals in the thalamus, brainstem, and potentially myelinated WM regions, whereas the positive susceptibility maps depicted high signals in the GM compared with all WM regions, including both myelinated and unmyelinated WM. The WM exhibited significantly lower mean positive susceptibility and significantly higher mean negative susceptibility than cortical GM and deep GM. Within the deep GM, the thalamus showed a significantly lower mean negative susceptibility than the other nuclei, and the putamen and globus pallidus showed significant associations with neonate age in positive and/or negative susceptibility. Among the 4 brain lobes, the occipital lobe showed a significantly higher mean positive susceptibility and a significantly lower mean negative susceptibility than the frontal lobe.
CONCLUSIONS: This study demonstrates regional variations and temporal changes in positive and negative susceptibilities of the neonate brain, potentially associated with myelination and iron deposition patterns in normal brain development. It suggests that quantitative susceptibility mapping with source separation may be used for early identification of delayed myelination or iron deficiency.
ABBREVIATIONS:
- CGM
- cortical gray matter
- DGM
- deep gray matter
- PMA
- postmenstrual age
- QSM
- quantitative susceptibility mapping
SUMMARY
PREVIOUS LITERATURE:
Assessment of myelin and iron content in the early neonate brain may be useful for accurately evaluating neurodevelopment. Conventional quantitative susceptibility mapping can be used to investigate myelination and iron deposition, but measuring the individual contributions of myelin and iron content in the neonate brain is challenging because these 2 susceptibility sources have opposite signs and occupy the same voxel, with minimal and comparable content in both sources. Recent studies have demonstrated the feasibility of performing quantitative susceptibility mapping with source separation in the adult brain, which may be applied to the neonate brain.
KEY FINDINGS:
Significantly lower positive and higher negative susceptibilities were observed in WM compared with GM. In the deep GM, the thalamus showed significantly lower negative susceptibility than the other deep GM subregions. The occipital lobe exhibited significantly higher positive and lower negative susceptibilities than the frontal lobe.
KNOWLEDGE ADVANCEMENT:
Regional and temporal variations in positive and negative susceptibilities measured in the neonate brain using quantitative susceptibility mapping with source separation may be associated with myelination and iron deposition. These measures can potentially be used for early identification of impaired neurodevelopment in the neonate brain.
The early postnatal period is a crucial phase characterized by rapid brain development, which is an ongoing process that started prenatally, including myelination in the CNS.1 Early studies have reported the spatiotemporal patterns of myelination in the fetal and neonatal brain using histology2,3 and conventional T1- and T2-weighted MRI.4⇓-6 Recently, more advanced MRI techniques, such as DTI, multicomponent relaxometry, and magnetization transfer imaging, have provided greater insights into WM maturation at a microstructural level during infancy and early childhood.7⇓-9
Quantitative susceptibility mapping (QSM) is an emerging MRI method that offers another means of characterizing tissue composition.10 This technique is used to measure the volume magnetic susceptibility of each voxel, which represents intrinsic properties of materials within the voxel. Myelin is the predominant source of negative magnetic susceptibility (ie, diamagnetism) in the WM, making QSM an effective tool for evaluating myelination.11 While DTI, currently the most commonly used technique for WM assessment, provides indirect measures of myelination due to its reliance on axonal organization (eg, axonal diameter, cell swelling, and axonal packing density),12 QSM may allow measurements more specific to myelin due to the direct contributions of the lipid layers and proteins in the myelin sheath to the measured diamagnetism. Furthermore, QSM provides a sufficiently accurate evaluation of iron distribution in the brain, which exhibits positive magnetic susceptibility (ie, paramagnetism).10 Iron is essential for neurodevelopment, because oligodendrocytes, the iron-containing cells, play a primary role in myelin production. Altered neurotransmitter metabolism due to iron deficiency further disturbs neurodevelopment beyond impairment in myelination.1 Therefore, QSM may serve as an effective, noninvasive tool to study brain development in neonates, with quantitative evaluation of myelination and iron deposition.
In previous studies applying QSM to the developing brain, magnetic susceptibility was found to decrease in the WM and increase in the deep gray matter (DGM) with advancing age, reflecting the progressive WM myelination and DGM iron deposition throughout infancy and early childhood.11,13⇓-15 While these studies primarily demonstrated the temporal evolution of magnetic susceptibility during the first few years of life, there is a lack of investigation focused on magnetic susceptibility in the first 1–2 months of life, particularly in the context of normal brain development. Evaluating myelin and iron content of the neonate brain on the basis of the conventional QSM is challenging because it measures the average magnetic susceptibility within each voxel. In the neonate brain with a minimal amount of myelin and iron content, the effects of opposing signs of susceptibility from iron (positive) and myelin (negative) may be comparable and can cancel each other within the same voxel in most regions.
In this study, we measure the individual contributions of positive and negative susceptibilities within the voxels for more accurate assessment of myelin and iron content in early normal brain development. We use QSM with source separation16⇓⇓⇓-20 based on additional information of R2* measurements. While the bulk susceptibility is the sum of positive and negative susceptibilities within a voxel (resulting in a canceling effect), R2* relates to the sum of the absolute values of positive and negative susceptibilities within a voxel (resulting in an amplifying effect). Therefore, R2* can be used along with the bulk susceptibility to differentiate these 2 susceptibility contributions. Considering the regional differences in myelination and iron deposition, we characterize regional magnetic susceptibility of the neonate brain by comparing magnetic susceptibilities between different regions and correlating magnetic susceptibilities with neonate age.
MATERIALS AND METHODS
Study Population
In this prospective study, we enrolled 61 neonates from the Children’s National Hospital (Washington, DC) and 8 neonates from Weill Cornell Medicine (New York, New York). All neonates were healthy with a normal perinatal history of screening and ultrasound studies and without any clinical indication for MRI. The study was approved by the institutional review boards of both Children’s National Hospital and Weill Cornell Medicine, and written informed consent was obtained from the parents of each infant.
Data Acquisition
All MRI scans were performed on MR 750 3T scanners (GE Healthcare) using 8- or 32-channel head coils. All infants were scanned during natural sleep using the “feed and bundle” approach without sedation. A 3D multiecho gradient-echo sequence was performed using imaging parameters of TR = 55–60 ms, 7–9 TEs ranging from 5 to 44 ms with an echo spacing of 5–6 ms, bandwidth ≥ 50 kHz, flip angle = 20°, field of view = 160 × 160 × 100 mm3, and acquired spatial resolution = 0.38 × 0.4 × 2 mm3 or 0.5 × 0.63 × 2 mm3. The total scan time was approximately 5 minutes with parallel imaging (R = 2) and elliptical k-space coverage (70%). Anatomic images were acquired using a 3D T2-weighted fast-spin-echo Cube (GE Healthcare) sequence with TR = 2.5 seconds, TE = 68–84 ms, bandwidth = ± 50 kHz, field of view = 160 × 160 × 130 mm3, spatial resolution = 1 × 1 × 1 mm3, and a scan time of approximately 4 minutes with parallel imaging (R = 2). In 8 neonates, dual-echo fast-spin-echo imaging was performed for R2 mapping using TR = 4450 ms, TE = 21 and 126 ms, bandwidth = ± 31.25 kHz, field of view = 160 × 160 × 120–132 mm3, spatial resolution = 0.5 × 0.83 × 2 mm3, and a scan time of approximately 5 minutes with parallel imaging (R = 2).21.
QSM Reconstruction
In each infant, the whole brain was manually segmented on the gradient-echo first-echo magnitude images using ITK-SNAP software22 (www.itksnap.org) to generate masks required for QSM processing. Background field was removed using the variable-kernel sophisticated harmonic artifact reduction for the phase data method with a maximum sphere radius of 12 mm.23,24 Dipole inversion was performed using the morphology-enabled dipole inversion method with a regularization parameter of 1000 and model error reduction through iterative tuning.25,26 Bulk susceptibility measures were referenced to the mean susceptibility of the whole brain, which is considered a stable reference region due to its large size.10 For R2*-based source separation, the following complex signal model of gradient-echo MRI was applied, assuming a linear correlation between R2* and R2’: (R2* = α · R2’+β): R2* (r) + i2π · Δf(r) = α · Dr+ · |χ+ (r)| + α · Dr− · |χ− (r)| + β + i2π · Df (r) * [χ+ (r) + χ− (r)], where Δf(r) is the frequency shift, α and β are calibration parameters, Dr+ and Dr− are relaxometric constants (137 Hz/parts per million), Df (r) is a dipole kernel, and the asterisk denotes a convolution operation. This equation was formulated as a minimization problem and was solved iteratively using a conjugate gradient descent algorithm.16⇓-18 R2* and R2 maps were generated using the multi-echo gradient-echo and dual-echo fast-spin-echo data, respectively. The relationship between R2* and R2’ (R2*– R2) in the neonate brain was approximated in 8 neonates using a linear regression model and was applied to all neonates.16,17 For this regression analysis, mean R2* and R2’ values were measured within the cortical gray matter (CGM) and WM, each divided into the frontal, parietal, temporal, and occipital lobes, as well as DGM, resulting in a total of 9 ROIs per neonate.
Image Registration and Segmentation
Reconstructed susceptibility maps were registered to T2-weighted anatomic images in each neonate using the rigid image registration algorithm of Advanced Normalization Tools (ANTs; http://stnava.github.io/ANTs/).27 The gradient-echo first-echo magnitude images were first registered to anatomic images, creating a transformation matrix. This matrix was then used to move the susceptibility maps to the anatomic image space. The ROIs for mean susceptibility measurements included the CGM, WM, and DGM. Within the DGM, the caudate nucleus, putamen, globus pallidus, and thalamus were further segmented. The brain was also segmented into the frontal, parietal, temporal, and occipital lobes, with each lobe including both CGM and WM. All these ROIs were initially segmented on the anatomic images using the Draw-EM tool kit (https://github.com/MIRTK/DrawEM)28 and further refined manually using ITK-SNAP (Fig 1). The manual corrections were minor but were applied to almost all subjects by the same rater (K.K.), who had >8 years of experience in neonatal brain MRI segmentation. The mean susceptibility of each ROI was calculated by averaging the susceptibility of all voxels within the ROI of each neonate. Furthermore, susceptibility templates were generated by normalizing the susceptibility maps of all neonates to a high-definition spatiotemporal neonatal brain atlas.29 The neonatal brain atlas for a postmenstrual age (PMA) of 43 weeks was used in accordance with the mean PMA at the MRI of our cohort. The registered images of all neonates were manually inspected to confirm that there were no major registration errors.

Example of segmentation in 1 representative neonate brain (PMA = 46.3 weeks). Segmented ROIs are overlaid on the anatomic image in different colors: green, CGM; blue, WM; gray, DGM; orange, caudate nucleus; purple, putamen; yellow, globus pallidus; red, thalamus; light green, frontal lobe; light blue, parietal lobe; brown, temporal lobe; light purple, occipital lobe.
Statistical Analysis
We used descriptive statistics to determine the baseline characteristics of our cohort. We used the Wilcoxon signed-rank test to determine the differences in regional mean susceptibility and mean R2* among different ROIs. To examine the association between mean susceptibility and PMA in each ROI, we calculated Pearson correlation coefficients, corresponding P values, and linear regression lines. Bonferroni correction was used to correct for multiple comparisons. After the correction, the significance level was .0008 (.05/60) for comparing different ROIs and .0011 (.05/44) for estimating associations with PMA.
RESULTS
Study Population
Of the 69 neonates enrolled, 3 neonates were excluded from our study due to a 5-minute Apgar score of <7. No MRI scans had substantial motion artifacts. One infant was further excluded due to unexplained artifacts in the raw gradient-echo images. The characteristics of the remaining 65 infants (PMA at MRI, 42.8 [SD, 2.3] weeks; 30 females) are summarized in Table 1.
Characteristics of the study cohort (n = 65)
R2*-Based Source Separation
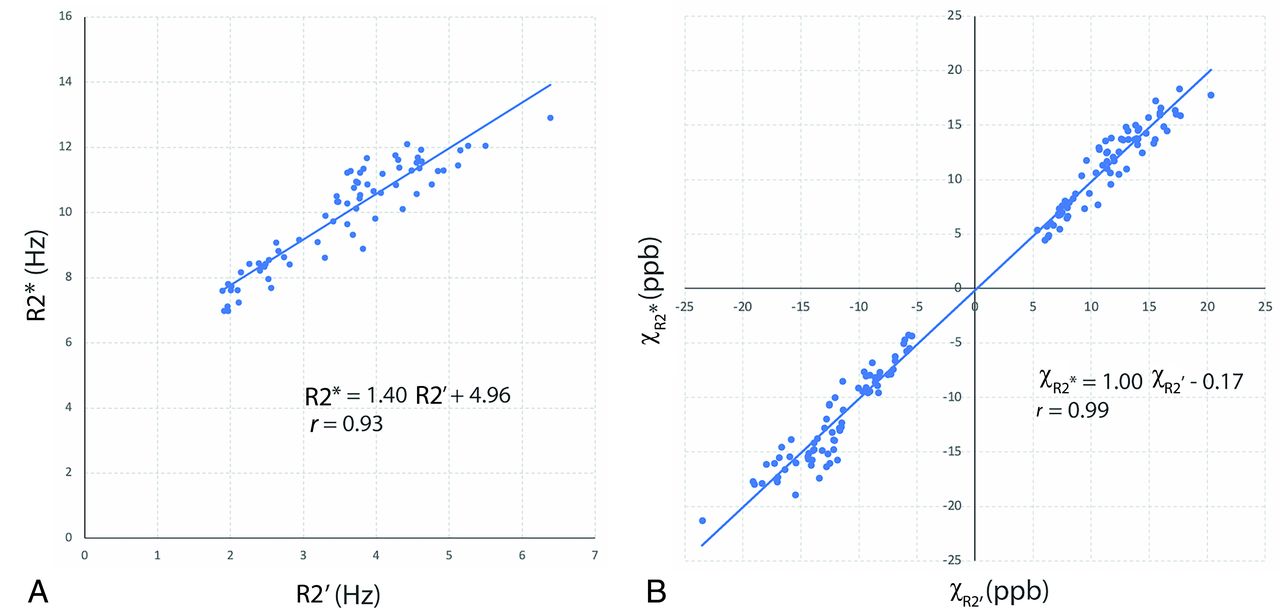
Figure 2A shows the linear regression between the mean R2* and mean R2’ of 72 ROIs from 8 neonates (PMA at MRI, 43.3 [SD, 1.7] weeks; range, 40.9–45.6 weeks), with a relationship of R2* = 1.40 × R2’+ 4.96 (r = 0.93). Figure 2B demonstrates the validation of the R2*-based source separation by comparing it with the R2’-based method. The susceptibilities from the 2 different source separation algorithms demonstrated good agreement (r = 0.99).

A, Linear regression of mean R2* and mean R2’. B, Linear regression of mean χR2* (R2*-based source separation) and mean χR2 (R2’-based source separation). ROIs in these analyses include the frontal, parietal, temporal, and occipital lobes of CGM and WM as well as DGM in 8 neonates. ppb indicates parts per billion.
Qualitative Analysis
Figure 3 shows the original susceptibility images (ie, before registration) acquired in 3 representative neonates with different PMAs at MRI (40.3, 44.4, and 47.4 weeks). In individual neonates, the DGM nuclei were not clearly distinguishable from the surrounding WM on all susceptibility and R2* maps, being the primary difference from typical susceptibility maps obtained in the adult brain. There was also indistinct contrast between the CGM and WM on the conventional susceptibility maps; however, positive susceptibility maps revealed increased CGM-WM contrast. Additionally, high signal intensities were found in the cerebral veins on the positive susceptibility maps. On the other hand, the averaged susceptibility templates demonstrated common contrast across all neonates while suppressing individual variations (eg, pial and cortical vein signals), as shown in Fig 4. The negative susceptibility maps revealed high signal intensities in areas of WM linked to early myelination, such as the posterior limb of the internal capsule, corpus callosum, and corticospinal tracts, which were best visualized on the axial, sagittal, and coronal planes, respectively. However, most other WM regions potentially unmyelinated showed slightly lower diamagnetism than the CGM. Interestingly, the positive susceptibility maps indicated low paramagnetism in both the aforementioned myelinated WM regions as well as unmyelinated WM regions at birth, such as the corona radiata, optic radiation, and external capsule. The thalamus, brainstem, and cerebellum exhibited elevated signal intensities on the negative susceptibility maps. The thalamus also showed high signals on the positive susceptibility maps. In addition, the primary sensorimotor cortex demonstrated high signals on both the positive and negative susceptibility maps.

Original susceptibility (in parts per billion) and R2* (in hertz) maps before registration, acquired in 3 neonates with different PMAs at MRI of 40.3 (A), 44.4 (B), and 47.4 (C) weeks. χ, χ+, and χ– denote conventional, positive, and negative susceptibilities. High paramagnetism was found in the veins on the conventional susceptibility and positive susceptibility maps. Positive susceptibility maps also show increased contrast between CGM and WM compared with conventional susceptibility maps.

Templates of T2-weighted anatomic images (A) and conventional (B), positive (C), and negative (D) susceptibility maps (in parts per billion), and R2* maps (in hertz, E) in the axial (3 different levels), sagittal, and coronal planes. Averaged susceptibility maps revealed substantial contrasts in several regions that were invisible on the maps from individual neonates. These regions included the thalamus, brainstem, sensorimotor cortex, and WM fiber tracts, such as the corona radiata, optic radiation, external capsule, posterior limb of the internal capsule, corpus callosum, and corticospinal tract. T2-w indicates T2-weighted.
Quantitative Analysis
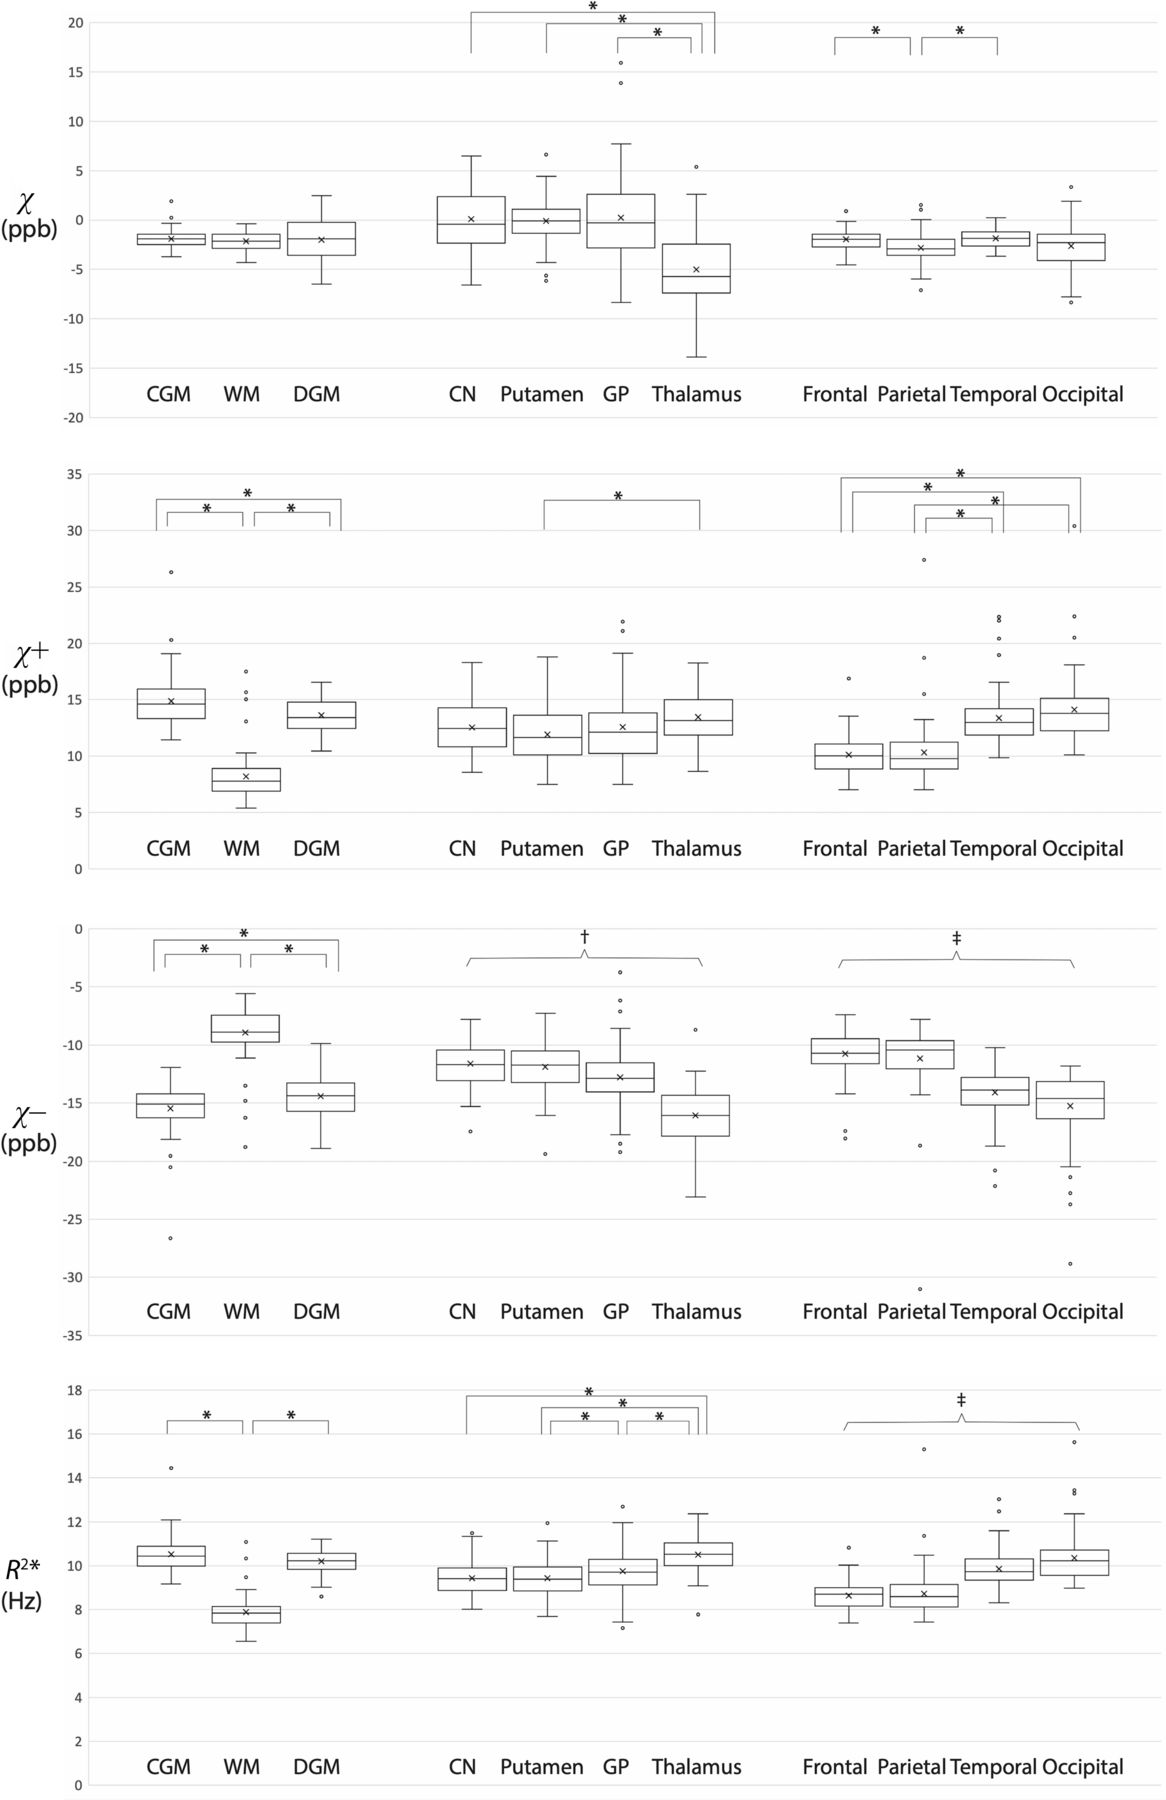
All regional mean susceptibilities and R2* are summarized in Table 2, and pair-wise comparisons within each ROI group are illustrated in Fig 5. While there were no significant differences in conventional susceptibility among the CGM, WM, and DGM, the CGM and DGM showed significantly higher mean positive susceptibility and significantly lower mean negative susceptibility compared with the WM (P < .0001). Of note, despite the higher diamagnetic signals in the potentially myelinated WM regions, the overall WM showed significantly higher mean negative susceptibility than the CGM and DGM. Among the DGM subregions, the thalamus showed significantly lower mean negative susceptibilities than the other subregions (P < .0001). Among the 4 brain lobes, the occipital lobe showed significantly higher mean positive susceptibility and significantly lower mean negative susceptibility than the frontal lobe (P < .0001). Table 3 contains the results of linear regression between the regional mean susceptibility (or R2*) and PMA in only those ROIs showing significant associations. The Online Supplemental Data show the distributions of mean susceptibilities and mean R2* across PMA in these ROIs. While there was no significant association of conventional susceptibility with PMA, there were significant associations of positive and negative susceptibilities with PMA: the putamen (χ+, χ–) and globus pallidus (χ+). Among all these ROIs, the globus pallidus showed the highest rate of temporal change (0.527 parts per billion/week).

Comparison of mean susceptibilities and R2* between ROIs within each ROI group. Each asterisk indicates a significant difference (P < .0008). † indicates significant differences between all possible pairs within the ROI group except for the comparison between the caudate nucleus and putamen (P < .0008). ‡ indicates significant differences between all possible pairs within the ROI group except for the comparison between the frontal and parietal lobes (P < .0008). Open circles represent outliers, defined as data points that are beyond 1.5 times the interquartile range, larger above the third quartile or below the first quartile. ppb indicates parts per billion.
Means of regional mean magnetic susceptibilitiesa (in parts per billion) and R2* (in hertz) in each ROI
Parameters of linear regression between the measurement (susceptibility or R2*) and PMA in the ROIs showing significant associations (P < .0011)
DISCUSSION
In this study, we measured the magnetic susceptibilities of the normal neonate brain in the first 2 months of life, separating positive and negative susceptibility sources. On the conventional susceptibility maps, we visually observed lower susceptibilities along most WM fiber tracts. However, when decomposed into the positive and negative susceptibilities, the magnetic susceptibility exhibited different patterns in the WM. While negative susceptibility maps demonstrated high diamagnetism only in the myelinated WM tracts, positive susceptibility maps demonstrated low paramagnetism in both myelinated and unmyelinated WM regions. Negative susceptibility maps also depicted high diamagnetism in other regions associated with early myelination, including the thalamus and brainstem. In the quantitative analysis, we confirmed that the mean positive susceptibility was significantly lower in the WM than in the CGM and DGM. We also found that the mean negative susceptibility was significantly higher in the WM than in the CGM and DGM due to large unmyelinated WM regions with lower diamagnetism. Among the DGM nuclei, the thalamus demonstrated the lowest mean negative susceptibility, and the putamen and global pallidus exhibited mean positive and/or mean negative susceptibility significantly associated with PMA. Among the 4 brain lobes, the occipital lobe showed significantly higher mean positive susceptibility and significantly lower mean negative susceptibility than the frontal lobe.
CGM-WM Contrast of Susceptibility
In the adult brain, QSM with source separation has demonstrated that highly paramagnetic susceptibility is mainly found in the GM, whereas highly diamagnetic susceptibility is mainly limited to the WM. These separate susceptibility patterns are relatively straightforward to interpret and align with earlier findings based on conventional QSM with histologic validation. In contrast, source-separated susceptibilities measured in our neonate cohort revealed intriguing findings that require careful interpretation. Prior MR studies based on T1- and T2-weighted imaging have reported myelination at birth in the brainstem, thalamus, posterior limb of the internal capsule, and corticospinal tract.4,5 Similarly, highly negative susceptibilities were visually observed in these regions in the present study. However, except for these regions with early myelination, most WM regions, which are potentially unmyelinated, exhibited lower diamagnetism than the CGM. This CGM-WM difference in diamagnetism may be attributed to regional variation of macromolecular content. Early CT studies have suggested a higher macromolecular concentration in the CGM than in the WM of the neonate brain,30,31 which is corroborated by shorter relaxation times32 and a higher magnetization transfer ratio9 in the CGM than in the WM in neonates. On the other hand, the higher paramagnetism in the CGM than in the WM is potentially caused by higher iron content in the CGM, similar to the adult brain results reported by histochemical studies.33
Iron concentration has been reported to be higher in the WM than in the CGM in the neonatal rat brain,34,35 but this finding has not been confirmed in the human brain. Nevertheless, the observed high paramagnetic susceptibility in the sensorimotor cortex is likely related to high iron levels. In the cerebral cortex, the motor cortex has previously been found to have the highest iron content across the life span, followed by the occipital cortex and sensory cortex.36 Another potential source of higher positive susceptibility in the CGM is its higher macromolecular content. Macromolecules not only exhibit diamagnetism but also induce a positive frequency shift due to the chemical exchange between water and macromolecular protons.37⇓⇓-40 The apparent high paramagnetism in the neonate CGM may be caused by this effect on magnetic susceptibility. In the adult brain, there are more abundant macromolecules in the WM, such as lipids, cholesterol, and proteins associated with myelin, and studies have suggested that the effect of chemical exchange on the frequency shift is smaller than on the opposite frequency shift induced by diamagnetic susceptibility. However, the level of these 2 effects is dependent on the molecular types, size, and content and, therefore, may be different in the neonate CGM compared with the adult WM.40 Further investigation into the contribution of macromolecular and iron content to susceptibility contrast between the CGM and WM in the neonate brain is warranted in future studies.
Susceptibility in the DGM
Unlike the adult brain, the neonate DGM exhibited no high paramagnetism due to insufficient iron deposition, making it difficult to distinguish the DGM from the surrounding WM on all susceptibility and R2* maps in individual infants. However, the averaged susceptibility maps on the template space revealed high diamagnetism and high paramagnetism in the thalamus. The mean negative susceptibility measured in the thalamus was also significantly lower than those of the other subregions in the DGM. This finding is potentially attributed to early myelination in the thalamus of the neonate brain. Previous studies have documented that the first regions to be myelinated in the neonate cerebrum are the DGM nuclei; and specifically, the thalamus is one of the myelinated regions at birth.2⇓⇓-5 Along with myelination, iron deposition is expected to progress in the DGM simultaneously. The globus pallidus and putamen showed significant associations of positive susceptibility with PMA. Particularly, the globus pallidus demonstrated the most rapid temporal change in susceptibility among all ROIs. This feature appears to be supported by a postmortem iron study by Hallgren and Sourander,36 which has demonstrated that the globus pallidus shows the most rapid increase in iron content during brain development. Additionally, the putamen also showed significantly decreasing negative susceptibility with advancing PMA, possibly due to progressive myelination. The significant temporal increase in R2* in the putamen may indicate an amplifying effect of iron and myelin content on R2*, whereas this outcome results in a canceling effect on conventional susceptibility.16⇓⇓⇓-20
Susceptibility in the 4 Brain Lobes
There were significant differences in both mean positive and mean negative susceptibilities among the 4 lobes of the neonate brain, though these were challenging to visually confirm in the susceptibility maps. These regional susceptibility variations may be associated with different degrees of myelination and iron deposition. Global patterns of myelination in the developing brain have been described in the literature as proceeding from the central sulcus outward to the poles, with the occipital lobe myelinating before the frontal lobe (so-called caudal-to-rostral direction).4,6,8,14 In line with these findings, the mean negative susceptibility was the lowest in the occipital lobe and the highest in the frontal lobe. Similarly, variation of iron distribution among the 4 brain lobes has previously been studied, demonstrating the highest and lowest iron content in the occipital and frontal cortices, respectively.36 In accordance with this previous study, the mean positive susceptibility of our neonate brain cohort was significantly higher in the occipital lobe than in the frontal lobe.
Limitations
This study has limitations. First, validating susceptibility source separation in the neonate brain as a means to assess myelin and iron content is necessary but remains challenging. Even with reliable separation of paramagnetic and diamagnetic susceptibilities, estimating myelin or iron content using these measures may be complicated by the potential presence of nonmyelin macromolecules, especially in GM regions. Their contribution to susceptibility is typically considered negligible in the adult brain, though this consideration may not hold true for the neonate brain. Ultimately, accurate correlations between susceptibilities and iron or myelin content could be assessed through postmortem studies using tissue specimens, but this method may be impractical for healthy cohorts. Second, our measurement of mean regional susceptibility was limited to the supratentorial areas due to potential errors in susceptibility measurement around the cerebellum. The neonate brain often exhibits large off-resonance near the back of head and neck regions due to air-tissue interface with the relatively high curvature compared with adults. This effect is commonly observed as blooming artifacts in neonatal functional MRI studies and was also evidenced by high R2* values in the present study. With incomplete background field removal, this feature may lead to spurious susceptibility measurements. In future studies, more robust background field removal approaches optimized for the neonate brain should be investigated to filter out the field perturbation in these regions and prevent error propagation into susceptibility maps.
CONCLUSIONS
Unlike the adult brain, where either myelin or iron serves as the primary source of magnetic susceptibility in specific regions, there is no single predominant source of magnetic susceptibility in each region of the neonate brain, highlighting the necessity for source separation in neonate brain QSM. The present study provides new insight into regional magnetic susceptibility in the healthy neonate brain by evaluating the contributions of paramagnetic and diamagnetic susceptibility sources separately. The regional variations and temporal changes observed in positive and negative susceptibilities are likely associated with myelination and iron deposition patterns in normal brain development. These findings suggest that QSM with source separation may have the potential for early detection of impaired neurodevelopment by measuring altered regional susceptibilities induced by delayed myelination or iron deficiency.
Acknowledgments
We thank the parents and neonates who participated in this study. We are grateful to our study team for supporting recruitment and enrollment and for performing the postnatal MRI studies. We also thank Drs Hyeong-Geol Shin and Junghun Cho and Alexandra Roberts for valuable discussions.
Footnotes
This study was supported by National Institutes of Health grants R01HD100012 and R01HL116585.
Disclosure forms provided by the authors are available with the full text and PDF of this article at www.ajnr.org.
References
- Received May 1, 2024.
- Accepted after revision August 13, 2024.
- © 2025 by American Journal of Neuroradiology


Jump to section
Related Articles
Cited By...
- No citing articles found.