
Abstract
BACKGROUND AND PURPOSE: Experimental autoimmune encephalomyelitis (EAE) in the marmoset was monitored by serial MR imaging to determine correlates to the natural-history MR studies in multiple sclerosis (MS). The relationships of MR-revealed lesions to clinical status and histopathologic findings were also explored.
METHODS: We induced EAE by subcutaneous inoculation in two marmosets by human white matter (HWM) and in seven marmosets by MP4 (a chimeric recombinant fusion protein of myelin-basic and proteolipid protein) in adjuvant along with intravenous inactivated pertussis vaccine to facilitate the disease process. The HWM-inoculated animals were induced with Freund's adjuvant as the established model of marmoset EAE. The MP4-inoculated animals were induced with either Freund's incomplete adjuvant or TiterMax as part of a preclinical treatment trial. MR imaging was performed at 1.5 T at baseline, and repeated at 1- to 2-week intervals for a period of up to 16 weeks in six EAE-induced marmosets, and intermittently for up to 70 weeks in three EAE-induced and two control marmosets. Proton density–(PD-) and T2-weighted, pre- and postgadopentetate dimeglumine enhancement, T1-weighted, and magnetization transfer (MT) images were obtained. The brains were prepared for histologic evaluation of lesion distribution and counts, characterization of lesions as demyelinating or inflammatory, and histopathologic scoring. The clinical, MR, and pathologic scoring were done on grading systems, and correlated for evaluation.
RESULTS: White matter (WM) changes after EAE induction were observed first at 9 days in the HWM-induced animals and at 2.5 weeks in the MP4-induced animals, with subsequent week-to-week fluctuations on PD- and T2-weighted images. Contrast-enhancing lesions were not observed in all animals. MR-revealed WM lesions correlated to histopathologic analysis of EAE lesions, measuring from 0.5 mm to 1.5 mm. The lesion count and extent of demyelination was greater in the HWM-induced animals than in the MP4-induced animals. Some MR-revealed lesions correlated directly to clinical symptoms, but the majority of lesions were clinically silent.
CONCLUSION: On MR images, lesions in the EAE marmoset model were confined to the WM, and their development, resolution, distribution, and enhancing characteristics fluctuated over the duration of the study. The dynamic presentation of MR-revealed lesions confirms the parallels between EAE in the marmoset and relapsing-remitting MS. Clinical symptoms alone were not representative of ongoing pathologic brain lesions. Therefore, serial MR imaging serves as a very important adjunct to clinical and histologic surveillance of the development of new and the persistence of existing brain lesions in this animal model of MS.
Multiple sclerosis (MS) is an autoimmune demyelinating disease of the CNS. Factors such as antigen-specific encephalitogenic T cells and antibodies targeting myelin proteins appear to be the major effectors of myelin damage (1, 2). As a result, therapies have been directed at specific aspects of the immunologic pathogenesis (3–5). Defining the factors that initiate and perpetuate the ongoing pathogenesis, as well as designing treatment strategies for this disease, have been complicated by absence of an identifiable causative agent, diversity of coexisting CNS lesion stages (ie, acute, chronic active, chronic inactive, remyelinating, gliotic plaque), an unpredictable relapsing-remitting clinical course early in the disease, lack of a direct correlation of clinical symptoms to the occurrence of new white matter (WM) lesions, and the absence of a naturally occurring animal form of the disease (6–8). MR studies have had a major impact on the understanding of the natural history of MS. MR imaging serves as an important tool for the diagnosis and monitoring of treatment of MS. MR is a predictive measure of the future development of MS in monosymptomatic patients and an effective method of monitoring the natural history of the disease. MR imaging has been used as primary and secondary outcome measures in phase I–II and pivotal phase III treatment trials (5, 8–20).
EAE has been used to study the pathogenesis of CNS demyelination, and encompasses a group of CNS inflammatory/autoimmune diseases in a variety of laboratory animal species with characteristics similar to MS. EAE induction usually involves the direct inoculation of a CNS WM homogenate or more purified myelin proteins in an adjuvant administered intradermally or subcutaneously (1, 21). EAE can also be induced by the passive transfer of encephalitogenic T cells from an animal previously exposed to myelin antigen or with naturally occurring cloned encephalitogenic T cell with adjuvant and pertussis. The latter method of induction is limited to susceptible, highly inbred mice, rat, and or guinea pig strains (22–26), and nonhuman primate chimeric twins that are tolerant to the transferred encephalitogenic T cells (27–29). Until now, MR imaging has had a limited role in monitoring disease course or preclinical drug evaluation in EAE animal models (30–34).
Using specialized coils, EAE has been evaluated by high-field MR imaging (30, 35–43). The high resolution required to evaluate the EAE SJL mouse model, which closely mimics the relapsing-remitting course of MS, requires lengthy examination times and technically demanding MR microscopy (43, 44). MR studies of EAE in rats and guinea pigs have shown the appearance of T2 lesions at field strengths of 1.5–7 T that correlated to edema, inflammation with lymphocytic and polymorphonuclear leukocyte infiltrates, and mild perivascular demyelination revealed by histopathologic analysis (32, 36, 37, 40, 42, 44–48). In the guinea pig EAE model, decreases in the magnetization transfer ratio were associated with edema and not demyelination (49). The onset of clinical symptoms in the guinea pig and rat EAE models were often preceded by the observation of contrast-enhancing lesions by up to 12 hours, and at times enhancement lasted as long as 5 weeks in association with clinical symptoms (37, 46, 47, 50, 51).
Increases in T1 and T2 relaxation times were detected and shown to progress over the course of disease in the cynomolgus monkey EAE model (52, 53). Correlations between EAE disease progression and apparent diffusion changes also have been observed in this primate model (54). These changes were associated with inflammation, demyelination, hemorrhage, and necrosis confirmed by histopathologic analysis (53–55).
The marmoset model of EAE recently has been developed, and the immunologic aspects in this model studied in depth (27, 56–59). In this model, direct induction with myelin-basic protein (MBP) or proteolipoprotein (PLP) alone, or the adoptive transfer of MBP-reactive T cells between chimeric twins, produced an inflammatory, nondemyelinating, and nongliotic disease (27, 57, 58). Marmosets in which EAE was induced with human white matter (HWM) homogenates, myelin oligodendrocytic glycoprotein (MOG), or MBP with anti-MOG antibodies, followed by the intravenous infusion of killed pertussis organisms, have developed a demyelinating gliotic disease with a relapsing-remitting course (27, 59). This model has been documented to parallel the relapsing-remitting course of MS as well as produce brain lesions detectable by MR imaging associated with demyelinating or gliotic WM lesions (27). Certain components of myelin have been described as more antigenic in eliciting demyelination; ie, MOG is better than MBP or PLP for this purpose (57). It is thought that HWM and MOG induce macrophage infiltrates that may be required to initiate demyelination and gliotic scarring (27, 57). MR-revealed changes in this model, obtained at 4.7 T and by imaging fixed brain, have shown a high degree of correlation to lesion counts quantified by histopathologic analysis. Contrast-enhancing lesions depicted on the terminal in vivo scans correlate to the development of new active lesions identified by pathologic study (59).
Our study was designed to monitor serially EAE lesion development in the marmoset model in vivo over the course of disease. Serial MR imaging was used to evaluate changes in lesion size and distribution and correlate MR lesions to clinical symptoms. Lesions on terminal MR scans were also correlated to lesions on histopathologic slices and to clinical symptoms. Documentation of serial MR imaging results in the marmoset EAE model will further assist in determining the relevance of this model to clinical MS studies.
Methods
This study was performed as part of an approved Animal Care and Use Protocol at the National Institutes of Health. Nine EAE-induced and two control marmosets, ranging in age from 1.2 to 2.4 years in nine marmosets and 8 to 9 years in two marmosets, were studied. Inocula, animal age, and sex are listed in Table 1. EAE was induced by posterior thoracic and posterior sacral subcutaneous injections of HWM homogenate (Harvard Brain Tissue Resource Center, McLean Hospital, Belmont, MA) with Freund's incomplete adjuvant (CFA, Difco Laboratories, Detroit, MI) supplemented with 3 mg/mL H37RA (Difco Laboratories) in two animals. EAE was induced in two animals with MP4, a chimeric fusion protein of myelin-basic and proteolipid protein (Alexion Pharm., New Haven, CT) (60, 61) and CFA. MP4 and TiterMax (CytRx Corp, Altlanta-Norcross, GA) were used in five animals. Two HWM- and two MP4-injected animals were inoculated with CFA, and two MP4-injected animals were inoculated with TiterMax as preliminary studies, whereas three of the MP4- and TiterMax-inoculated animals were controls in a drug treatment trial. The adjuvant was changed to TiterMax after the preliminary study because of the severity of skin necrosis produced by CFA.
Inocula, animal designation and information, and the MR imaging schedule
Injections were done under anesthesia, using a combination of ketamine hydrochloride:acepromazine (10cc:1cc), administered at a dose of 0.045 mg/gm intramuscularly. On days 0 and 3 after EAE induction, the animals were given inactivated Bordatella pertussis vaccine (Lederle-Pravis Biologicals, West Henrietta, NY) intravenously in the amount of 1010 organisms in 5 cc of normal saline over a period of 30–45 minutes. The animals were monitored daily for neurologic symptoms, using a disease scale established in other EAE marmoset studies (27). CSF was not obtained from animals in this study.
Clinical scoring was performed using the following grading system (27): Grade 0, normal neurologic findings; Grade 1, lethargy, anorexia, weight loss; Grade 2, ataxia, and either paraparesis/monoparesis, sensory loss, or brain stem syndrome, including gaze palsy or blindness; Grade 3, paraplegia or hemiplegia; and Grade 4, quadriplegia.
MR scans were performed on a 1.5-T MR imaging unit (General Electric, Milwaukee, WI). Baseline images were obtained prior to immunization, then weekly to bimonthly. The MR imaging schedule is shown in Table 1. The animals were scanned in a prone position with a 3-inch receive-only surface coil (General Electric) in a custom-design Teflon® stereotaxic head frame. Anesthesia was administered intramuscularly by using a ketamine hydrochloride:acepromazine mixture (10cc:1cc) and xylazine, dosed at 0.045 mg/gm and 0.07 mg/gm, respectively. Atropine was administered subcutaneously at a dose of 0.02 μg/gm. Sagittal and coronal localizer scans were performed using a T1-weighted sequence to check positioning.
MR imaging was performed with a field of view of 6 × 4 cm, and a 192 × 256 matrix (voxel size, 0.098 mm3). Total scanning time was usually less than 1 hour. MR imaging was performed in the axial or coronal plane at interleaved 2- to 3-mm slices, using PD- and T2-weighted or spin-echo images (2000–3200/19–22/80–110 [TR/TE1/TE2]). T1-weighted spin-echo images (450/13) with and without magnetization transfer (MT) saturation pulse were also performed (MT pulse 16 ms, single sinc pulse; 1.2 kHz below water frequency; flip angle, 950°, B1 intensity 3.67 × 10⁶ T). Variations in scanning parameters depended on scan-plane orientation. MT imaging was used to increase sensitivity to contrast enhancement. Postcontrast T1-weighted and MT images were obtained with Gadopentetate Dimeglumine (GdDTPA) (Magnevist, Berlex Laboratories, Cedar Knolls, NJ) contrast administered intravenously at a dose of 0.6 cc/kg (0.3 mmol/kg).
Animals were euthanized with intravenous pentobarbital at the end of the study (15 weeks to 1.4 years) or when clinically relevant. Postmortem tissues were fixed in formaldehyde gluteraldehyde and processed for histologic staining. Histologic stains included hematoxylin and eosin (H&E) to evaluate tissue structure and cellularity, luxol fast blue (LFB) to evaluate demyelination, and bodian silver stain to evaluate presence of intact neuronal axons in demyelinated regions. Because of the collaborative nature of this study, only half of the brain was available for histopathologic analysis for three of the MP4 animals.
The MR qualitative and pathologic scoring system is listed in Table 2. A stereotaxic head frame was used to maintain anatomic positioning in lieu of image registration to compare images between serial studies. Lesion counts and size were determined from the LFB sections under light microscopy. Lesions found by histopathologic analysis were anatomically matched by visual inspection to lesions on the corresponding anatomic MR slice. Limitations in this method derive from slice thickness variability between the 2- to 3-mm MR slices and the 8-micron histologic sections and discrepancies between the MR image and histopathology slicing angles.
MR and pathologic grading systems
Results
Dynamic changes in lesion distribution, size, and number of contrast-enhancing lesions were apparent in the sequential MR studies, and are reflected in the MR and clinical score (CS) graphs in Figure 1 and in the serial MR composites (Fig 2A and 3A). Small lesions not readily visible on the T2-weighted images often were delineated better on the PD-weighted images. Larger WM lesions were usually more diffuse on the T2- than on the PD-weighted images because of higher signal to noise on the PD-weighted sequence (Fig 1A, 2A, 3A, and 4A). The distribution of WM lesions extended from the corpus callosum in the frontal lobe to the parietal and occipital regions of the brain along with the posterior fossa, brain stem, and periventricular areas. Lesions that would be uncharacteristic for EAE, such as gray matter lesions, were not visible on MR images in this experimental cohort of animals. Diffuse lesions as long as 4.5 mm in the WM of the cerebral hemisphere condensed to focal lesions of 0.24 to 0.61 mm in length over a 2- to 4-week period (Fig 2A). Other lesions of up to 2.2 mm in length revealed on scans were not detectable 4 weeks after the original lesion was detected (Fig 3A).

MR and clinical score graphs. The MR and clinical scores are presented for animals HWM-1 (A), HWM-2 (B), MP4–1 (C), and MP4–2 (D). MR scans and histologic images are presented in figures 2–5⇓⇓⇓. The dynamic nature of the MR-revealed changes is demonstrated by the changes in MR scores. These graphs show the lack of a direct correlation between clinical disease and lesion activity in the brain, particularly in the relapsing-remitting animals (MP4–1, MP4–2). More detailed information on the clinical and MR scores is presented in Tables 3–5⇓⇓

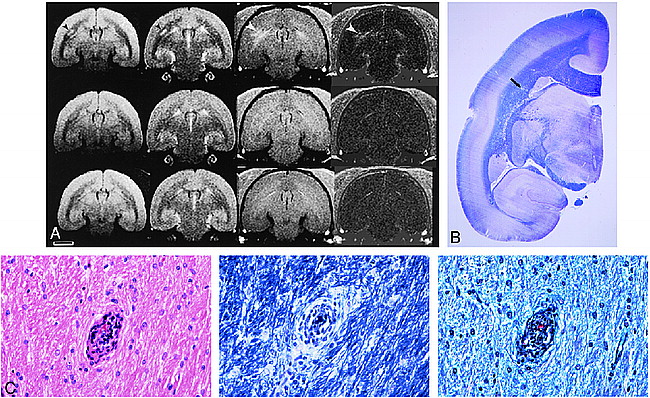
Sequential MR series and histologic representation of lesions found in MP4–1 marmoset.
A and B, Six of 15 representative sequential MR studies from weeks 0–15 after EAE induction (A, weeks 0, 2, 4; B, weeks 6, 8, 15 [from top to bottom, respectively]) show the natural history of EAE in animal MP4–1. A and B are PD, T2, postcontrast T1-weighted, and postcontrast MT T1-weighted images (left to right). B at week 6 did not have corresponding postcontrast MT T1-weighted image. This animal developed a maximal clinical score of 2 at 2–2.4 weeks, demonstrating an intermittent fixed gaze, spasticity, muscle tremors, and seizures. This animal developed transient seizures at 18 days that subsided with phenytoin therapy for a period of 30 days. At week 2, there was marked contrast enhancement of the falx cerebri and tentorium on postcontrast T1-weighted and MT images (arrowheads), which was not appreciated at baseline or on most follow-up studies. No meningeal pathologic lesions were observed after histopathologic staining. PD- (2500/20/2 [TR/TE/excitations]) and T2-weighted (2500/80/2) images showed diffuse WM lesions as early as 2.5 weeks after EAE induction (not shown) that persisted through week 4. Diffuse WM changes seen at week 4 on the PD- and T2-weighted images (arrowheads) were accompanied by more focal enhancement on the week 4 postcontrast MT image (450/13/4) (arrowheads). The same lesion areas enhancing on the 4th-week post-MT image were visible as focal lesions at week 6 on the PD-, T2-, and to a lesser extent, the postcontrast T1-weighted (450/13/4) images (arrowheads). Enhancement of the same lesion areas appears to have persisted on the 8th-week postcontrast MT image (arrowheads), and became less visible on the PD- and T2-weighted images. New lesions developed at week 15 on the PD-, T2-, and postcontrast T1-weighted and MT images (arrowheads). The contrast-enhancing lesions at weeks 4–8 appear to match some of the demyelinating lesions on the LFB-stained histologic section (fig 2C, slice 2). Enhancing lesions on the postcontrast MT image may represent the focal centers for BBB breakdown, which produced the more diffuse changes on the 4th-week PD- and T2-weighted images, and later condensed down to the focal origin of the lesions present at week 6 on the PD- and T2-weighted scans. (Scale bar equals 5 mm)
C, Two MR slices for the PD- (2500/20/2), T2- (2500/80/2), and postcontrast T1-weighted (450/13/4) sequences from the terminal 15-week MR scan are shown. Slice 2 is present in figures 2A and 2B. The LFB-stained brain mounts from the left brain are positioned below their corresponding MR slice. The brain was sectioned for histologic analysis with the superior aspect slightly posterior to the MR slice. The superior-enhancing lesion of slices 1 and 2 (arrow) on the postcontrast T1-weighted image is seen histologically only on slice 1. The histologic features of this lesion are shown in figure 2D. One demyelinated area on the LFB-stained slice 2 is also seen on the corresponding PD-, T2-, and postcontrast T1-weighted scans (arrowhead). The other areas of demyelination on the LFB-stained slice 2 appear to match previous lesion areas visible on the 4th- and 8th-week postcontrast MT, 4th-week postcontrast T1-weighted, and 6th-week PD- and T2-weighted images (fig 2A and 2B). (Scale bar equals 5 mm)
D, Histologic features of the most superior lesion in figure 2B (15th-week postcontrast T1-, MT, PD-, and T2-weighted series) and in figure 2C (postcontrast T1-weighted and LFB-stained slice 1; postcontrast T1-, PD- and T2-weighted slice 2) is shown in this figure. Top left panel is H&E-stained (magnification, 100×), top right panel LFB-stained (magnification, 100×), lower left panel is bodian silver—stained (magnification, 100×), and lower right panel is bodian silver—stained (magnification, 400×). Higher-power view of the H&E-stained sections shows that the perivascular inflammatory cell infiltrate is mostly confined to the Virchow-Robin spaces. LFB staining shows that there was minimal demyelination surrounding the inflamed vessels of the centrum semiovale. Bodian silver stains at medium and high power show that the axonal processes are intact throughout the involved regions.

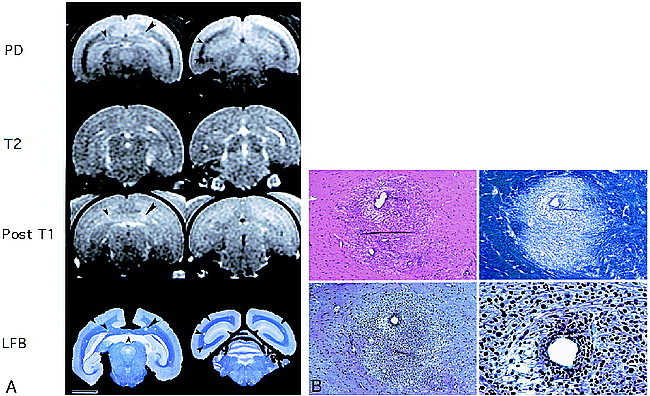
Imaging studies and histopathologic analysis of MP4–2 marmoset.
A, PD- (2500/20/2), T2- (2500/80/2), pre- and postcontrast T1-weighted images (450/13/4) (top to bottom, respectively), and the difference (post- minus precontrast T1-weighted) images are presented for marmoset MP4–2, for weeks 2.5, 4, and the 15-week terminal scan after EAE induction (left to right, respectively). The corresponding clinical scores were 2 for ataxia (week 1), 1 for weak right-hand grip (week 2), and 2 for slight ataxia (week 4). The clinical and MR scores are shown in figure 1, panel D. Little correlation existed between the MR-revealed lesions and clinical scores in this animal except for the lesion on the left side of the brain (week 2.5) and the concomitant right upper extremity weakness. A large enhancing lesion is seen in the left periventricular region, corresponding to a lesion in the same area on the T2- and PD-weighted scans at 2.5 weeks (arrowheads). The degree of enhancement can be appreciated in the difference image. By week 4 the lesion was no longer enhancing, but was visible on the PD- and T2-weighted images. By week 6 (not shown), and on the terminal scan, the lesion is no longer visible on the PD- or T2-weighted scans. The disappearance of this lesion corresponds to sparse histopathologic visibility in the anatomic region of the brain. Initially the lesion, although large in size, either did not progress to the point of demyelination or represented an area of remyelination. The only lesion present on histologic slices in the area of the large MR-revealed lesion at 2.5 weeks is minimally visible on the whole-brain mounts in figure 3B, and at higher-power magnification in figure 3C. (Scale bar equals 5 mm)
B, Luxol fast blue stained coronal section confirms that there is no demyelination. A small perivascular cuff (arrow) was the only lesion in this anatomic region located after multiple histology sections were taken through this block of brain tissue. This whole brain mount of marmoset MP4–2 corresponds to the terminal coronal scan in figure 3A and to the higher magnifications of this lesion (arrow) in figure 3C.
C, A single perivascular cuff of inflammatory cells is found at high magnification on the H&E-stained section (magnification, 400× [left]). The LFB-stained section (magnification, 400× [middle]) reveals intact myelin, and the bodian silver—stained section (magnification, 400× [right]) reveals intact axonal processes surrounding the only inflamed vessel. This lesion corresponds to the area where a large WM lesion was present at 2.5 weeks in figure 3A (arrow) and to the lesion present on the whole-brain mounts in figure 3B (arrow).

MR Imaging and histologic staining of marmoset HWM-2.
A, Two MR slices are presented for the preterminal PD- (2800/22/2), T2- (2800/110/2), and post T1-weighted contrast-enhanced (400/19/3) imaging sequences. LFB-stained histologic sections are below the corresponding MR brain slice. This marmoset had a clinical grade of 3 because of a paraparesis resulting presumably from lesions affecting the spinal cord motor tracts. A demyelinated lesion on the LFB-stained slice 1 on the right side of the corpus callosum (large arrowhead) matches the centrally hypointense and peripherally hyperintense lesion on the corresponding PD-weighted image and the enhancement on the postcontrast T1-weighted scan. This lesion measured 1 mm on the MR scan and histologic features of this lesion are shown in figure 4B. A smaller demyelinating lesion present on the left side of the corpus callosum of LFB-stained slice 1 (small arrowhead) is seen as a hyperintense area on the PD-weighted image and as an enhancing lesion on the postcontrast T1-weighted image (small arrowhead). This lesion was 0.5–0.75 mm in size. The enhancing corpus callosal lesion, although already demyelinated, has a persistent inflammatory infiltrate possibly representative of a chronic active lesion. The enhancing properties on the postcontrast T1-weighted images may reflect either active cytokine release mediating a BBB breakdown or permanent BBB integrity damage. The MR and clinical scores for this animal are presented in figure 1, Panel B. (Scale bar equals 5 mm)
B, The top left panel shows an H&E-stained section (magnification, 100× [top left]) of the right corpus callosal lesion (fig 4A, slice 1 [large arrowhead]) that has a dense perivascular mononuclear inflammatory cell collection and moderate infiltration of the surrounding parenchyma. In the top right panel, the LFB-stained section (magnification, 100× [top right]) of the same field reveals demyelination throughout the involved area. In the bottom panels, the bodian silver—stained section (magnification, 100× [bottom left]; magnification, 400× [bottom right]) was used to confirm that the axonal processes were relatively spared even when there was pronounced demyelination.
Contrast Enhancement
Contrast enhancement was associated primarily with periventricular white matter or at the gray-white matter junction. Contrast-enhancing lesions generally corresponded to lesions visible on PD- and T2-weighted images acquired during the same scanning session. Contrast-enhancing lesions were not observed in all animals despite the presence of new lesions on PD- and T2-weighted images. The time course of blood-brain barrier (BBB) opening was relatively short on postcontrast (<2 weeks) T1-weighted images (weeks 4–6, Fig 2A; weeks 2.5–4, Fig 3A). Nonetheless, enhancing lesions were occasionally detected on MT scans 1 to 2 weeks prior to being observed on postcontrast T1-weighted images (week 4, Fig 2A). EAE lesions observed on the postcontrast MT images would also persist up to 2 weeks after detectable enhancement on the postcontrast T1-weighted image (weeks 4–8, Fig 2A). Enhancing lesions were frequently more conspicuous on the postcontrast MT images than on the T1-weighted images. This occurred despite the fact that the MT images were obtained 1 to 2 minutes after administration of contrast medium, whereas the T1-weighted images were acquired after 10 to 15 minutes (weeks 4 and 8, Fig 2A). Approximately 44% of the enhancing lesions progressed to detectable demyelinating lesions. Enhancing MR lesions not seen on histologic sections may represent acute lesions that either did not demyelinate or underwent repair prior to euthanasia (Fig 3A–3C).
MR-Clinical Correlation
Clinical symptoms ranged from lethargy, weakness, hind-limb paresis to paralysis, weight loss, seizures, ataxia, anisocoria, decreased ocular function, and impaired body temperature regulation (Table 3). MR-revealed WM lesions were visible as early as 9 days after EAE induction in the optic tracts of one HWM-injected animal, and by 2.5 weeks in the cortical WM of the MP4-injected animals. Seven of nine animals in this study manifested neurologic deficits during the course of the study. Over the course of the disease, clinical symptoms were found in 73–86% of the HWM- and in 0.4–55% of the MP4-induced animals. In animals with discrete neurologic findings not associated with spinal cord disease (ie, anisocoria, weakness limited to one extremity) versus those with constitutional symptoms (ie, lethargy, weight loss), we were able to demonstrate a lesion that corresponded to the clinical symptom. Even though these animals demonstrated clinical concomitant symptoms with MR findings that correlated to clinical findings, the majority of lesions seen by MR imaging in this animal cohort were clinically silent.
Correlations of MR to clinical symptoms
MR-Histopathologic Correlations
Histopathologically revealed lesions and terminal MR scores are summarized in Table 4, and four sets of matching MR-pathologic slices are presented (Fig 2C, 3A–B, 4A, and 5A). Lesion detection by MR imaging on the T2- and PD-weighted scans was 60–100%. The extent of perivascular demyelination on the LFB stains ranged from no demyelination (Fig 3B and 5B, panel A), to a narrow perivascular margin of demyelination (Fig 2C and 5B, panel B), to extensive perivascular demyelination (Fig 4B, panel B; Fig 5B, panel C). Corresponding areas of WM signal intensity change on the PD- and T2-weighted images were associated either with perivascular inflammatory cuffing, demyelination (Fig 2C–D, 4A–B, 5A–B), or perivascular gliosis (not shown). Meningeal pathologic lesions in the animal in Figure 2A were not observed despite the contrast enhancement at week 2.5. Necrosis was not apparent in the demyelinated lesions, as evident by intact neuronal axons on Bodian silver stain (Fig 2D, 3C, 4B). Animals that developed frequent or prolonged enhancing lesions were more likely to present with demyelination or perivascular cuffing on histopathologic sections (eg, HWM-1, HWM-2, MP4–1). In contrast, those with WM lesions on PD- or T2-weighted images with only brief or no contrast enhancement were less likely to present with demyelination or perivascular cuffing on histologic sections (e.g., MP4–2 through MP4–7).
Correlations of MR imaging to histopathologic analysis

Imaging studies and histologic features found in marmoset HWM-1.
A, Preterminal PD- (3200/22/2) and T2-weighted (3200/110/2) MR brain images correspond to the LFB-stained whole-brain mount in the bottom row. On these slices focal lesions were present on the left side of the brain on the histopathologic and MR slices, whereas more confluent lesions were present on the right side of the brain (arrowheads). Histopathology for this animal is presented in figure 5B. The clinical and MR scores for this animal are presented in figure 1, panel A. (Scale bar equals 5 mm)
B, A histologic composite of LFB-stained lesions distributed throughout the CNS that is not confined to the LFB-stained whole-brain mount (fig 5A), is shown to demonstrate the disparity between lesion types that coexist in this model. The left panel reveals multiple perivascular inflammatory infiltrates with a well-delineated lack of LFB limited to the area of inflammation in the subcortical and deep WM. In these lesions, the inflammatory infiltrate is essentially within the Virchow-Robin space; thus, there is little, if any, true loss of myelin. The middle panel shows a more diffuse inflammatory infiltrate, again, around concentrically located vessels. In this panel the inflammatory infiltrate is minimally invasive to the parenchyma of the brain, with subsequent demyelination of the abutting axons. The right panel shows yet a more extensive inflammatory infiltrate surrounding centrally located vessels. The infiltrate extends well into the parenchyma with definite loss of myelin, giving the impression of patchy confluent lesions.
Histopathologic-Clinical Correlation
Correlations of histopathologically identified lesions to clinical symptoms are summarized in Table 5. Overall, the marmosets induced with HWM and CFA had more clinical and MR disease activity as compared to the marmoset induced with MP4 (Table 3). Moreover, the HWM-injected marmosets clearly showed more disease activity on the histopathologic level compared to the other animals studied (Table 4–5). The HWM-injected animals had gross demyelination in the spinal cord, which was not imaged. These spinal cord lesions most likely exacerbated the severity and progression of the animals' clinical course.
Correlations of histopathology to clinical symptoms
Discussion
Although EAE animal models are important in sorting out the pathogenesis of lesion development in autoimmune encephalomyelitis, not all models accurately reflect the histopathologic or relapsing-remitting clinical course of MS (62, 63). For example, EAE lesions in the guinea pig are primarily edematous and nondemyelinating, and the disease course is either acute or chronic progressive, depending on the strain of guinea pig and method of induction (44, 47, 49). The lesions in the rhesus and cynomolgus monkey are often hemorrhagic and necrotic, with the disease course acute or hyperacute, requiring corticosteroid and antibiotic treatments to avert the acute fatal disease into a more prolonged chronic progressive disease course (30, 53, 54, 64–67). EAE induction in rodents can be used to produce a variety of disease patterns including acute, chronic progressive, or relapsing-remitting. In the rodent, the patterns of EAE often manifest as inflammatory rather than demyelinating disease, confined primarily to the spinal cord and brain stem (23, 26, 34, 41, 68). To date, the evaluation of the pathogenesis of EAE and effects of new drugs in the rodent model has been limited to monitoring clinical symptoms and terminal CNS disease (3, 4). The larger animal models that can be scanned more easily, such as the guinea pig (24, 50) and macaque (54, 65, 67, 69–71), do not adequately reflect the clinical course or histopathologic features of relapsing-remitting MS.
In the marmoset, WM is restricted to the periventricular region because of the absence of cortical convolutions. In general, WM lesions were more distinct in the coronal than axial plane because of fewer partial volume effects of gray and white matter. Correlations of the histopathologic and MR data revealed that at a 3-mm slice thickness in the coronal plane, lesions of less than 1-mm diameter were difficult to detect unless enhancing lesions were present. Alternatively, several 0.5-mm lesions could be observed easily at 2-mm slice thickness. Detection of the smaller demyelinating lesions may be related to the amount of edema present in the lesion, making them more visible on the T2- and PD-weighted sequences. The depth of the lesion horizontally through the MR slice is likely to be more important in determining lesion visibility than lesion diameter because of the averaging over the depth of the image slice. T1-weighted hypointensities on the precontrast T1-weighted images were not observed in the marmoset most likely because of limitations in the spatial resolution and partial volume effects (72, 73). Of note, an average 280-g marmoset brain is approximately 33.9 mm long and 24.5 mm wide (74).
The observed variability in lesion development from different induction methods in this study is similar to the results of previous EAE marmoset studies that resulted in either demyelinating or inflammatory disease with minimal demyelination (57). In this study, HWM produced numerous extensive demyelinating lesions. Although EAE induced with MP4 produced visible WM lesions on the MR sequences used, MP4 induction was associated with fewer lesions, characterized by less extensive perivascular inflammation and perivascular demyelination, than HWM-induced histologically confirmed disease (see Table 4). Only one MP4-induced 9-year-old animal (MP4–4) with concomitant pyelonephritis was found to have extensive demyelination (Table 4). It is not clear if the pyelonephritis may have contributed to immune conditions that promoted more demyelination. Recent findings in a transgenic mouse model suggested that EAE induction required some type of immune stimulation such as that provided by a “dirty” environment (75).
Serial MR studies in relapsing-remitting MS have provided valuable insight into the natural history of this disease. In our study, important parallels were drawn between the natural history of MR-detectable lesions in the EAE marmoset model to that of the relapsing-remitting MS patient. Serial MR findings in the EAE-induced marmoset demonstrated that the presence and size of lesions fluctuate over time, similar to the natural history findings in early relapsing-remitting MS patients (5, 8–12, 15–20). WM lesions in the marmoset were dynamic in their distribution, size, and episodes of BBB compromise. Although MR imaging permitted recognition of new or persistent lesions by contrast enhancement, it did not permit lesion staging. BBB disruptions, as indicated by enhancement, were most often relatively short-lived (1- to 2-weeks' duration), and were observed in the majority of animals. A small minority of the enhancing lesions could be observed on postcontrast MT images for up to 5 weeks. As in MS patients, the majority of the BBB lesions correlated to abnormalities on PD- and T2-weighted images either in the same scanning study (week 6 and 15, Fig 2B; week 2.5, Fig 3A; or in the subsequent study (week 4 and 6, Fig 2A) (10, 13–17). Moreover, as in relapsing-remitting MS patients, enhancing and new WM lesions revealed by T2-weighted imaging in the marmoset were sometimes associated with clinical symptoms, but more frequently were clinically silent (8–11, 15–17, 20). This may occur because EAE lesions arising in areas of the WM are not evaluated easily by routine neurologic examination in the marmoset. HWM-induced EAE more closely correlated to the longitudinal human studies in terms of MR, clinical, and histopathologic information.
At 1.5 T, our ability to detect lesions in vivo was between 60–100% as compared to the 1:1 lesion-detection ratio of fixed brain tissue at 4.7 T (59). Lesion detection is improved by imaging ex vivo fixed tissue at higher field strengths with 1-mm slice thickness. This method provides a means for correlating terminal MR studies with pathologic brain lesions, and will be important for the development of sequences to stage lesions in vivo. This method, however, does not provide a means to evaluate lesion changes over a period of time in an animal cohort. Because of signal loss from smaller lesions, 2- to 3-mm MR slice thickness does not permit lesion counts as accurate as a 1-mm slice thickness. Results in MS patients have shown the value of thinner slices in determining WM lesion volumes (76, 77). Development of scanning sequences to distinguish lesion type and stage (ie, acute, active, chronic, gliotic, demyelinating, remyelinating) by MR will be necessary to improve our understanding of MS pathogenesis, and assess the effective range of therapeutic agents. For instance, a drug that inhibits new lesion formation, possibly through BBB stabilization, may not have any effect on chronic active lesions. Drugs that may promote remyelination may not inhibit formation of new enhancing lesions. Previous studies have shown that the marmoset model is valuable for preclinical evaluation of novel therapies (58). Our results demonstrate that serial MR studies are a necessary adjunct to clinical and histopathologic analysis for the adequate evaluation of brain lesion status in the EAE marmoset model, and that the MR findings and methods in this model are similar to those found and used in MS studies. The development of clinically silent EAE lesions in the marmoset represents a close correlate to clinically silent lesions in MS. Our ability to use this model for preclinical diagnostic and therapeutic evaluation will require investigation of drug effects on clinically silent lesions as well as lesions that precipitate clinical symptoms. Future directions to improve preclinical trials and the understanding of EAE pathogenesis by in vivo lesion staging will include development of new MR sequences and contrast agents to tag and differentiate cellular infiltrates.
Acknowledgments
Human white matter was generously provided by the Harvard Brain Tissue Resource Center, McLean Hospital, Belmont, Massachusetts. The inactivated pertussis vaccine was generously provided by Lederle-Pravis Biologicals, West Henrietta, New York. This work was supported in part by a collaborative research and development agreement between NIAID and Alexion Pharmaceuticals, New Haven, CT. We would also like to thank Dr. Jeff Duyn, LDRR, CC, NIH, for help in developing the MT sequence used for this work.
Footnotes
↵1 Address reprint requests to Joseph A. Frank, LDRR, CC, OIR, NIH, Bldg. 10, Rm. B1N256, Center Drive-MSC 1074, Bethesda, Maryland 20892-1074.
References
- Received January 20, 1998.
- Accepted after revision January 22, 1999.
- Copyright © American Society of Neuroradiology
In this issue


Jump to section
Related Articles
Cited By...
- Dissociation of Experimental Allergic Encephalomyelitis Protective Effect and Allergic Side Reactions in Tolerization with Neuroantigen
- Prevention of Experimental Autoimmune Encephalomyelitis in Common Marmosets Using an Anti-IL-12p40 Monoclonal Antibody
- Effective Antigen-Specific Immunotherapy in the Marmoset Model of Multiple Sclerosis