
Abstract
BACKGROUND AND PURPOSE: Subcortical signal intensity abnormalities and lacunar infarcts are the radiologic hallmark of cerebral autosomal dominant arteriopathy with subcortical infarcts and leukoencephalopathy. MR diffusion studies reveal abnormalities in lesions and also within normal appearing white matter. To further characterize the underlying pathologic abnormality, we evaluated the role of subvoxel free fluid in brain with cerebral autosomal dominant arteriopathy with subcortical infarcts and leukoencephalopathy on diffusion parameters and physical disability and analyzed the interrelation between diffusion variables and nonlacunar T2 lesion load.
METHODS: Mean diffusivity maps from fluid-attenuated and standard diffusion images of 13 patients with cerebral autosomal dominant arteriopathy with subcortical infarcts and leukoencephalopathy and seven age-matched control participants were compared by means of histogram analysis for three tissue compartments (whole brain parenchyma, normal appearing brain tissue, and nonlacunar lesions) by using a semiautomated region growing algorithm to define whole brain parenchyma and lesions on fluid-attenuated images.
RESULTS: In both patients and control participants, the average mean diffusivity of whole brain parenchyma was lower on fluid-attenuated than on standard images (P < .001). Average mean diffusivity and peak location for all compartments were significantly elevated in patients (P < .001) and higher for lesions than for normal appearing brain tissue on both types of images (P < .001). The difference between standard and fluid-attenuated average mean diffusivity of normal appearing brain tissue, reflecting the subvoxel free fluid content, was elevated in patients (P < .05) and correlated closely with the Rankin score (Spearman’s rank correlation coefficient = 0.889, P < .001). Average mean diffusivity of whole brain parenchyma and normal appearing brain tissue correlated strongly with the nonlacunar T2 lesion load (Pearson’s correlation coefficient = 0.743–0.928, P < .005).
CONCLUSION: This study shows that standard diffusion measurements are contaminated by free fluid partial volume effects for patients with cerebral autosomal dominant arteriopathy with subcortical infarcts and leukoencephalopathy and for control participants. It also provides evidence of a clinical significance of increased subvoxel free fluid in normal appearing brain with cerebral autosomal dominant arteriopathy with subcortical infarcts and leukoencephalopathy, which may be more important than either global atrophy, increased diffusivity or, T2 lesion load.
Cerebral autosomal dominant arteriopathy with subcortical infarcts and leukoencephalopathy (CADASIL) is an inherited angiopathy due to mutations in the NOTCH3 gene (1). Ischemic episodes and cognitive deficits are the predominant clinical presentations, but additional manifestations exist, including migraine with aura and mood disorders (2, 3).
MR imaging reveals two major types of subcortical signal intensity abnormalities (4–6): sharply demarcated regions that are isointense to CSF on T1- and T2-weighted images and less well demarcated T2-hyperintensities of variable extent. The latter are thought to reflect incomplete ischemic injury, whereas the former are compatible with lacunar infarcts. In addition, recent studies using more advanced neuroimaging techniques have provided evidence of subtle alterations in brain tissue that appears normal on T2-weighted images (7–9).
Previous MR imaging and autopsy studies have emphasized changes in the number of cellular elements, such as myelin, axons, and astrocytes, whereas little attention has been drawn to the role of free fluid. This entity of the brain may, however, provide important information. For instance, an increase of CSF is seen with the expansion of sulci and perivascular spaces associated with brain atrophy. Intracerebral free fluid further occurs in the context of focal tissue damage. These changes may be subtle and take place at the level of an image pixel. Hence, they are difficult to assess by means of conventional neuroimaging. In fact, unrecognized partial volume effects from free fluid are predicted to interfere with standard MR measurements, such as MR diffusion (10).
One approach to evaluate the contribution of free fluid on the scale of an image pixel (CSF partial volume effect) is to apply a fluid attenuation preparation before image acquisition. This step selectively suppresses the signal intensity from free fluid by exploiting the distinct relaxation behavior of free water (11). Combining this principle with MR diffusion measurements further allows a targeted assessment of ultrastructural tissue damage unaffected by partial volume effects from free CSF.
In the current study, we analyzed histograms from mean diffusivity maps of the whole brain parenchyma, normal appearing brain tissue, and nonlacunar T2 lesions by using fluid-attenuated and standard diffusion sequences. Histograms were generated after segmentation of macroscopic CSF. Our aims were to evaluate the contribution of free fluid at the level of an image pixel on measured diffusivity values and their relationship with physical disability and to investigate the interrelations between diffusion variables and nonlacunar T2 lesion load.
Methods
Patients
Thirteen patients with CADASIL and subcortical lesions shown by MR imaging were enrolled in the study (seven men and six women; mean age, 51.5 ± 8.5 years; age range, 35–64 years). All patients had positive results of skin biopsy showing characteristic ultrastructural basal membrane deposits (12). Mutational screening of exons 3 and 4 of the NOTCH3 gene revealed a deleterious mutation in nine patients. Clinical assessment was conducted on the day of the MR imaging study. Disability was graded by using the modified Rankin scale (13). Cognitive performance was assessed by using the Mini-Mental State Examination (14).
Seven age-matched healthy volunteers (three men and four women; mean age, 50.9 ± 12.9 years; age range, 28–63 years) served as control participants. All participants provided written informed consent in accordance with institutional guidelines.
MR Diffusion Measurements
MR imaging was performed on a 1.5-T clinical system (Signa Echospeed; General Electric Medical Systems, Milwaukee, WI) with a maximum available gradient strength of 22 mT/m. For diffusion imaging, a modified spin-echo echo-planar sequence (single shot; 2200/120 [TR/TE]; flip angle, 90 degrees; bandwidth, 83 kHz; field of view, 24 × 24 cm2) was used. A tetrahedral technique, as described by Conturo et al (15), was used. This technique allows the calculation of the average trace of the diffusion tensor and, by simultaneous switching all gradients, yields stronger diffusion weightings. Diffusion gradients in four different combinations of x, y, and z with b values of 330, 798, and 1320 s/mm2 were applied, resulting in 12 images per section. Twenty orthogonal transverse sections were obtained with a nominal resolution of 1.8752 × 4 mm3 and a 1-mm gap, thus allowing subtotal coverage of the brain from the level of the fourth ventricle upward (mean covered intracranial volume, 1229 ± 112 mL). To reduce partial volume effects from free fluid, a “dummy” acquisition was obtained before the actual image acquisition; it was used to differentially “prepare” the longitudinal magnetization of free water and parenchymal water exploiting differences in T1 relaxation times (16). Standard diffusion measurements using the identical protocol except for the dummy pulse were obtained in addition to the fluid-attenuated modification by using the same imaging geometry.
Data Processing
Image processing was performed offline by using IDL programs (Research Systems Inc., Boulder, CO). Three maps were calculated for both fluid-attenuated and standard acquisition modes: 1) mean diffusivity maps as the averaged diffusion trace 3, 2) approximately isotropic diffusion-weighted maps, and 3) T2-weighted (b0) maps.
A semiautomated threshold-based region growing algorithm was used for segmentation of hyperintense lesions on fluid-attenuated b0 images. Thresholds were individually determined based on the signal intensity of a manually traced region of interest in the normal appearing white matter and visually adapted within a range between meanNAWM + 2.5 and + 4 × SD by interobserver consent (D.B., D.P.A.). After manually selecting seed points for all T2 hyperintense lesions, all “connected” pixels with signal intensities above this threshold were segmented, resulting in a map of all lesions distinct from lacunes. To extract brain structures from extracerebral signal intensity, we applied a region growing algorithm on the mean diffusivity maps and manually traced and suppressed the remaining extracerebral structures.
For histogram analysis, three tissue classes were defined (Fig 1): 1) whole brain parenchyma as defined by all pixels with signal intensity above the noise threshold on fluid-attenuated b0 images, 2) T2 hyperintense lesions as defined by segmentation from fluid-attenuated b0 images, and 3) normal appearing brain tissue as pixels belonging to whole brain parenchyma but not lesions. The resulting masks were used to calculate three histograms of mean diffusivity maps. Because of the identical geometry, the segmentation masks derived from the fluid-attenuated diffusion measurements were additionally applied to the images of the standard sequence after correcting for in-plane motion between acquisitions (Fig 1). The volumes of whole brain parenchyma and nonlacunar T2 lesions were calculated from the corresponding masks (Fig 1B and D) and normalized to the intracranial volume (ie, the volume of the filled whole brain parenchyma masks). Nonlacunar T2 lesion load was defined as the normalized lesion volume/intracranial volume and the brain parenchyma ratio as whole brain parenchyma volume/intracranial volume.

Example of the segmentation procedure for macroscopic CSF and lesions distinct from lacunes.
A, Axial view image of the b0 map from fluid-attenuated data.
B, Mean diffusivity map from fluid-attenuated data obtained before segmentation.
C, Mean diffusivity map from standard data obtained before segmentation.
D, Mean diffusivity map from standard data obtained after segmentation for macroscopic CSF and lesions. The segmentation masks for macroscopic CSF and for lesions were obtained from the fluid-attenuated b0 maps (shown in A).
To correct for the between-patient differences in brain volume, each histogram was normalized by dividing it by the total number of pixels included. This way, the area under the histogram is made equal to unity for all participants, and thus comparisons of the features that characterize the shape of the histogram can be made between participants. For each histogram, we analyzed the position of the histogram peak with respect to the mean diffusivity axis and the average mean diffusivity value for standard and fluid-suppressed images (average mean diffusivitystand and average mean diffusivitysup).
Statistics
Statistical evaluation was conducted by using SPSS software, version 7.5 (SPSS for Windows). Reported values are means ± SD. Within-group comparisons between fluid-suppressed and standard images were assessed by using a Student’s t test for paired data. To test for a significant disease effect, a multivariate analysis of variance was used. Correlations were calculated by using the Spearman’s rank correlation coefficient, Pearson’s correlation coefficient (r), and the age-corrected partial correlation coefficient, as appropriate. To correct for multiple comparisons and to minimize the risk of type I errors, Bonferroni correction was applied to the t tests and correlation analysis for a nominal P < .05.
Results
All patients with CADASIL had developed symptoms that consisted of migraine with aura (n = 3), transient ischemic attacks or completed strokes (n = 12), or dementia (n = 2). The mean Rankin score was 1.4 ± 1.5, and the mean Mini-Mental score was 26.9 ± 3.6. All patients with CADASIL had white matter hyperintensities shown on the T2-weighted images. The mean lesion volume on the fluid-attenuated images was 107.0 ± 68.7 mL (range, 9.8–214.9 mL). None of the control participants had MR imaging signal intensity abnormalities above threshold. The mean intracranial volume covered and the brain parenchyma ratio were 1226 ± 117 mL and 0.92 ± 0.04, respectively, in patients and 1235 ± 110 mL and 0.96 ± 0.01, respectively, in control participants.
Comparison of Fluid-Attenuated and Standard Acquisition Modes
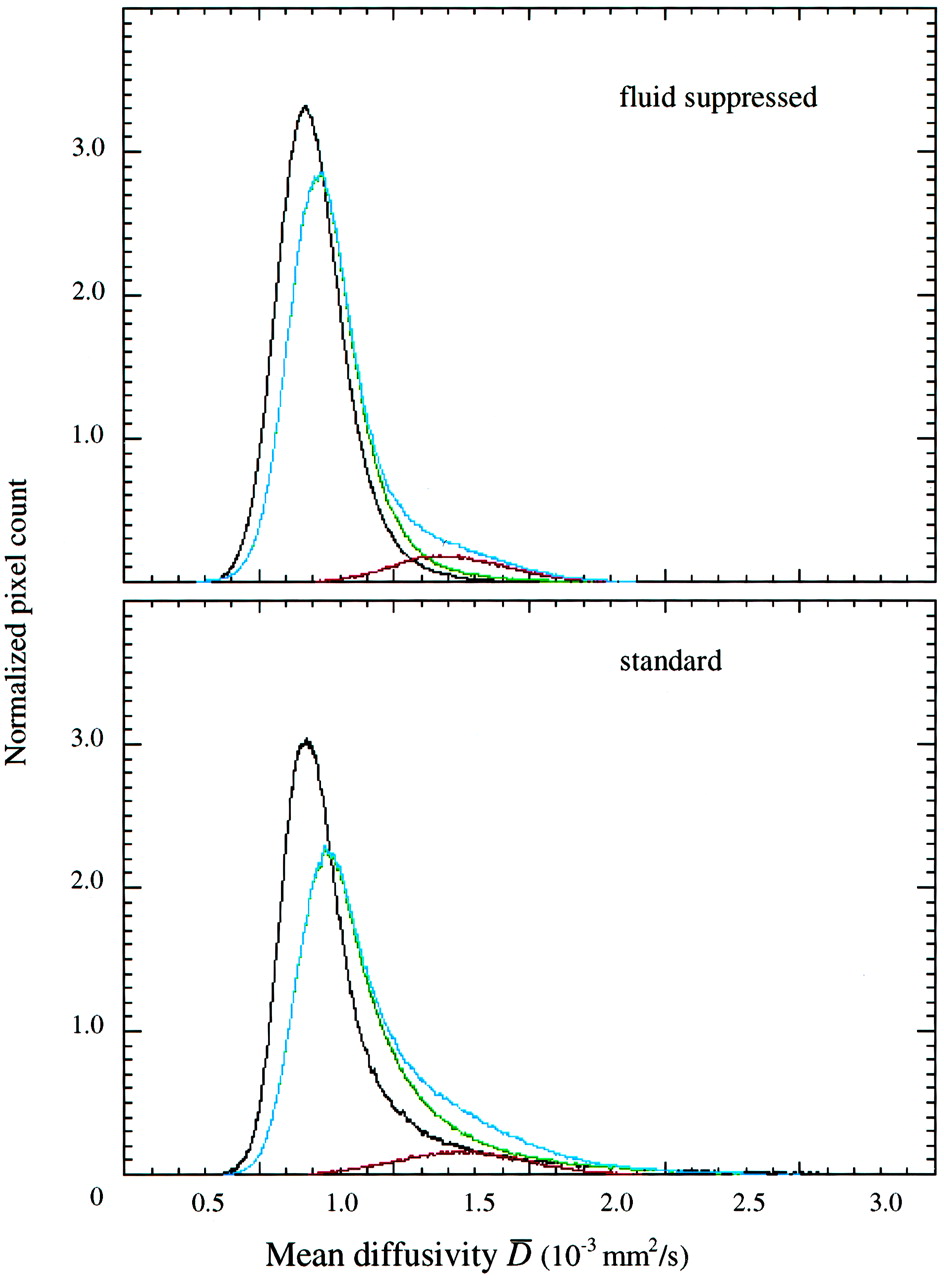
To evaluate the contribution of CSF partial volume effects to the diffusivity measured from standard data, we compared mean diffusivity histograms from fluid-attenuated and standard acquisition modes after separation of macroscopic CSF. Figure 2 illustrates a shift toward the left (ie, lower mean diffusivity on fluid-attenuated images, which was significant for average mean diffusivity for all compartments in patients and for whole brain parenchyma in control participants) (Table 1). The peak location was shifted to lower mean diffusivity values in whole brain parenchyma and normal appearing brain tissue in patients but not in control participants (Table 1).

Mean diffusivity histograms obtained from fluid-attenuated (upper panel) and standard (lower panel) data sets. Mean diffusivity histograms of whole brain (blue line), normal appearing brain tissue (green line), and lesions (red line) of patients with CADASIL and of control participants (black line). Standard histograms are broader with a pronounced asymmetry toward higher values of mean diffusivity.
Mean diffusivity histogram-derived measures obtained from fluid-attenuated and standard data sets of patients with cerebral autosomal dominant arteriopathy with subcortical infarcts and leukoencephalopathy and healthy control participants
Comparison between Patients with CADASIL and Control Participants
To assess disease-related differences, mean diffusivity histogram-derived metrics and measures for macroscopic free fluid (brain parenchyma ratio) and subvoxel free fluid effects (Δ average mean diffusivity: mean diffusivitystand − average mean diffusivitysup) were subjected to a multivariate analysis of variance design using age as a covariate. A significant disease effect (Wilks-Lambda, df = 8, F = 8.302, P = .002) and age covariate effect (Wilks-Lambda, df = 8, F = 3.095, P = .049) were observed. Univariate F tests attributed the group effect to significant differences between peak positions and average mean diffusivity for whole brain parenchyma and normal appearing brain tissue for both image types (F = 24.3–36.4, P < .001) and brain parenchyma ratio (F = 5.284, P = .034) and Δ average mean diffusivity for normal appearing brain tissue (F = 5.340, P = .034), whereas Δ average mean diffusivity for whole brain parenchyma failed to reach significance (F = 2.802, P = .102). Age significantly affected Δ average mean diffusivity (whole brain parenchyma and normal appearing brain tissue, F = 15.314 and 14.175, P = .001 and 0.002, respectively) and average mean diffusivitystand for whole brain parenchyma (F = 4.925, P = .040).
Clinical Correlates
To evaluate the clinical significance of mean diffusivity histogram metrics and free fluid measures, we correlated the Rankin disability score with average mean diffusivity (standard and fluid suppressed and Δ) for whole brain parenchyma and normal appearing brain tissue and brain parenchyma ratio (Table 2). Average mean diffusivitystand for normal appearing brain tissue was positively correlated (P = .004) (Table 2) with disability, whereas average mean diffusivitystand for whole brain parenchyma and brain parenchyma ratio were marginally associated (Spearman’s rank correlation coefficient = 0.66 and −0.542, P = .014 and 0.056, respectively, not significant after Bonferroni correction). Δ Average mean diffusivity was strongly correlated with the Rankin disability score for whole brain parenchyma and normal appearing brain tissue (both, P < .001) (Fig 3, Table 2). When correcting for age, Δ average mean diffusivity remained significantly correlated (whole brain parenchyma, partial correlation coefficient = 0.894; normal appearing brain tissue, partial correlation coefficient = 0.834; P < .001), but average mean diffusivitystand for normal appearing brain tissue failed to reach the adjusted significance level (partial correlation coefficient = 0.636, P = .026). Because brain atrophy can be expected to enhance CSF partial volume effects and hence elevate Δ average mean diffusivity, a direct relationship with brain parenchyma ratio was tested for but not observed (r = −0.280, not significant). Because of the limited spectrum of cognitive test results (11 patients had Mini-Mental State Examination scores ≥25 and did not fulfill the clinical criteria for dementia), we refrained from analyzing correlations between diffusion variables and cognitive test results.

Scatterplot of the difference between average mean diffusivity from standard and fluid-suppressed histograms (Δ average mean diffusivity) for whole brain parenchyma versus physical disability (Rankin score).
Correlations between mean diffusivity histogram-derived measures and Rankin disability score and T2 lesion load in patients with cerebral autosomal dominant arteriopathy with subcortical infarcts and leukoencephalopathy
Correlations between Average Mean Diffusivity and T2 Lesion Volume
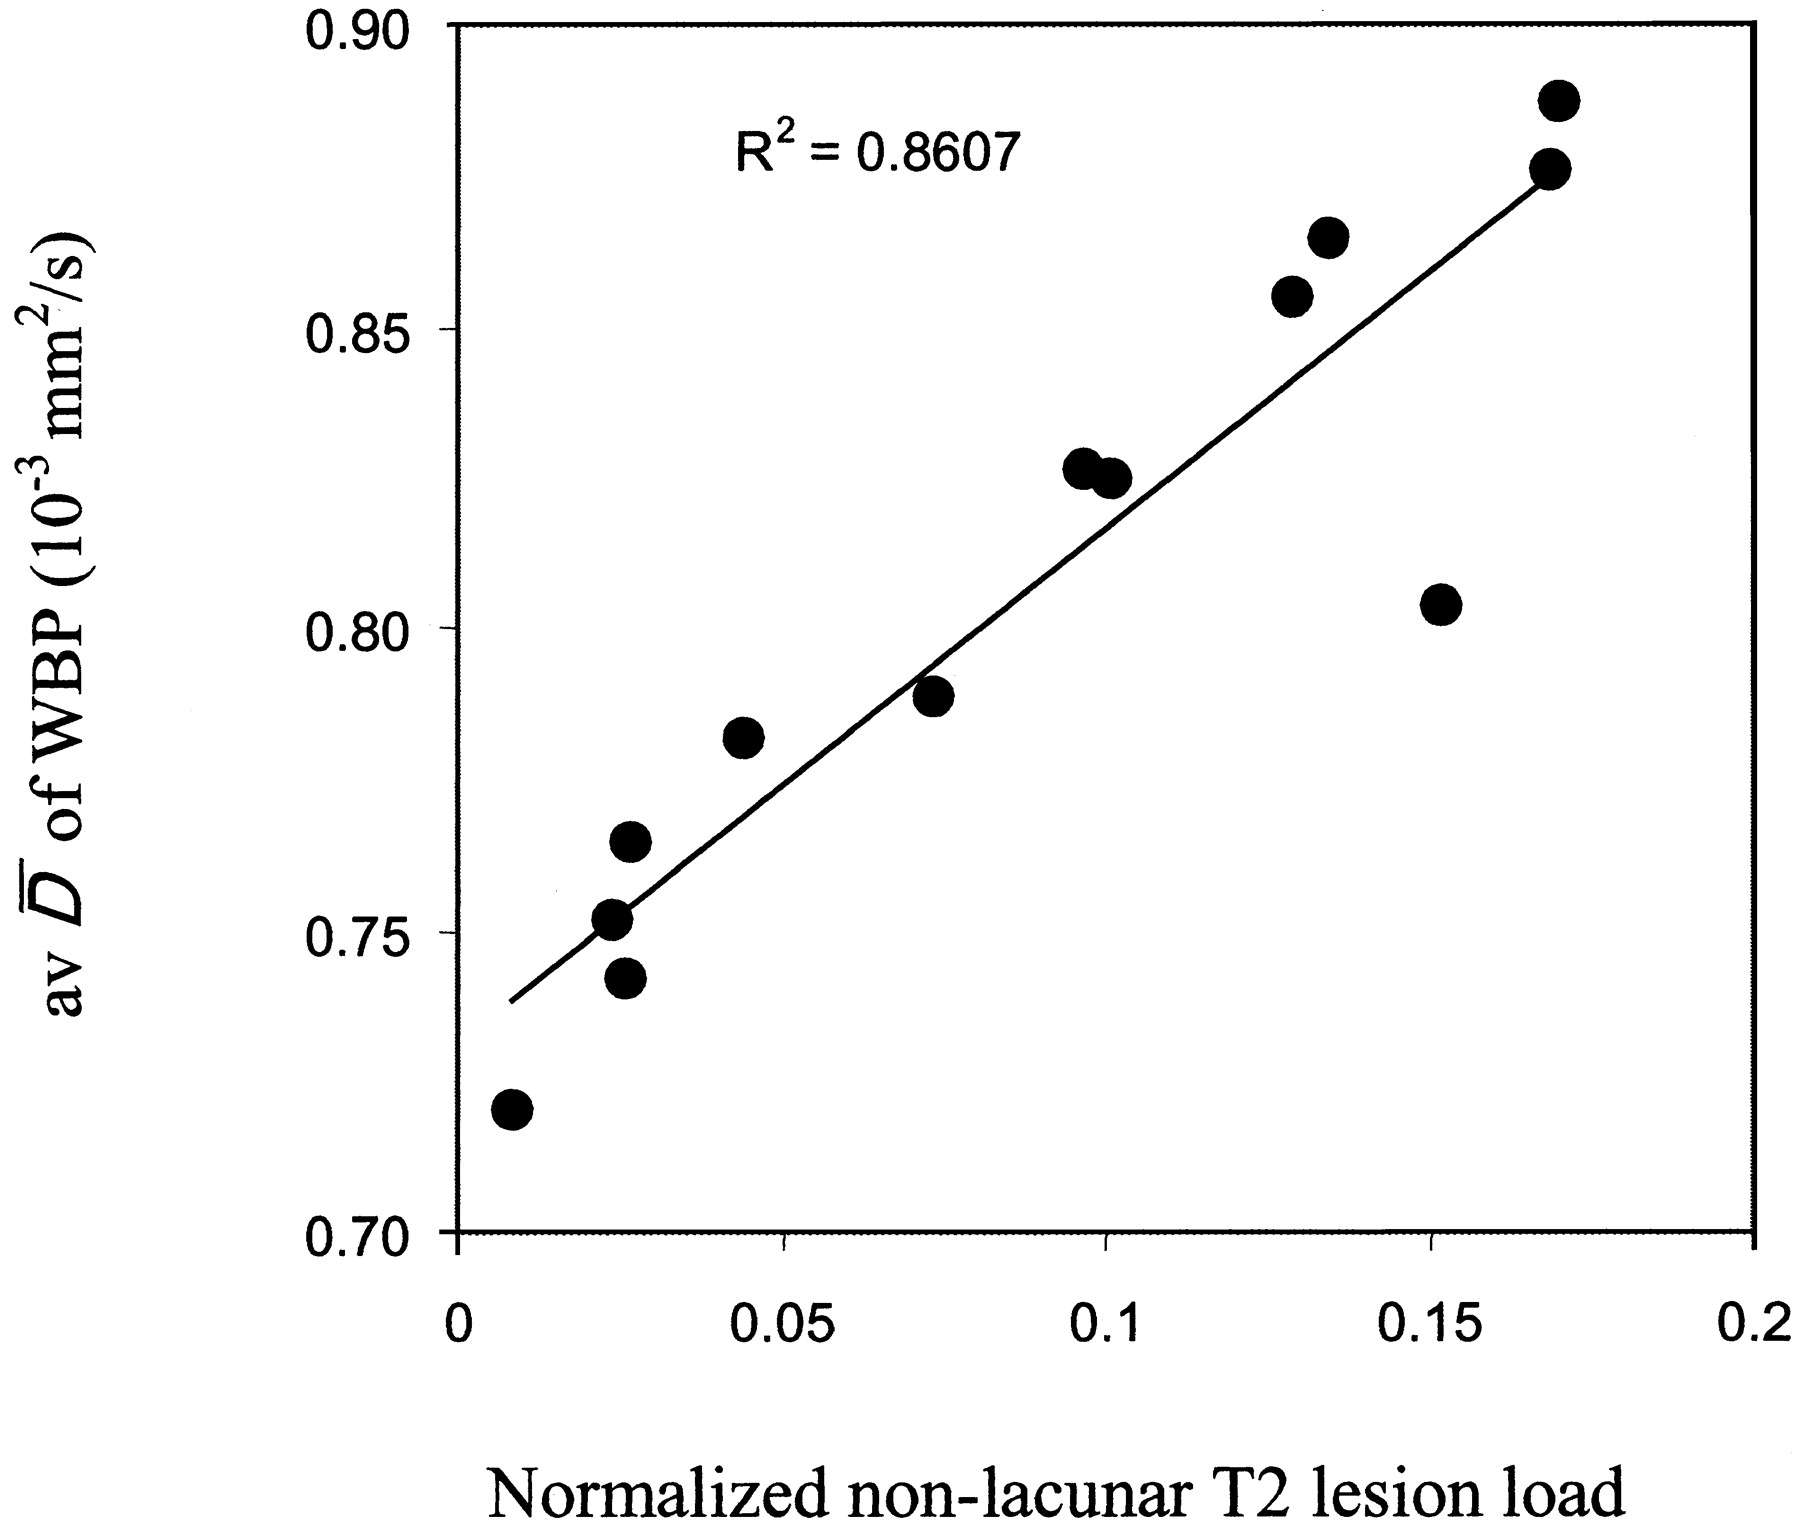
To further explore interrelations between increased diffusivity in brain with CADASIL and the prominent pathologic process (ie, the development of T2 lesions), we correlated average mean diffusivity for whole brain parenchyma and normal appearing brain tissue with the normalized nonlacunar T2 lesion load and found consistently strong and positive associations with the closest correlation for average mean diffusivitysup of whole brain parenchyma (r = 0.928, P < .001) (Table 2, Fig 4).

Scatterplot of average mean diffusivity from fluid-attenuated images of whole brain parenchyma versus the normalized volume of nonlacunar T2 lesions in patients with CADASIL.
Discussion
Our finding of increased diffusivity values on standard compared with fluid-attenuated images reflects the presence of partial volume effects from subvoxel free fluid on standard images. The high mean diffusivity value of free water (approximately 3.0 × 10⁻³ mm2/s) explains that even small partial volume effects of free fluid translate into an increase of the observed average mean diffusivity.
Peak locations for normal appearing brain tissue with CADASIL were significantly higher on standard compared with fluid-attenuated images, whereas they did not differ significantly for the normal brains (Table 1). Also, the difference between average mean diffusivity from standard and fluid-attenuated sequences was larger in normal appearing brain tissue with CADASIL than in normal brains. These findings indicate an increased subvoxel free fluid content in normal appearing brain tissue with CADASIL. This agrees well with a recent MR spectroscopy study that provided indirect evidence of increased water content within brain tissue with CADASIL (9). Two potential sources of partial volume effects from free fluid exist: free fluid at the brain surface (eg, CSF within sulci) (Fig 1) and free fluid contained within brain tissue. We observed a decrease in brain parenchyma ratio, which is well in line with autopsy studies that have shown brain atrophy (17). Conceivably, atrophy results in a relative enlargement of the brain surface and therefore may enhance partial volume effects. However, no direct association was found between brain parenchyma ratio and the difference between average mean diffusivity from standard and fluid-attenuated sequences, ruling out a major contribution from this source. This leaves free fluid contained within tissue as an important cause of the observed partial volume effects. Postmortem studies found prominent widening of the perivascular spaces and microscopic cavities (18, 19) that were widely distributed throughout the brain and could well explain our findings.
Although preliminary, considering the small sample size, our results suggest a clinical significance of increased subvoxel free fluid. First, average mean diffusivity from standard images was found to correlate with physical disability whereas no such correlation was found for the fluid-attenuated acquisition mode on which the signal intensity from free fluid is suppressed. Second, the difference in average mean diffusivity obtained from the two protocols strongly correlated with physical disability. Third, after correcting for age effects, only Δ average mean diffusivity remained significant. Thus, it seems that an increase in subvoxel free fluid is clinically important. Our data further suggest that combining information from standard and fluid-suppressed images may be valuable when studying correlations with clinical data.
Elevated subvoxel free fluid reflects volume loss of brain tissue at the microscopic level. Some analogy to the macroscopic loss of brain tissue exists. Brain atrophy has been shown to be an independent predictor of clinical variables in sporadic small vessel disease (20, 21). Moreover, macroscopic MR imaging measures like the brain parenchyma ratio are increasingly used as a surrogate marker of disease progression in patients with white matter disease (22, 23). The macroscopic CSF spaces are, however, subject to considerable non-disease-related variation, and it is therefore not surprising that in our study, subvoxel free fluid effects correlated much better with disability than with brain parenchyma ratio.
The increased diffusivity observed on fluid-attenuated images suggests ultrastructural tissue damage beyond partial volume effects from free fluid, thereby extending findings from a previous MR diffusion study that used standard sequences only. The combined data from the standard and fluid-attenuated measurements suggest that there are two different sources of increased diffusivity in brain tissue with CADASIL: partial volume effects from spaces filled with free fluid and more subtle tissue alterations, such as mild demyelination that affect the fraction of protein-bound water (24).
The observed variations of mean diffusivity within lesions suggest variable degrees of ultrastructural tissue damage within nonlacunar lesions. This finding extends the results of previous studies that found variable diffusivity (7), T1-signal intensity signal intensity (4, 5), magnetization transfer ratios (8), and metabolic changes (9) within T2-visible lesions. It also agrees with autopsy data evidencing various degrees of demyelination, axonal loss, and gliosis in brain with CADASIL.
We also obtained mean diffusivity histograms of normal appearing brain tissue only, by removing from the mean diffusivity maps all pixels known to belong to T2-visible lesions. We found, that average mean diffusivity and peak locations in normal appearing brain tissue with CADASIL were higher than in whole brain parenchyma from control participants. Furthermore, average mean diffusivity and peak locations of lesions were higher than in normal appearing brain tissue. This confirms that the normal appearing brain tissue is also affected and that CADASIL pathologic abnormality is diffuse, albeit more severe within than outside T2-visible lesions (8). The observed close correlation between average mean diffusivity of normal appearing brain tissue and the volume of lesions suggests that the changes within normal appearing brain tissue may be directly related to the pathology of lesions. Obviously, Wallerian degeneration could account for such association. A role of Wallerian degeneration in CADASIL has been suggested by two recent MR imaging studies that found ultrastructural changes in the spinal cord and thalamus (25, 26). However, microscopic changes in the normal appearing brain tissue might as well occur as an independent but largely synchronous manifestation of the underlying vasculopathy.
In conclusion, this study shows that standard diffusion measurements are contaminated by free fluid partial volume effects in patients with CADASIL and in control participants. Using fluid-attenuated imaging, ultrastructural tissue damage independent of CSF partial volume effects is suggested in a large proportion of brain tissue with CADASIL. The study also provides evidence of a clinical significance of increased subvoxel free fluid in normal appearing CADASIL brain, which may be more important than global atrophy, increased diffusivity, or T2 lesion load. Additional studies in a larger number of patients are warranted to assess the role of subvoxel free fluid in small vessel disease and other white matter diseases.
Acknowledgments
The authors thank Thomas Gasser for continuous support with the mutational screening, Bernadette Lipinski for software development (region growing algorithm), and Richard Jones for providing the pulse sequence and software with which to derive apparent diffusion coefficient maps.
References
- Received July 9, 2002.
- Accepted after revision December 18, 2002.
- Accepted after revision December 18, 2002.
- Copyright © American Society of Neuroradiology
In this issue


Jump to section
Related Articles
Cited By...
- Brain Volume and Diffusion Markers as Predictors of Disability and Short-Term Disease Evolution in Multiple Sclerosis
- Lacunar lesions are independently associated with disability and cognitive impairment in CADASIL
- Diffusion Magnetic Resonance Histograms as a Surrogate Marker and Predictor of Disease Progression in CADASIL: A Two-Year Follow-Up Study