
Abstract
BACKGROUND AND PURPOSE: The MR imaging characteristics of oligodendrogliomas and astrocytomas on spin-echo (SE), echo-planar relative cerebral blood volume (rCBV) maps, to our knowledge, have not previously been emphasized. We compared the specificity of SE rCBV mapping with that of conventional, contrast material–enhanced MR imaging in differentiating high- from low-grade glial tumors and in predicting survival of patients with these lesions.
METHODS: Thirty consecutive adult patients with suspected gliomas underwent conventional and rCBV MR imaging. Representative maximal rCBV regions of interest were chosen from each lesion. Resultant values were normalized to those of corresponding, contralateral, uninvolved regions. These normalized CBV (nCBV) values were correlated with degree of contrast enhancement, histopathologic tumor grade, and survival.
RESULTS: Twenty-two patients had astroctyomas and eight had oligodendrogliomas. With an nCBV cutoff ratio of 1.5, 13 of 13 high-grade astrocytomas were correctly categorized, three of which did not enhance. Seven of nine low-grade astrocytomas were correctly classified by their nCBV values, including one enhancing lesion. Of eight oligodendrogliomas, four of four high-grade and two of four low-grade tumors had elevated nCBV values; two low-grade oligodendrogliomas enhanced, one with nCBV greater than 1.5 and one with nCBV less than 1.5. In 19 patients with astrocytoma for whom survival data were available, correlation with survival was better for nCBV (mean survival 91 ± 14 months for nCBV < 1.5 versus 24 ± 27 months for nCBV > 1.5, P < .0001) than for enhancement (mean survival 61 ± 35 months without enhancement versus 22 ± 29 months with enhancement, P = .03).
CONCLUSION: Elevated SE rCBV was a sensitive, but not specific, marker for high-grade histopathology: all high-grade tumors had nCBV foci values greater than 1.5. No tumor with nCBV region of interest less than 1.5 was high grade (100% predictive value for excluding high grade). Degree of nCBV elevation was a stronger predictor of both tumor grade and survival than was degree of enhancement. A significant proportion of low-grade glial neoplasms, most notably oligodendrogliomas, may display high rCBV foci not reflective of high-grade histopathology.
Gliomas of the adult cerebral hemispheres are typically classified into one of the following three World Health Organization (WHO) grades: low grade (grade II), anaplastic (grade III), or glioblastoma (grade IV) (1, 2). Vascular endothelial proliferation of these lesions correlates with aggressive clinical behavior (3–7). Several studies have demonstrated, however, that the contrast material enhancement characteristics of astrocytomas are only weakly predictive of tumor grade; as many as 75% of anaplastic astrocytomas fail to enhance on conventional MR images after administration of a gadolinium-based contrast material (8–10).
Both dynamic susceptibility spin-echo (SE) and gradient-echo (GRE) MR perfusion imaging have shown promise in grading astrocytomas based on their relative cerebral blood volume (rCBV), although the use of SE rCBV imaging has not been as well emphasized in the literature (11–15). Although SE rCBV imaging is selectively sensitive to signal intensity changes from the microvasculature (ie, capillary level blood volume), GRE rCBV imaging is sensitive to signal intensity changes from the larger vessels as well (15–18). Not surprisingly, mean maximum rCBV values for anaplastic astrocytomas and glioblastoma have been reported to be higher with GRE as compared with SE MR acquisition protocols, likely related to the higher sensitivity of the GRE technique for detection of shunt vascularity (12, 15, 19, 20).
Although the use of GRE rCBV imaging for the clinical evaluation of astrocytomas has received much attention, the rCBV imaging characteristics of oligodendrogliomas have not been as well described; it is possible that SE rCBV maps might be less likely than GRE maps to display “falsely” elevated values within low-grade brain tumors because of draining veins and shunt vascularity (13, 14). This could result in less overlap between the rCBV values of low- versus high-grade tumors and might be especially relevant in the evaluation of low-grade oligodendrogliomas, which are more highly vascular and metabolically active than low-grade astrocytomas, despite their more indolent clinical behavior (21–24). Our purpose, therefore, was to compare the accuracy of SE rCBV mapping with that of conventional gadolinium-enhanced MR imaging in grading glial line tumors, including both astrocytomas and oligodendrogliomas, with regard to both excluding high-grade histopathology and predicting survival.
Methods
Subjects
Forty-six consecutive patients who underwent rCBV MR imaging as part of their initial evaluation for clinically suspected glioma of the cerebral hemispheres were identified. Of these, 30 met the entry criteria of histopathologic diagnosis of astrocytoma or oligodendroglioma, digital data from conventional and rCBV MR imaging available for review, and no treatment or biopsy, including glucocorticoids, before data acquisition. Of the 16 excluded patients, 14 exclusions were due to incomplete or missing data sets, including lack of a pretreatment or prebiopsy rCBV study. There were only two nonglial line tumors in this group, a lymphoma that had been treated with steroids before rCBV imaging and a gray matter heterotopia that was followed clinically rather than undergoing biopsy. Two additional patients were excluded because of nonglial cell pathologic conditions, one with metastases from a known primary and one with a meningioma; glioma was not included in the differential diagnosis for either of these lesions. The 30 study patients ranged in age from 12 to 87 years (mean, 48 ± 17 years) and included 17 male and 13 female patients. The Subcommittee on Human Studies at the Massachusetts General Hospital approved the study, and informed consent was obtained from all the study subjects.
Characterization of intracranial masses as low-grade (astrocytoma or oligodendroglioma, WHO grade II) or high-grade (anaplastic astrocytoma, anaplastic oligodendroglioma, or anaplastic oligoastrocytoma, grade III; and glioblastoma, grade IV) was achieved by histologic examination (29 cases) or long-term clinical follow-up (one case, presumed low-grade astrocytoma). The time interval between rCBV imaging and biopsy ranged from the same day to 29 days (mean, 6 ± 8 days) for the high-grade lesions (17 cases), and from the same day to 1.5 years (mean, 67 ± 144 days) for the low-grade lesions (12 cases); in one additional low-grade case the patient was imaged 3.7 years before eventual biopsy. The single lesion with only clinical follow-up to date was considered low grade, as absolutely no change was seen in the imaging characteristics of the tumor on prior and/or follow-up routine MR images over a time period, without treatment, of more than 1 year. Survival time ranged from the same month to 56 months (mean, 18 ± 16 months) for high-grade lesions, and from 18 months to 103 months (mean, 61 ± 33 months) for the low-grade lesions.
MR Imaging
All MR imaging was performed with a 1.5-T GE Signa MR system (General Electric Medical Systems, Milwaukee, WI) retrofitted for echo-planar (EP) capability. Conventional brain MR imaging consisted of sagittal T1-weighted, axial dual fast SE T2-weighted, and, after the dynamic EP acquisition, contrast-enhanced axial and coronal T1-weighted imaging. Only a single bolus of contrast material (Magnevist; Berlex, Montville, NJ) was administered for each examination. Ten axial section levels (6–8 mm thick, 1–2 mm skips) were chosen for EP imaging, based on lesion extent as determined by the precontrast T2-weighted images. Before imaging, an 18-gauge catheter was inserted into a peripheral vein. Axial T2-weighted, SE, EP images were acquired by using the following parameters: 1500/75 (TR/TE), frequency R/L, 256 × 128 matrix, field of view 40 × 20 cm, auto shim off. Fifty-one sequential images per section, for each of the 10 sections (or, in a few cases, 46 images per section for 11 sections), were acquired during 1 minute 23 seconds. Intravenous administration of a gadolinium-based contrast agent through the antecubital vein, at a 5-mL/s injection rate, 0.2 mmol/kg dosage (twice the routine clinical contrast material dose), followed by a 12-mL saline flush, was accomplished by using a prototypic MR-compatible power injector. Contrast material delivery was delayed 16 seconds from the start of EP imaging, so that a baseline sequence of images could be obtained.
The rCBV maps were generated from the resultant EP data sets, by using a methodology well described in the literature (11, 25). Briefly, the change in T2 relaxation rate (ΔR2) versus time curve for each pixel in each imaged section was integrated, after application of an appropriate correction algorithm discussed below, from a time 2 seconds before injection, through to the end of image acquisition. The ΔR2 was defined as –ln (S/S0)/TE, where S represents signal intensity, and the baseline signal intensity value, S0, is obtained by averaging the precontrast signal intensities for a given pixel after discarding the first two of the 51 sequential MR images obtained for each section. ΔR2 has been shown to be approximately linearly proportional to the concentration of contrast material in tissue (26). Our rCBV maps are routinely constructed by using a mathematic correction algorithm, to compensate for the confounding effects of high permeability, “leaky,” regions of severe blood-brain barrier breakdown, frequently present in necrotic tumor and irradiated tumor beds (18). An additional strategy to correct for “leakiness,” used in this study, has been the administration of a small (4–6 mL, depending on patient weight) dose of contrast material just before map acquisition. Theoretically, this “presaturates” the peritumoral interstitium in regions of severe blood-brain barrier breakdown, reducing the distorting effects of subsequent contrast material “leakage” relative to the baseline T2 signal intensity of such regions (26).
Review of both the conventional MR images and the calculated rCBV maps was performed by consensus interpretation by two board certified neuroradiologists (M.H.L., G.D.B.) who were blinded to the tissue diagnosis. On the rCBV maps, three representative 4 × 4-pixel regions of interest, with the lowest possible standard deviation between adjacent pixels, were chosen from areas with the greatest visually identifiable rCBV values. This was achieved by repeatedly moving the 4 × 4-pixel region of interest, until an appropriate region was located; care was taken to avoid volume averaging through blood vessels or CSF-filled sulci or cisterns. The mean value of these three maximal regions of interest was recorded for each case. The same method was applied for a corresponding location at the contralateral, uninvolved side, and the normalized CBV (nCBV) ratio was computed, for each case, as the ratio of the mean maximal rCBV of the tumor divided by the mean maximal rCBV of the corresponding contralateral area.
Statistical Analysis
Statistical analysis was performed by using the Excel (Microsoft, Bellevue, WA) and SAS statistical packages (SAS Institute Inc., Cary, NC). One-tailed t tests assuming unequal variances for the survival data were considered significant for P values less than .05. Kaplan-Meir survival curves were generated with SAS software by using exponential regression modeling; data for those patients still alive at the time of most recent follow-up were appropriately censored. Binormal receiver operating characteristic (ROC) curves were constructed by using various cutoff values to distinguish low- from high-grade astrocytomas alone, and for astrocytomas and oligodendrogliomas grouped together. The areas under these respective ROC curves, a measure of diagnostic accuracy, were calculated and compared by using the program CLABROC, which covers continuous data (software developed by Metz CE at the Kurt Rossmann Laboratories for Radiologic Image Research, University of Chicago, downloadable at: http://xray.bsd.uchicago.edu/krl/KRL_ROC/software_index.htm).
Results
Thirteen astrocytomas were high-grade (WHO grades III/IV and IV/IV) and nine were low-grade (WHO grade II/IV). There were two high-grade oligodendrogliomas, two high-grade oligoastrocytomas, and four low-grade oligodendrogliomas. The average maximal lesion diameter on nonenhanced T1-weighted images was 3.6 ± 1.16 cm (range, 1.25–5.5 cm).
All 13 high-grade astrocytomas were correctly categorized as high grade (100%), by using an arbitrary nCBV cutoff ratio of 1.5 (Fig 1). Three of these high-grade tumors (23%) did not significantly enhance with contrast administration, despite the presence of an elevated nCBV. Of the nine low-grade astrocytomas, seven (78%) were correctly classified on the basis of nCBV values less than 1.5. Of the seven low-grade astrocytomas with nCBV ratios less than 1.5, one (14%) enhanced with contrast material. High-grade oligodendrogliomas and oligoastrocytomas demonstrated nCBV greater than 1.5 in all four cases (100%). Of the four patients with low-grade oligodendrogliomas, two had nCBV less than 1.5; however, the other two had nCBV ratios greater than 1.5, including one with a ratio of 4.4, which was significantly elevated compared with that of several of the high-grade tumors. Two of the low-grade oligodendrogliomas showed enhancement, one with nCBV greater than 1.5 and one with nCBV less than 1.5. One of the high-grade oligodendrogliomas demonstrated equivocal enhancement; the remaining three did not enhance. These results are summarized graphically in the scatterplot of Fig 1, with nCBV on the y axis, tumor histologic diagnosis on the x axis, and enhancing lesions so indicated.

Scatterplot of maximum nCBV (mean normalized rCBV region-of-interest) values versus glial tumor grade. The degree of contrast enhancement on conventional T1-weighted MR images is indicated for each data point. Note that seven (41%) of the 17 high-grade tumors had absent or equivocal enhancement, whereas three (23%) of the 13 low-grade tumors had definite enhancement. At an nCBV cutoff value of 1.5 (horizontal line), no high-grade lesions were incorrectly classified as low grade (100% predictive value for excluding malignancy).
The average nCBV for the astrocytomas and oligodendrogliomas combined was 1.5 ± 1.1 for the low-grade tumors and 2.9 ± 1.5 for the high-grade tumors (P < .01) (Figs 2 and 3). No high-grade tumor had an nCBV less than 1.5. Excluding oligodendrogliomas, the mean nCBV values were 3.1 ± 1.7 for the high-grade tumors and 1.3 ± 0.6 for the low-grade tumors (P < .01). Oligodendrogliomas, without respect to tumor grade, tend to be high blood volume lesions; of the eight oligodendrogliomas, four of four high-grade and two of four low-grade tumors had elevated nCBV values (Figs 4 and 5).

61-year-old man with grade II astrocytoma.
A and B, Axial T2-weighted (A) and contrast-enhanced T1-weighted (B) images demonstrate a mass (arrow) in the left medial temporal lobe that is hyperintense on the T2-weighted image and hypointense, nonenhancing on the T1-weighted image.
C, Correlative rCBV map shows diminished blood volume relative to both gray and white matter in this biopsy-proved low-grade astrocytoma.

39-year-old man with grade IV glioma.
A and B, Axial contrast-enhanced T1-weighted (A) and rCBV (B) images through the level of the lateral ventricles demonstrate an enhancing mass. There is elevated blood volume relative to both normal gray and white matter, consistent with biopsy-proved high-grade glioma (arrow). Note the decreased blood volume in the white matter immediately surrounding the lesion, secondary to the space-occupying effects of vasogenic edema.

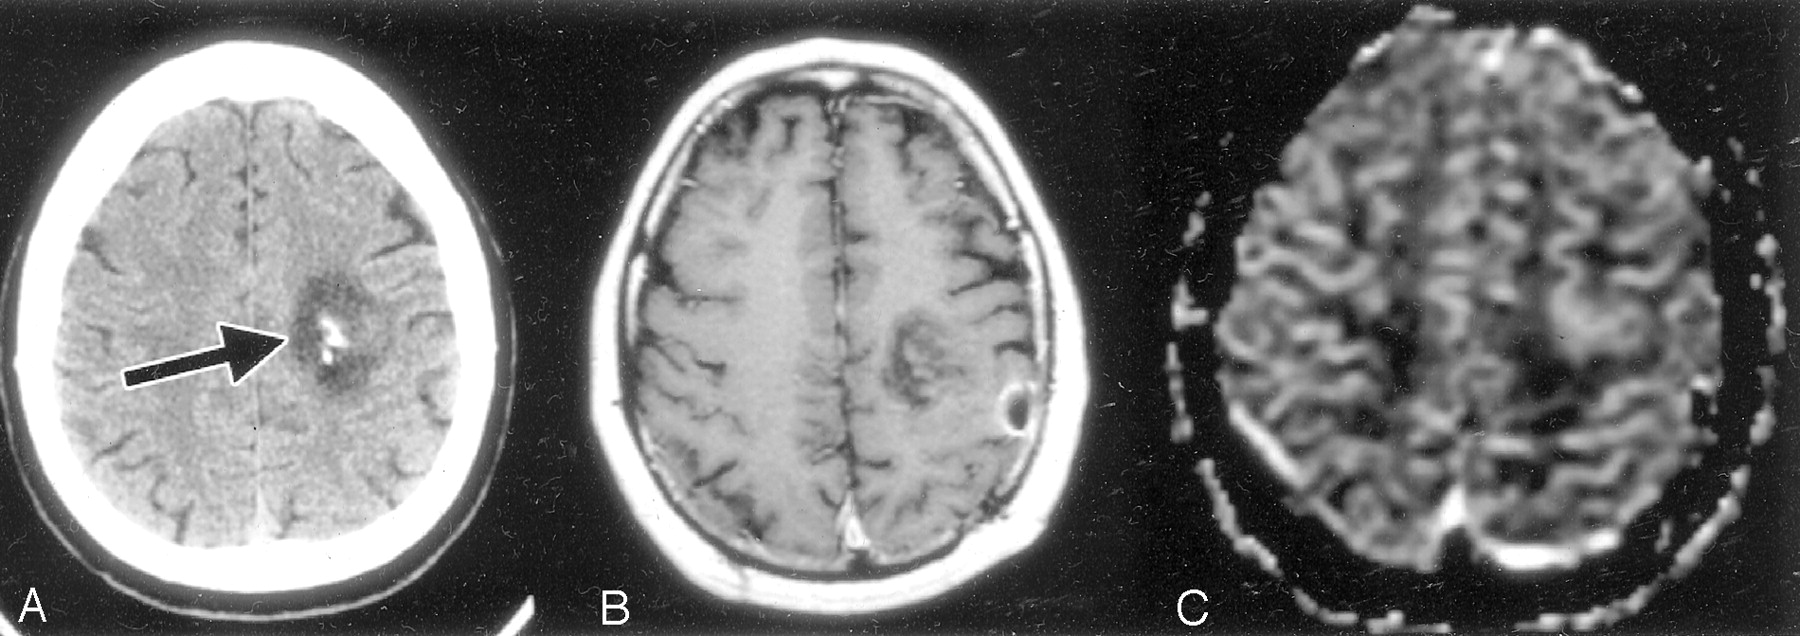
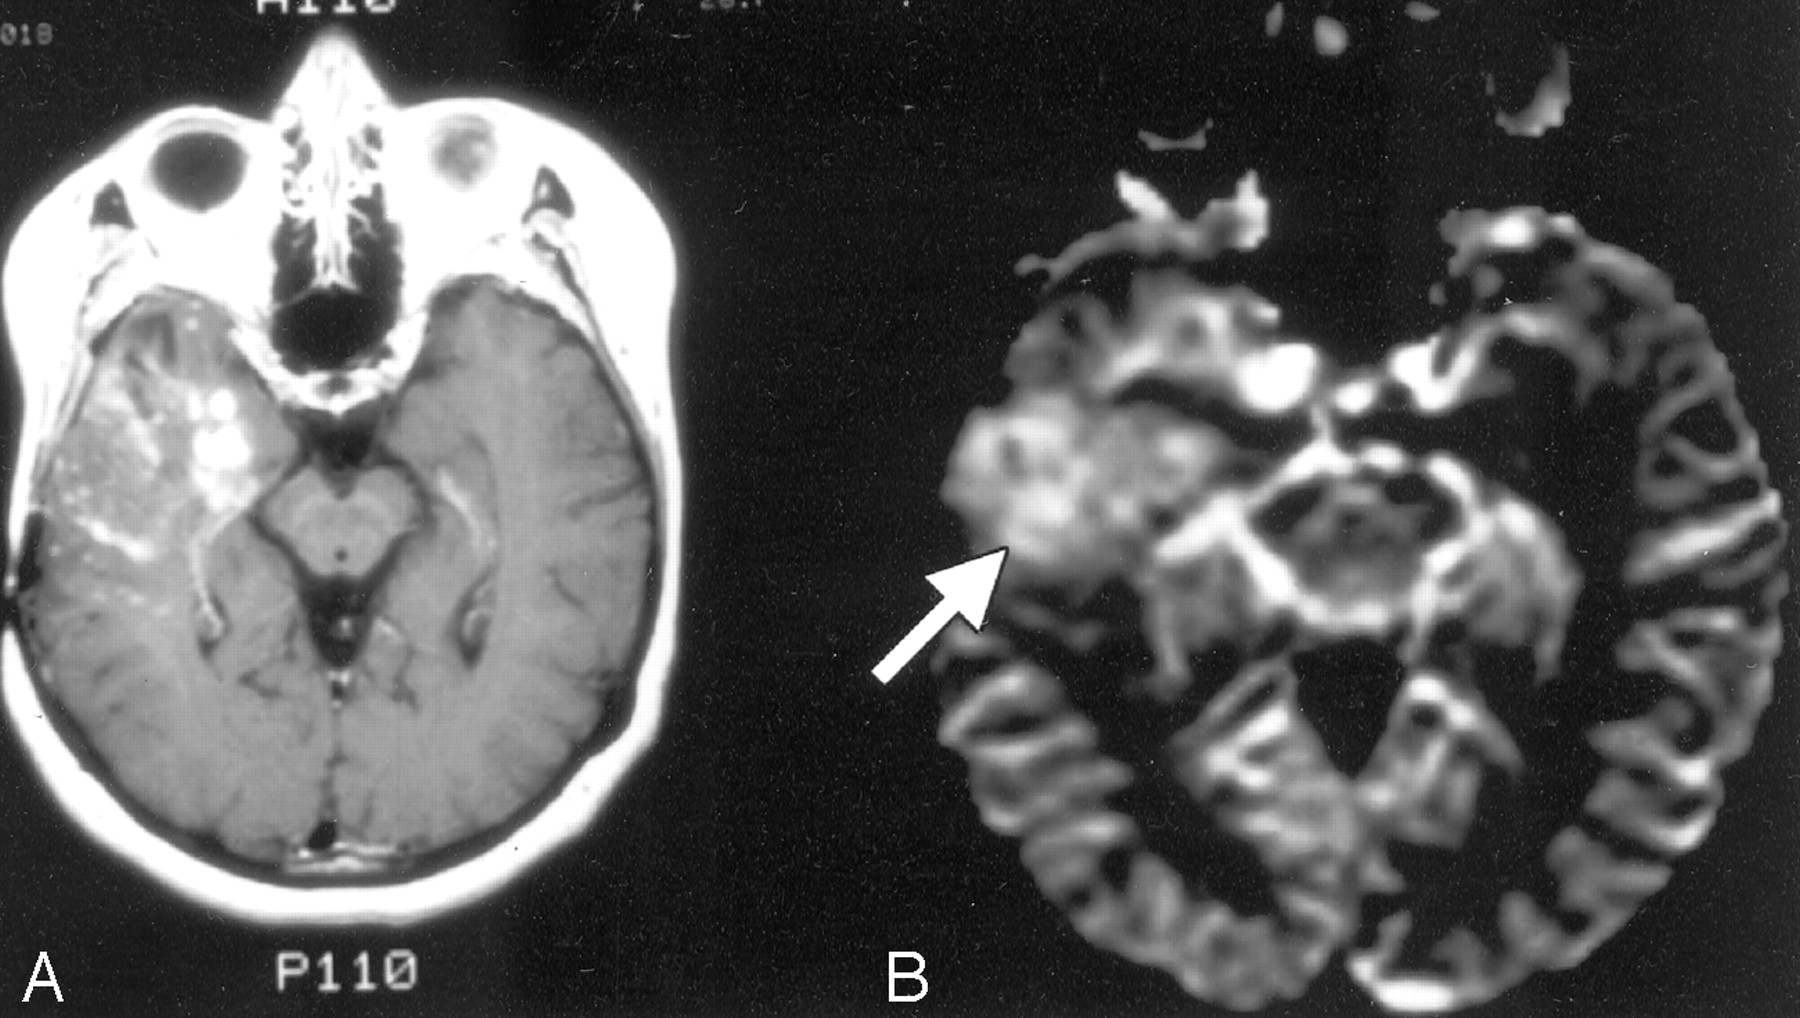
65-year-old man with biopsy-proved low-grade oligodendroglioma.
A–C, Axial nonenhanced CT image through the frontal lobes (A), as well as axial contrast-enhanced T1-weighted (B) and rCBV (C) MR images through the same region, demonstrate a calcified left frontal mass (arrow in A). There is trace contrast enhancement and increased blood volume compared with the adjacent gray and white matter. The combination of calcification, relatively mild contrast enhancement, and increased rCBV is not uncommon for oligodendrogliomas of any grade.

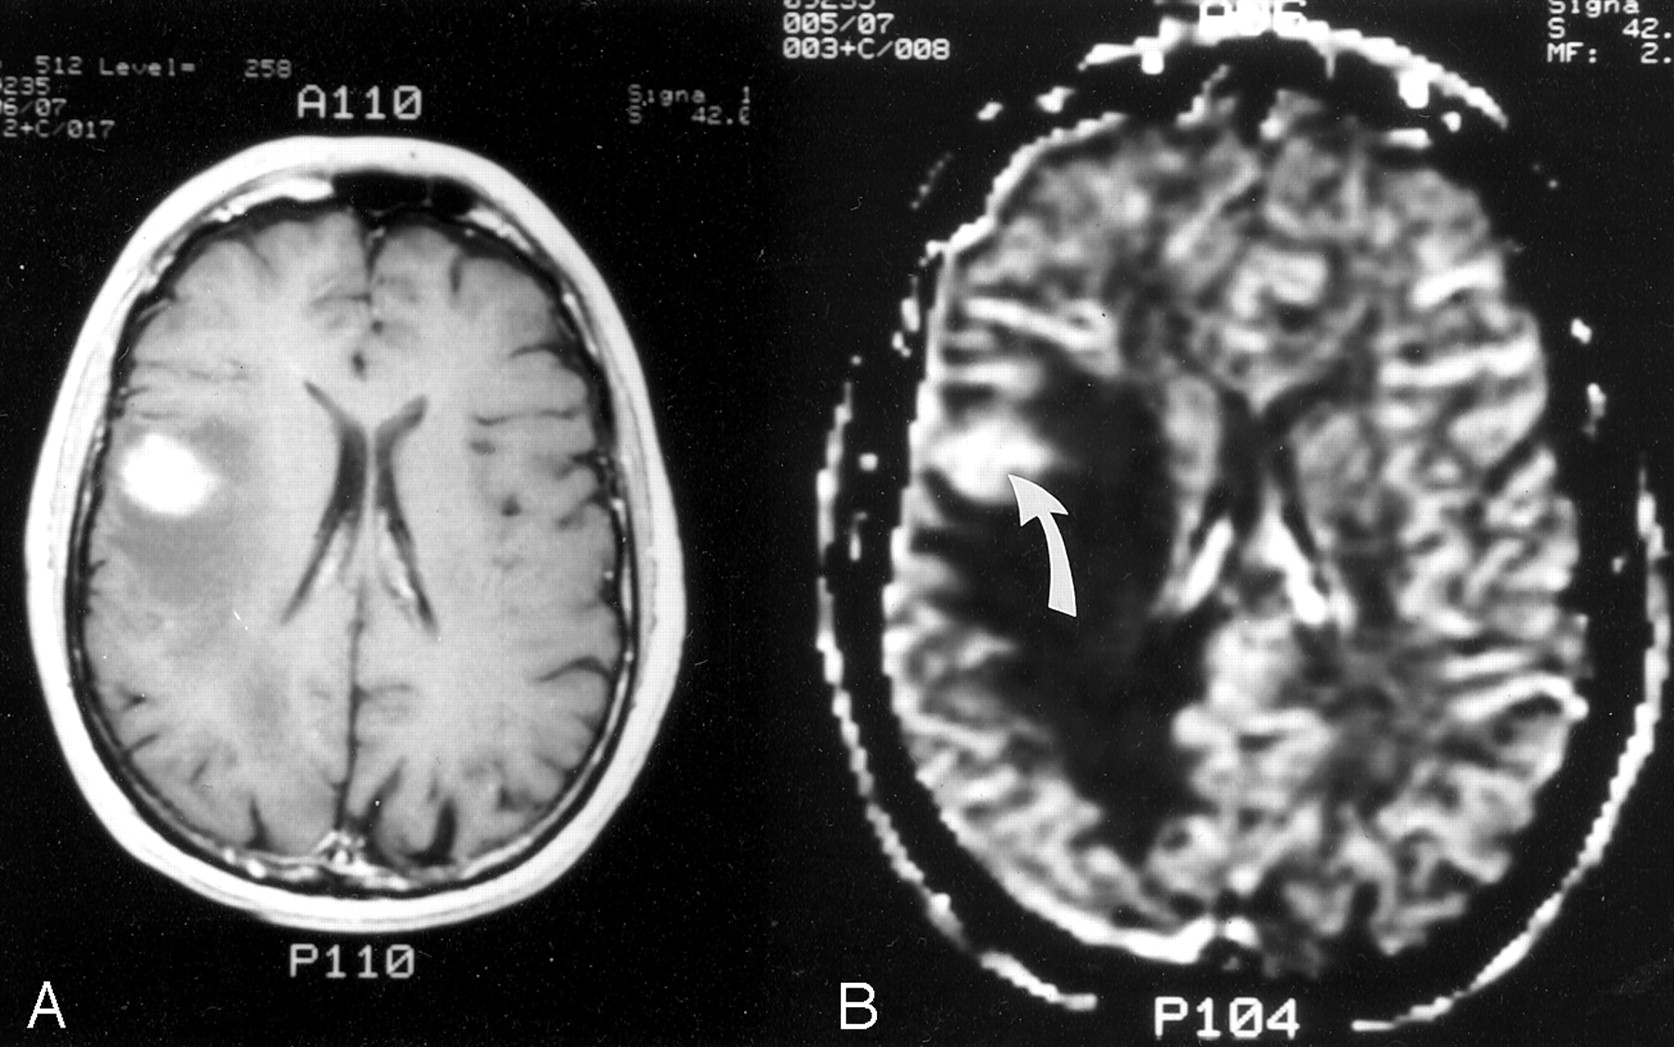
29-year-old man with mixed malignant oligoastrocytoma.
A–C, Axial T2-weighted (A), contrast-enhanced T1-weighted (B), and rCBV (C) MR images show a lesion in the anterior left mesial temporal lobe that is hyperintense on the T2-weighted image and minimally enhancing on the T1-weighted image. The lesion demonstrates intensely elevated blood volume relative to both gray and white matter (arrow in C).
Including oligodendrogliomas, five high-grade tumors failed to demonstrate significant contrast material enhancement, whereas three low-grade tumors did enhance. In a single high-nCBV, minimally enhancing tumor, which received directed biopsy at both the highest nCBV and separate enhancing foci (Fig 6), high-grade tumor was correctly identified only at the high-CBV region, and not at the area of enhancement.

65-year-old man with biopsy-proved anaplastic astrocytoma.
A and B, rCBV map (A) corresponds to the contrast-enhanced T1-weighted MR image (B). Despite only mild enhancement of this high-grade temporal lobe neoplasm on the T1-weighted image, the lesion demonstrates intensely elevated blood volume on the corresponding rCBV map (arrows).
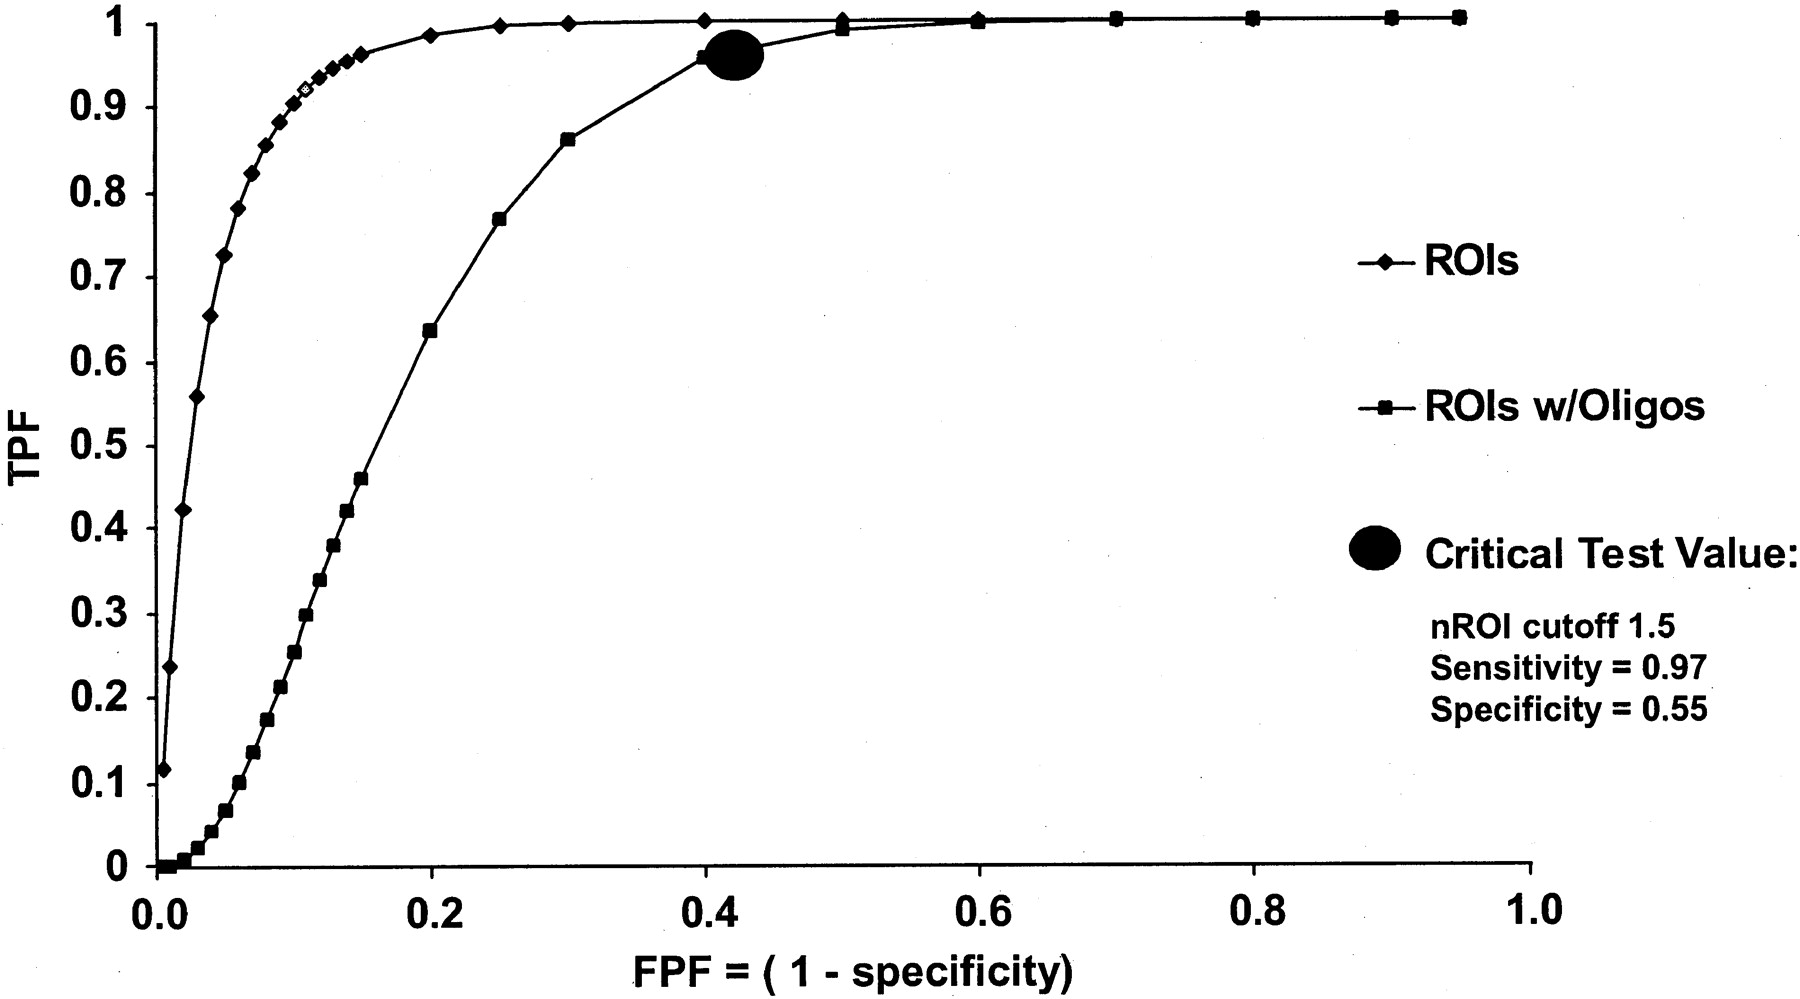
The ROC curves constructed from the data in Fig 1, both for astrocytomas alone and for astrocytomas combined with oligodendrogliomas, are shown in Fig 7. For the combined astrocytoma-oligodendroglioma ROC curve, a sensitivity of 97% (95% confidence interval [CI]: 75–100%) with a specificity of 55% (95% CI: 40–97%) for distinguishing high- from low-grade glial tumors, was obtained at an operating point corresponding to an nCBV cutoff value of 1.5. An operating point of 1.95 corresponded to a sensitivity of 90% with a specificity of 66%. For the astrocytoma-only ROC curve, the same operating point resulted in a sensitivity of 90% with a specificity of 87%. Area under the combined ROC curve, proportional to accuracy, was 0.82 ± 0.08. Area under the astrocytoma-only curve was 0.96 ± 0.05.

ROC curves generated by varying the nCBV cutoff values used to classify the tumor regions of interest (ROIs) shown in Fig 1 as low grade versus high grade. The left curve (diamond-shaped data points) describes the sensitivity and specificity values for low- versus high-grade astrocytomas only. The right curve (square data points) describes the sensitivity and specificity values for low- versus high-grade astrocytomas and oligodendrogliomas grouped together. Of note, the larger area under the left as compared with the right-shifted curve (proportional to accuracy) reflects the superior discriminatory ability of rCBV imaging in distinguishing low- from high-grade astrocytomas than in distinguishing low- from high-grade oligodendrogliomas. At a critical test cutoff value of nCBV = 1.5 for the right-shifted curve (as per Fig 1), sensitivity and specificity for distinguishing low- versus high-grade glial neoplasms are 0.96 and 0.60, respectively. TPF indicates true-positive fraction; FPF, false-positive fraction.
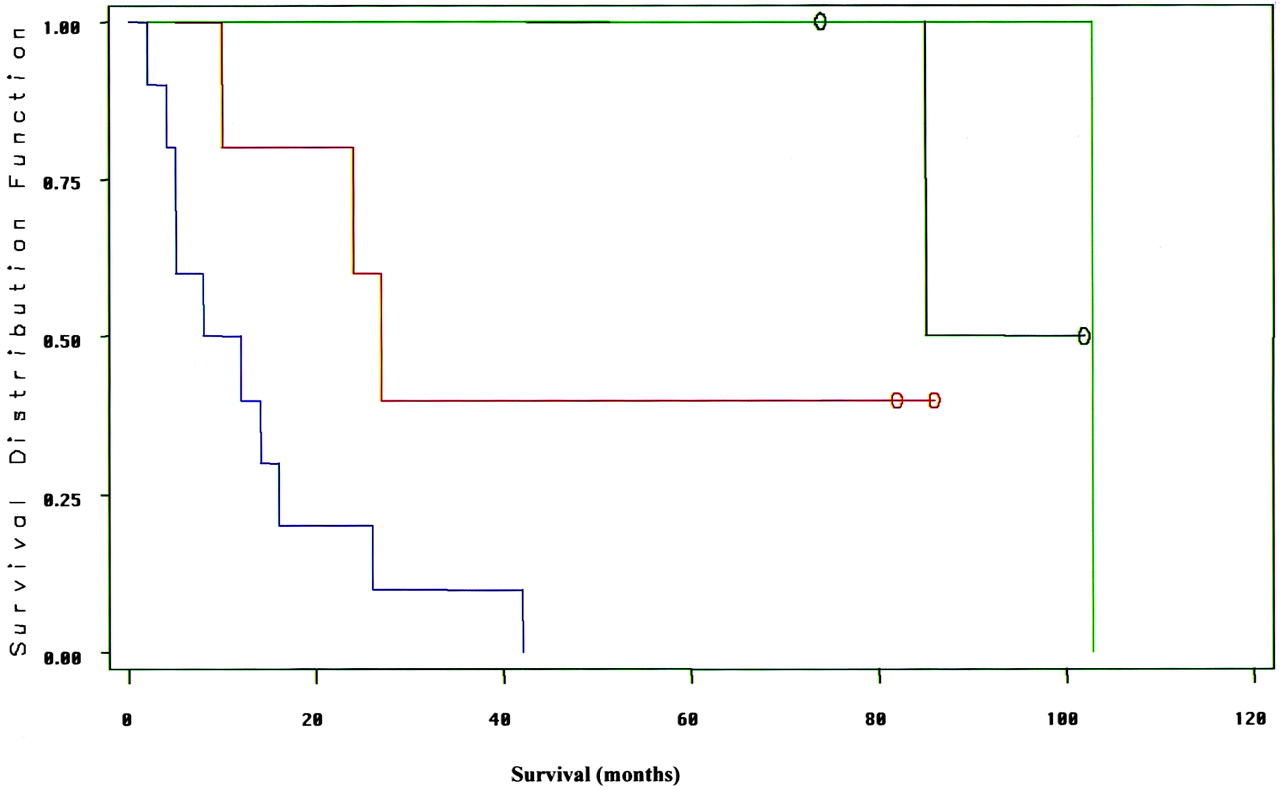
Survival results for the 19 patients for whom follow-up data were available are shown in the Table. Correlation with survival was stronger for nCBV (mean survival 91 ± 14 months for nCBV < 1.5 versus 24 ± 27 months for nCBV > 1.5, P < .0001) than for enhancement (mean survival 61 ± 35 months without enhancement versus 22 ± 29 months with enhancement, P = .03), although the difference between the two categories did not reach statistical significance owing to the small number of patients with low-grade tumors. On multivariable analysis, only histologic grade was an independent predictor of survival after the confounding effects of age were removed (P = .001). Mean survival was 15 ± 12 months for high-grade astrocytomas and 89 ± 12 months for low-grade astrocytomas (P < .00001). Figure 8 shows the Kaplan-Meir survival curves for the high (>1.5) and low (<1.5) nCBV groups, stratified according to the presence or absence of enhancement. There was a strong trend toward the high nCBV tumor survival curves being left-shifted (poor survival) and the low nCBV tumor survival curves being right-shifted (good survival). The worst survival was in patients with tumors that displayed both high nCBV and enhancement.

Kaplan-Meir survival curves for the data shown in the Table. Left-shifted curves reflect poor survival, and right-shifted curves reflect good survival. The far left-shifted curve (blue) is for patients with enhancing, high-nCBV (>1.5) tumors; the adjacent left-shifted curve (red) is for patients with nonenhancing, high-nCBV tumors. The far right-shifted curves are for patients with low-nCBV (<1.5) tumors: the rightmost curve (green) is for patients with enhancing tumors and the adjacent curve (black) is for patients with nonenhancing tumors. Although the number of tumors studied was too low to establish a statistically significant difference between enhancement and nCBV as outcome predictors, these data suggest a strong trend toward nCBV being a stronger predictor of survival than is enhancement. Open circles indicate censored data (ie, patients still alive at the time of most recent follow-up.)
Survival after baseline MR imaging as a function of patient age, tumor histologic diagnosis, enhancement, and maximal nCBV values in 19 patients with follow-up data
Discussion
Our findings confirm those of previous studies showing a strong positive correlation between the degree of rCBV elevation and tumor grade (11, 12, 19, 20). Our data extend those observations by reporting an SE nCBV cutoff ratio of 1.5 that yields sensitivities in the 75–100% range and specificities in the 40–97% range for detection of high-grade glial neoplasm. Of note, analogous results have been reported with F-18 fluorodeoxyglucose (FDG) positron emission tomography in 58 untreated patients (27). The authors obtained 100% sensitivity with 67% specificity in differentiating high- from low-grade gliomas, applying a tumor-to–white matter FDG uptake cutoff ratio of 1.5. In another series, Aronen et al (13) found that, when glial tumors had nCBV values greater than 1.5, those tumors developed into high-grade lesions at some point during follow-up.
The predictive value of a low (<1.5) nCBV region of interest for a low-grade glioma was 100%. Although this result may, in part, be related to our relatively small sample, this finding may nonetheless be useful to support (but not eliminate the need for) a low-grade glioma biopsy result, particularly when the diagnosis is made by means of a stereotactic needle biopsy, in which there is limited sampling of the tumor. Knopp and colleagues (19), using a GRE MR technique, had similar findings in which no high-grade glioma had an nCBV value below 1.73. Other studies have described a positive correlation between nCBV and tumor vascularity and/or grade (19, 20). Donahue et al (12) compared GRE rCBV and SE rCBV techniques; they reported a stronger correlation between GRE rCBV and tumor grade than between SE rCBV and tumor grade.
There are some important differences between our data and the aforementioned studies. First, most groups used T2*-weighted GRE EP imaging, rather than the T2- weighted SE rCBV technique used in our study. Also, Donahue et al (12) did not fully describe their region-of-interest placement method. Region-of-interest selection could, in part, explain differences in our findings; selection of large regions of interest, for example, may lead to the inclusion of relatively moderate or low nCBV values, which might “dilute” higher adjacent nCBV values. We were explicit in our attempt to obtain region-of-interest measurements from tumor sites with the highest rCBV signal intensities, the lowest standard deviation of surrounding pixels, and the least partial volume effects from adjacent vessels and CSF spaces. Second, other studies did not emphasize the rCBV imaging characteristics of low-grade glial neoplasms, specifically oligodendrogliomas. Given the fine capillary network that is typical of even low-grade oligodendrogliomas, it is not surprising that their perfusion pattern should differ from that of low-grade astrocytomas, and therefore can confound the reliability of nCBV values in distinguishing high-grade from low-grade untreated glial cell tumors. In our series, the inclusion of oligodendrogliomas decreased the specificity for correctly categorizing high-grade gliomas from 78% to 69%. Interestingly, however, this did not change sensitivity for detection of high-grade malignancy (or negative predictive value for excluding high-grade glioma).
Compared with nCBV, tumor enhancement with a gadolinium-based contrast material did not correlate as well with histologic grade. Five of the 13 high-grade gliomas had absent or equivocal enhancement with contrast material. Relying solely on the absence of contrast enhancement would have resulted in incorrect categorization of these five high-grade gliomas as low grade. Using nCBV, we were able to correctly characterize all 13 high-grade gliomas, despite the lack of contrast enhancement in some of the tumors. Although not the focus of this study, it is interesting to note that even in those high-grade lesions with both enhancing and high nCBV foci, the extent of the nCBV abnormality typically exceeded that of the enhancing abnormality (Fig 9). In addition, three low-grade tumors demonstrated enhancement with contrast material, including one correctly classified as low grade based on a low nCBV. These findings suggest that SE nCBV imaging may be more sensitive in detecting high-grade glioma than is the presence or absence of contrast enhancement. Indeed, because our SE rCBV acquisition calls for the administration of double-dose gadolinium-based contrast material, our results are, if anything, biased toward exaggerating the degree of lesion enhancement.

60-year-old woman with glioblastoma.
A and B, Contrast-enhanced T1-weighted (A) and rCBV (B) MR images show a heterogeneously enhancing anterior right temporal lobe mass. The entire mass, including regions of both minimal and maximal contrast enhancement, demonstrates homogeneously increased rCBV, consistent with biopsy proved high-grade glioma (arrow in B). The elevated blood volume extends even to tumor foci without significant contrast enhancement.
Relative CBV maps could help to guide the selection of stereotactic biopsy sites. In our series, stereotactic biopsy sites were suggested by nonenhancing, elevated rCBV foci in seven of the 13 high-grade cases. Such functional imaging–based guidance could be of great clinical value because of the potential heterogeneity of high-grade components interspersed among low-grade components. Thus, it may become possible to reduce potential errors due to sampling bias from a stereotactic biopsy (14).
Conclusion
In the present study, tumors with homogeneously low nCBV values (< 1.5) did not contain high-grade components, regardless of their enhancement characteristics on conventional MR images. Gadolinium-based rCBV maps, created by using a dynamic SE technique, therefore had a 100% predictive value for excluding the presence of high-grade glial tumor in untreated patients. Thus, rCBV imaging can offer additional data, not appreciated with conventional MR imaging, that can be used to support a diagnosis of low-grade astrocytoma when stereotactic brain biopsy is performed. Prospective validation of these preliminary results, including repeat ROC analysis, is, of course, required to more confidently establish the optimal cutoff value for distinguishing high- from low-grade lesions. The nCBV values also more strongly predicted survival than did enhancement characteristics alone. Oligodendrogliomas, however, which often display high–blood volume foci even when benign, can confound the accuracy of rCBV mapping in glial tumor grading. Despite this, our results suggest that rCBV maps may nonetheless improve the accuracy of tumor biopsies and aid clinical follow-up over that of conventional MR imaging, by raising suspicion for the presence of anaplastic foci within tumors.
Footnotes
Supported in part by RSNA Seed grant (M.H.L.), National Institutes of Health grant CA83159 (R.G.G.), and Brain Tumor Research Fund (J.W.H.).
Presented in part at the 35th annual meeting of the American Society of Neuroradiology, Toronto, Ontario, Canada, 1997.
References
- Received May 13, 2003.
- Accepted after revision July 31, 2003.
- Copyright © American Society of Neuroradiology
In this issue


Jump to section
Related Articles
Cited By...
- Radiogenomics Provides Insights into Gliomas Demonstrating Single-Arm 1p or 19q Deletion
- Hybrid 18F-Fluoroethyltyrosine PET and MRI with Perfusion to Distinguish Disease Progression from Treatment-Related Change in Malignant Brain Tumors: The Quest to Beat the Toughest Cases
- Effects of Susceptibility Artifacts on Perfusion MRI in Patients with Primary Brain Tumor: A Comparison of Arterial Spin-Labeling versus DSC
- Moving Toward a Consensus DSC-MRI Protocol: Validation of a Low-Flip Angle Single-Dose Option as a Reference Standard for Brain Tumors
- Multisite Concordance of DSC-MRI Analysis for Brain Tumors: Results of a National Cancer Institute Quantitative Imaging Network Collaborative Project
- 3D Pseudocontinuous Arterial Spin-Labeling MR Imaging in the Preoperative Evaluation of Gliomas
- Improving the Grading Accuracy of Astrocytic Neoplasms Noninvasively by Combining Timing Information with Cerebral Blood Flow: A Multi-TI Arterial Spin-Labeling MR Imaging Study
- Mitotic Activity in Glioblastoma Correlates with Estimated Extravascular Extracellular Space Derived from Dynamic Contrast-Enhanced MR Imaging
- Improved Brain Tumor Classification by Sodium MR Imaging: Prediction of IDH Mutation Status and Tumor Progression
- Impact of Software Modeling on the Accuracy of Perfusion MRI in Glioma
- Multimodality Brain Tumor Imaging: MR Imaging, PET, and PET/MR Imaging
- Mean Diffusional Kurtosis in Patients with Glioma: Initial Results with a Fast Imaging Method in a Clinical Setting
- Prognostic Value of Dynamic Susceptibility Contrast-Enhanced and Diffusion-Weighted MR Imaging in Patients with Glioblastomas
- ASFNR Recommendations for Clinical Performance of MR Dynamic Susceptibility Contrast Perfusion Imaging of the Brain
- Three-tesla functional MR language mapping: Comparison with direct cortical stimulation in gliomas
- Role of MRI in Primary Brain Tumor Evaluation
- Advanced Magnetic Resonance Imaging of the Physical Processes in Human Glioblastoma
- Arterial Spin-Labeling Assessment of Normalized Vascular Intratumoral Signal Intensity as a Predictor of Histologic Grade of Astrocytic Neoplasms
- Differentiation between Oligodendroglioma Genotypes Using Dynamic Susceptibility Contrast Perfusion-Weighted Imaging and Proton MR Spectroscopy
- 11C-Methionine Uptake Correlates with Combined 1p and 19q Loss of Heterozygosity in Oligodendroglial Tumors
- Semi-automated and automated glioma grading using dynamic susceptibility-weighted contrast-enhanced perfusion MRI relative cerebral blood volume measurements
- Survival Analysis of Patients with High-Grade Gliomas Based on Data Mining of Imaging Variables
- Imaging Characteristics of Oligodendrogliomas That Predict Grade
- The Added Value of Apparent Diffusion Coefficient to Cerebral Blood Volume in the Preoperative Grading of Diffuse Gliomas
- Does MR Perfusion Imaging Impact Management Decisions for Patients with Brain Tumors? A Prospective Study
- Correlations between Perfusion MR Imaging Cerebral Blood Volume, Microvessel Quantification, and Clinical Outcome Using Stereotactic Analysis in Recurrent High-Grade Glioma
- Quantitative Blood Flow Measurements in Gliomas Using Arterial Spin-Labeling at 3T: Intermodality Agreement and Inter- and Intraobserver Reproducibility Study
- Biology, genetics and imaging of glial cell tumours
- Perfusion CT Imaging of Brain Tumors: An Overview
- Correlation of MR Relative Cerebral Blood Volume Measurements with Cellular Density and Proliferation in High-Grade Gliomas: An Image-Guided Biopsy Study
- In Vivo Correlation of Tumor Blood Volume and Permeability with Histologic and Molecular Angiogenic Markers in Gliomas
- Differentiation among Glioblastoma Multiforme, Solitary Metastatic Tumor, and Lymphoma Using Whole-Tumor Histogram Analysis of the Normalized Cerebral Blood Volume in Enhancing and Perienhancing Lesions
- Combination of high-resolution susceptibility-weighted imaging and the apparent diffusion coefficient: added value to brain tumour imaging and clinical feasibility of non-contrast MRI at 3 T
- Enhancing Fraction in Glioma and Its Relationship to the Tumoral Vascular Microenvironment: A Dynamic Contrast-Enhanced MR Imaging Study
- Optimized Preload Leakage-Correction Methods to Improve the Diagnostic Accuracy of Dynamic Susceptibility-Weighted Contrast-Enhanced Perfusion MR Imaging in Posttreatment Gliomas
- Semiquantitative Assessment of Intratumoral Susceptibility Signals Using Non-Contrast-Enhanced High-Field High-Resolution Susceptibility-Weighted Imaging in Patients with Gliomas: Comparison with MR Perfusion Imaging
- Cerebral Blood Volume Measurements by Perfusion-Weighted MR Imaging in Gliomas: Ready for Prime Time in Predicting Short-Term Outcome and Recurrent Disease?
- The Blood Oxygen Level-Dependent Functional MR Imaging Signal Can Be Used to Identify Brain Tumors and Distinguish Them from Normal Tissue
- Distinguishing Recurrent Intra-Axial Metastatic Tumor from Radiation Necrosis Following Gamma Knife Radiosurgery Using Dynamic Susceptibility-Weighted Contrast-Enhanced Perfusion MR Imaging
- Diagnostic performance of spectroscopic and perfusion MRI for distinction of brain tumors
- Physiologic and Metabolic Magnetic Resonance Imaging in Gliomas
- Dynamic Magnetic Resonance Perfusion Imaging of Brain Tumors