
Abstract
BACKGROUND AND PURPOSE:Magic angle effects are well recognized in MR imaging of tendons and ligaments, but have received virtually no attention in MR neurography. We investigated the hypothesis that signal intensity from peripheral nerves is increased when the nerve’s orientation to the constant magnetic induction field (B0) approaches 55° (the magic angle).
METHODS: Ten volunteers were examined with their peripheral nerves at different orientations to B0 to detect any changes in signal intensity and provide data to estimate T2. Two patients with rheumatoid arthritis also had their median nerves examined at 0° and 55°.
RESULTS: When examined with a short TI inversion-recovery sequence with different TEs, the median nerve showed a 46–175% increase in signal intensity between 0° and 55° and an increase in mean T2 from 47.2 to 65.8 msec. When examined in 5° to 10° increments from 0° to 90°, the median nerve signal intensity changed in a manner consistent with the magic angle effect. No significant change was observed in skeletal muscle. Ulnar and sciatic nerves also showed changes in signal intensity depending on their orientation to B0. Components of the brachial plexus were orientated at about 55° to B0 and showed a higher signal intensity than that of nerves in the upper arm that were nearly parallel to B0. A reduction in the change in signal intensity in the median nerve with orientation was observed in the two patients with rheumatoid arthritis.
CONCLUSION: Signal intensity of peripheral nerves changes with orientation to B0. This is probably the result of the magic angle effect from the highly ordered, linearly orientated collagen within them. Differences in signal intensity with orientation may simulate disease and be a source of diagnostic confusion.
Neurography is an expanding application of MR imaging (1, 2). The technique typically involves the use of surface coils and a high-spatial-resolution fat-suppressed T2-weighted or short TI inversion-recovery (STIR) fast spin-echo pulse sequence. Nerves are identified in transverse section by their fascicular pattern. Abnormalities are recognized by differences in shape, size, and contour of the nerves, as well as by the changes in signal intensity. Common applications include the brachial plexus (3–9), the median nerve in the carpal tunnel (10, 11), the ulnar nerve at the elbow (12, 13), and the sciatic nerve and its branches (14, 15).
In pulse sequences with a moderate or short TE, the signal intensity of tendons, ligaments, and menisci depends on their orientation to the constant magnetic induction field (B0) (16–18). These highly ordered, collagen-rich tissues contain water that is bound to collagen. The protons within this water display dipolar interactions whose strength depends on the orientation of the fibers to B0. These interactions usually result in rapid dephasing of the MR signal after excitation and a very short T2. As a consequence, these tissues typically produce little or no detectable signal intensity and appear dark when imaged with conventional clinical MR pulse sequences. The dipolar interactions are modulated by the term 3cos2θ − 1, where θ is the angle the structures make with the static field B0. When 3cos2θ − 1 = 0 (θ = 55°, 125°, etc. approximately, the magic angle), dipolar interactions are minimized with the result that the T2 relaxation times of these tissues are increased and signal intensity may become evident within them when they are imaged with conventional pulse sequences. This increase in signal intensity usually occurs when all or part of a tendon or ligament happens to be at 55° to B0. It has been recognized as an artifact and potential source of error in musculoskeletal MR imaging (19, 20). The effect has also been exploited as an imaging technique by deliberately placing tendons at the magic angle to obtain signal intensity from them and demonstrate changes in disease, as well as contrast enhancement (21–23).
In studying the effects of orientation to B0 on tendons of the wrist, we have observed that the signal intensity of the median nerve imaged with STIR sequences showed an increase when the nerve’s orientation to B0 was increased from 0° to 55° (24). The purpose of this study was to investigate in more detail this dependence of the MR signal intensity from peripheral nerves on the nerve’s orientation to B0.
Methods
All studies were performed with the approval of the Hammersmith Hospitals or the Royal Brompton Hospital Research Ethics Committee.
Details of the studies are shown in the Table, including the number of volunteers or patients, nerve studied, orientation of the nerve to B0, field strength of the MR system used, type of receiver coil, pulse sequence, and summary of the result. Volunteers were studied with the median nerve at 0° and 55° with the same TE (part 1), with the median nerve at 0° and at 55° with different TEs (part 2), and with the median nerve incremented from 0° to 90° with the same TE (part 3). Also examined in volunteers were the brachial plexus and exiting nerves (part 4), the ulnar nerve with the elbow flexed to 125° (part 5), the median nerve with the wrist flexed (part 6), and the sciatic nerve at 0° and 55° (part 7). Finally, the median nerve was examined in two patients with rheumatoid arthritis (part 8).
Details of study
Measurements were made by placing a region of interest within the abnormal regions of nerves, taking care to exclude partial volume effects and flow (and other) artifacts. Care was also taken to maintain nerves in the same relative position to the parallel faces of the surface coils when they were placed in different orientations. The mean voxel value, standard deviation, and voxel number were recorded. With the 0.5-T results (Philips, Cleveland, OH), the signal intensities were corrected for the manufacturers scaling factor (change of gain for each image). This was not done with the 1.5-T results as no signal intensity scaling was used by the manufacturers of these systems (Philips, Endhoven, the Netherlands or Siemens, Erlangen, Germany).
Results
Part 1
Images of the median nerve at 0° and 55° are shown in Fig 1. The nerve was isointense to synovium at 0°, but there was an increase in signal intensity at 55°. Also, the fascicular pattern was more obvious at 55°.

A and B, Transverse STIR (2500/30/160 TR/TEeffective/TI) MR images of the median nerve at 0° (A) and 55° (B). The median nerve (arrow) has a higher signal intensity in B. There is no apparent change in signal intensity in the flexor tendons (see also Fig 3).
Part 2
The mean T2 relaxation times of the median nerves in these three subjects changed from 47.2 ± 5.6 msec at 0° to 65.8 ± 2.5 msec at 55° (P < .05 [Student t test]). The signal intensity within the median nerve on the STIR images from the first echo increased 46–91% and from the last echo 66–175%, with change from 0° to 55°. No obvious signal intensity change was apparent in the adjacent flexor tendons, which were of low signal intensity in both orientations. The data from one subject are illustrated in Fig 2.

Plot of signal intensity against TE at 55° (▪) and 0° (•) on STIR images (1500/22, 33, 44, 55, 66/107 TR/TE/TI) with a monoexponential fit, in an adult volunteer. The signal intensity is higher at 55°. The mean T2 was also longer at 55° than at 0° (65.8 msec versus 47.2 msec).
Part 3
The dependence of mean signal intensity on orientation for the median nerve in one volunteer is shown in Fig 3A. The other volunteer showed a similar pattern. As the angle of orientation was increased from 0° to 60°, there was an increase in signal intensity that reached a maximum of 98% of the baseline signal intensity. The signal intensity began to decrease after the peak as the orientation to B0 was increased to 90°, but it did not return to the original value. The corresponding signal intensity values for hypothenar muscle showed no significant change. The values for a flexor tendon are shown in Fig 3B. The tendon had a lower baseline signal intensity but followed the same general pattern with a smaller increase in signal intensity. The error of the positioning was probably about ± 5°.

Plots of signal intensity against orientation for the median nerve and hypothenar muscle and for an adjacent flexor tendon. Same subject as in Fig 1.
A, The median nerve shows a 98% increase in signal intensity, which peaks at about 60° and decreases as the angulation is increased to 90°. Muscle shows no significant change in signal intensity.
B, The adjacent flexor tendon, examined with the same sequence and plotted on the same scale, follows the same pattern but has a lower initial signal intensity and shows less change.
Part 4
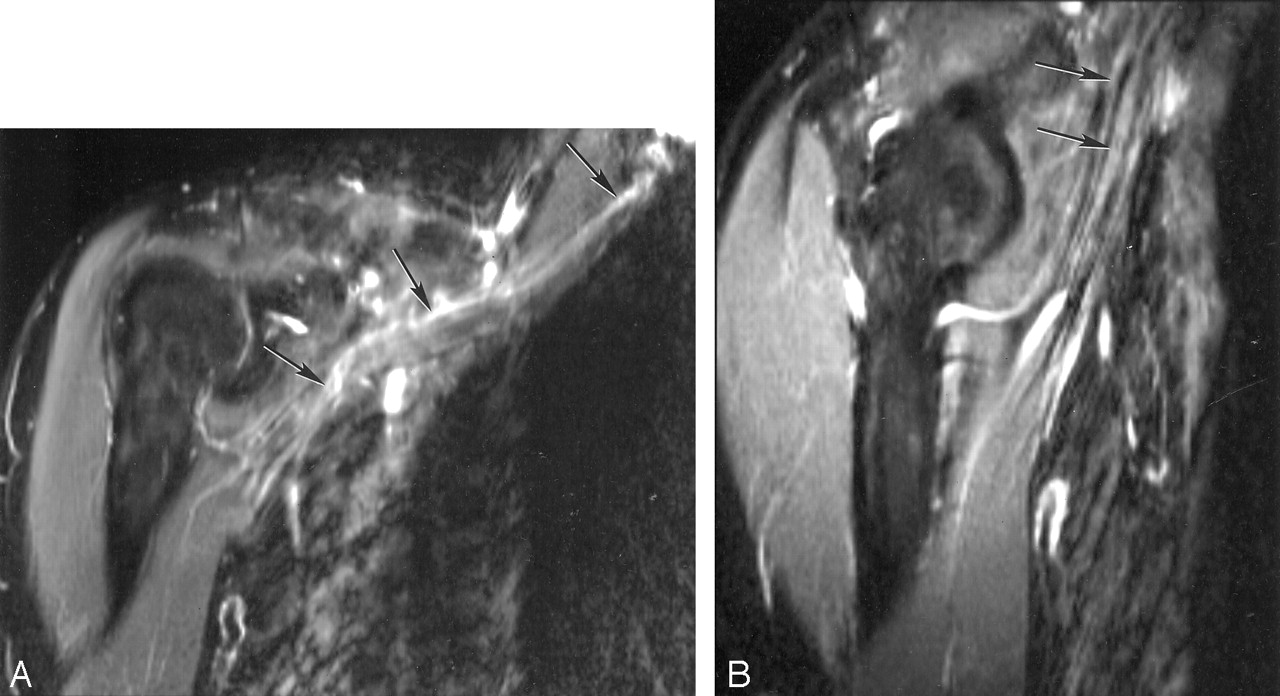
Components of the brachial plexus were seen in a conventional orientation. They showed a high signal intensity relative to that of muscle (Fig 4A). When nerves entered the upper arm, they became isointense to muscle (Fig 4B). The same feature was seen in the other subject.

A and B, STIR images of the brachial plexus (A) and nerves entering upper arm (B). The components of the brachial plexus (arrows in A) have a higher signal intensity than that of skeletal muscle, whereas nerves in the upper arm (arrows in B), emerging from the brachial plexus and nearly parallel to B0, are isointense or slightly hyperintense to muscle.
Part 5
The ulnar nerve was visualized over three sections. In the first section (Fig 5A), the nerve was isointense to muscle in the upper arm, but showed an increase in signal intensity with change in orientation around the medial condyle. On the next section (Fig 5B), the nerve was perpendicular to B0 and was isointense to muscle. On the third section (Fig 5C), the ulnar nerve in the forearm was at 125° to B0 where it was hyperintense to muscle.

Sagittal MR images of the ulnar nerve with the elbow flexed to 125°.
A, This most medial section shows that the nerve is isointense to muscle in the upper arm, but at the level of the condyle (arrow) signal intensity increases as the nerve rotates toward 55°.
B, Middle section shows the nerve (arrow) perpendicular to B0 where it is isointense to muscle.
C, Lateral section shows the nerve (arrows) at 125° to B0 where it is hyperintense to muscle.
Part 6
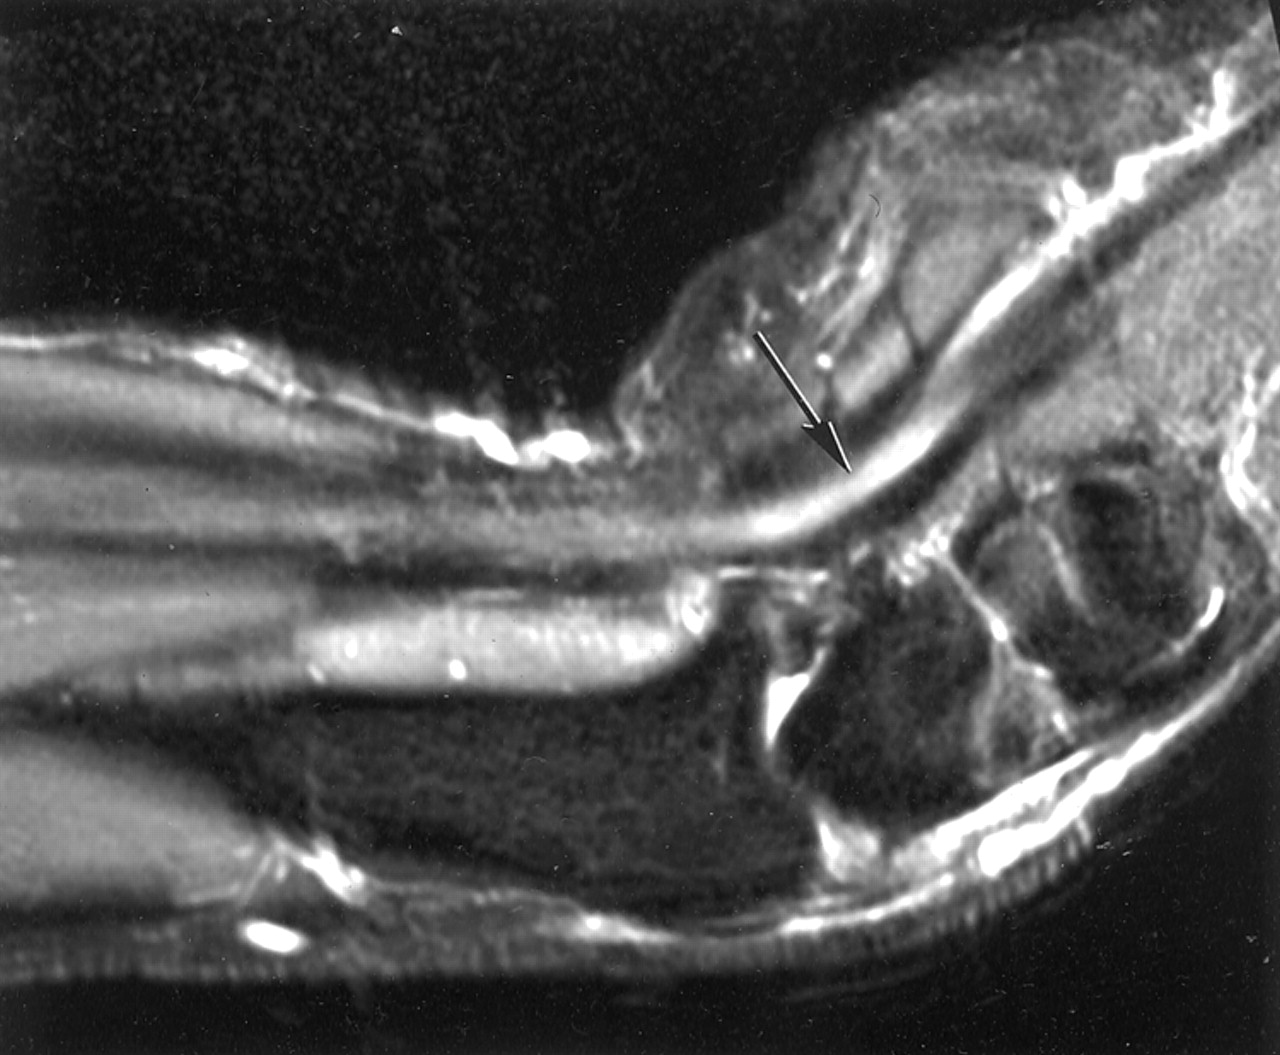
In Fig 6, the median nerve is shown in the sagittal plane with the wrist flexed to 55°. The nerve showed increased signal intensity distally.

Sagittal MR image of the median nerve with the wrist flexed to 55°. The nerve is parallel to B0 in the upper forearm and is isointense with muscle, but where the nerve is flexed toward 55° it shows increased signal intensity (arrow). This may simulate disease.
Part 7
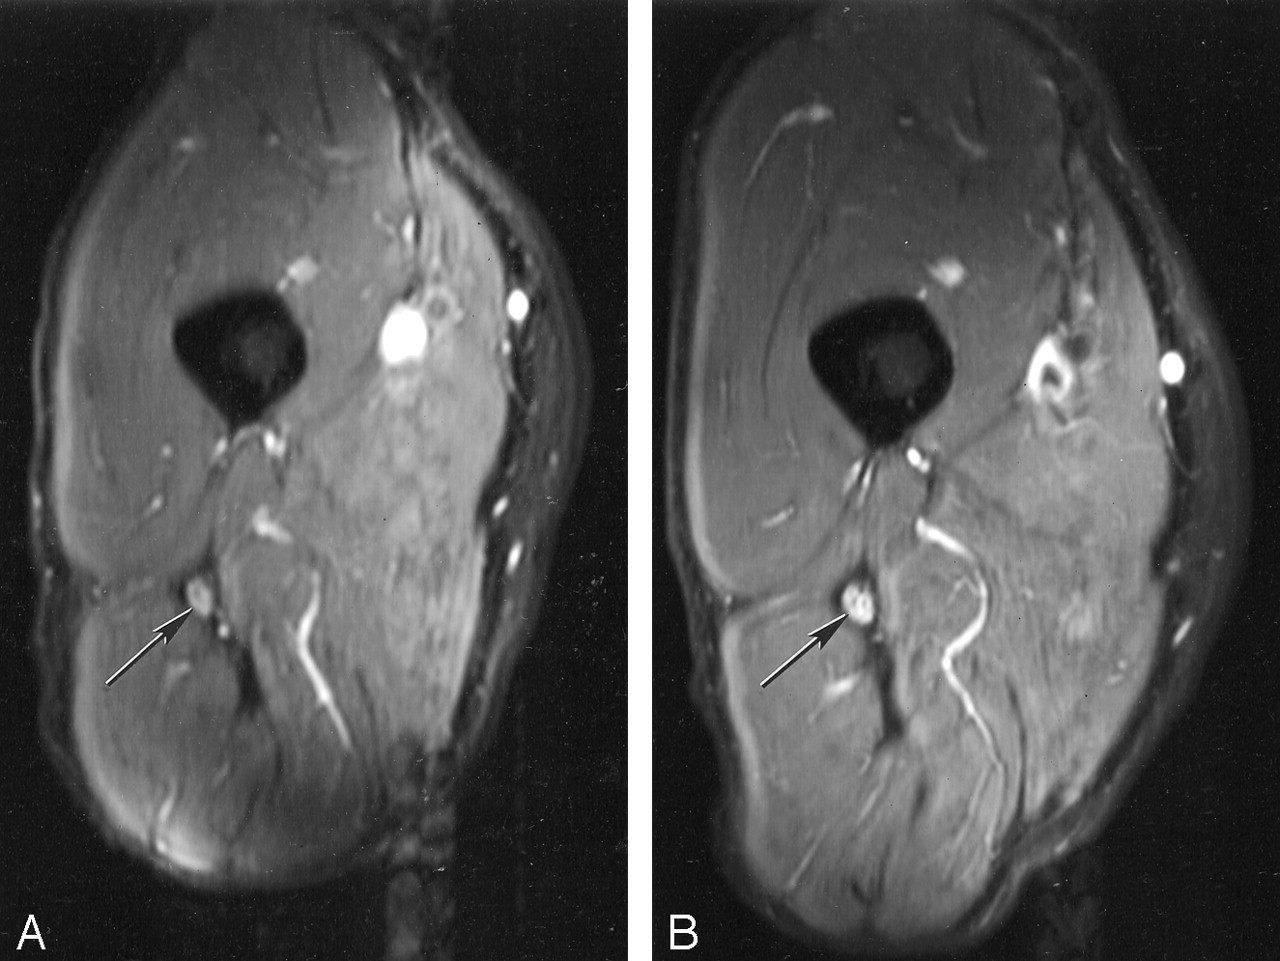
The sciatic nerve is shown in transverse section in the upper thigh at 0° in Fig 7A. The nerve showed an increase in signal intensity when orientated at 55° (Fig 7B) relative to that at 0°.

A and B, Transverse MR images of the sciatic nerve orientated at 0° to B0 (A) and 55° to B0 (B). The signal intensity in the nerve (arrow) in B is higher than that in A.
Part 8
The percentage increase in signal intensity from 0° to 55° in the two patients with rheumatoid arthritis was 11% and 66% compared with 89–93% in the aged-matched control subjects.
Discussion
In MR neurography, the signal intensity from peripheral nerve shows a dependence on orientation to B0. The effect was seen with pulse sequences and display strategies used in routine clinical practice on three different systems operating at different field strengths. The change in signal intensity may be of significance in conventional examinations, as well as those employing unusual orientations or provocative tests involving flexion or extension of joints. The change in signal intensity with orientation is a potential source of confusion in image interpretation, but awareness of this phenomenon may allow it to be differentiated from pathologic changes and so improve the diagnostic accuracy of MR neurography.
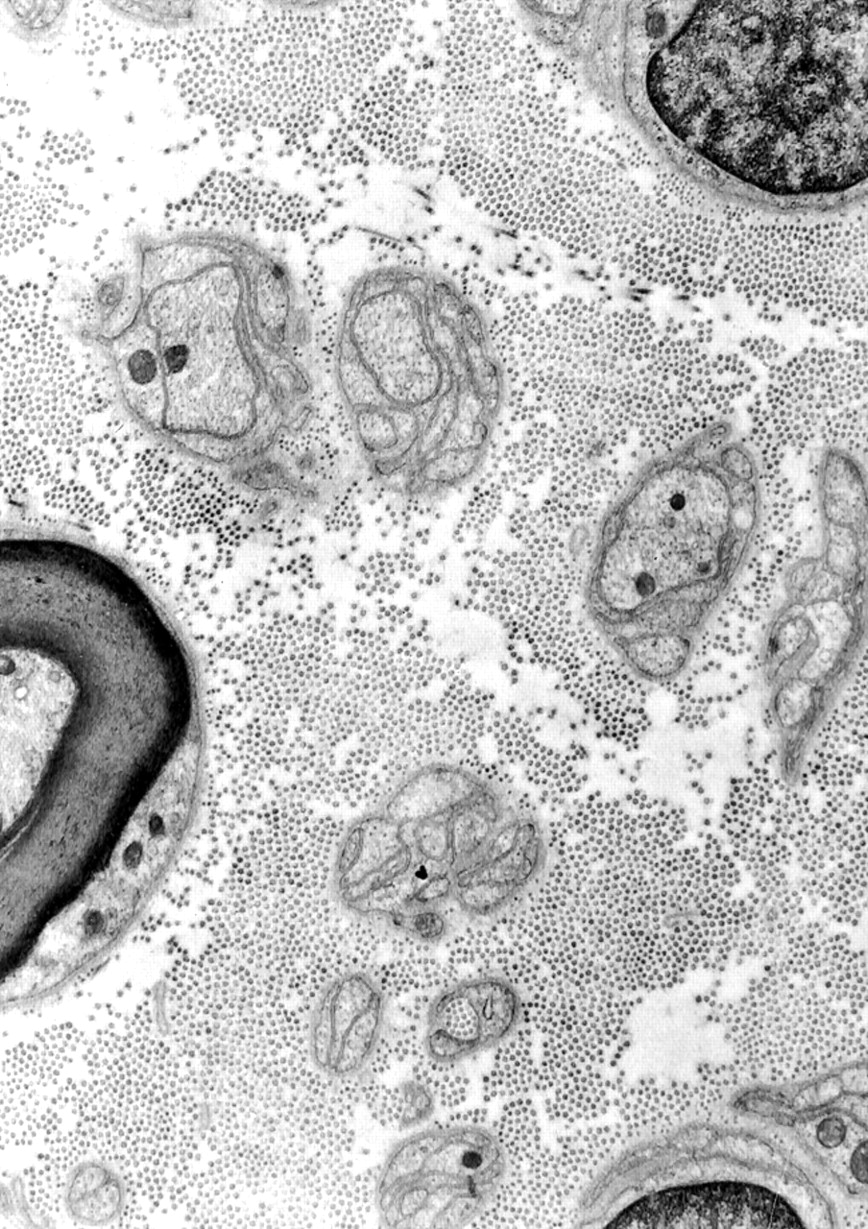
The most likely explanation for the increase in signal intensity in nerves placed at 55° is a magic angle effect from the high concentration of longitudinally orientated collagen fibers present within them. These fibers are seen in histologic studies (Fig 8 [25]). About 49% of the total protein in whole nerve is composed of types I and III collagen, with type I predominant. Most of the collagen is located in epineureum, which occupies 22–88% of the peripheral nerve cross-sectional area (26). The proportion of collagen is usually increased at sites where nerves are exposed to physical trauma such as the ulnar nerve at the elbow and the sciatic nerve in the gluteal region (27). The collagen fibers are highly ordered and mainly orientated along the long axis of the nerve.

Electron micrograph of a human peripheral nerve (stain was aqueous uranyl nitrate followed by Reynolds lead citrate; original magnification, X 14,000). The numerous small dots are collagen fibers seen in cross section.
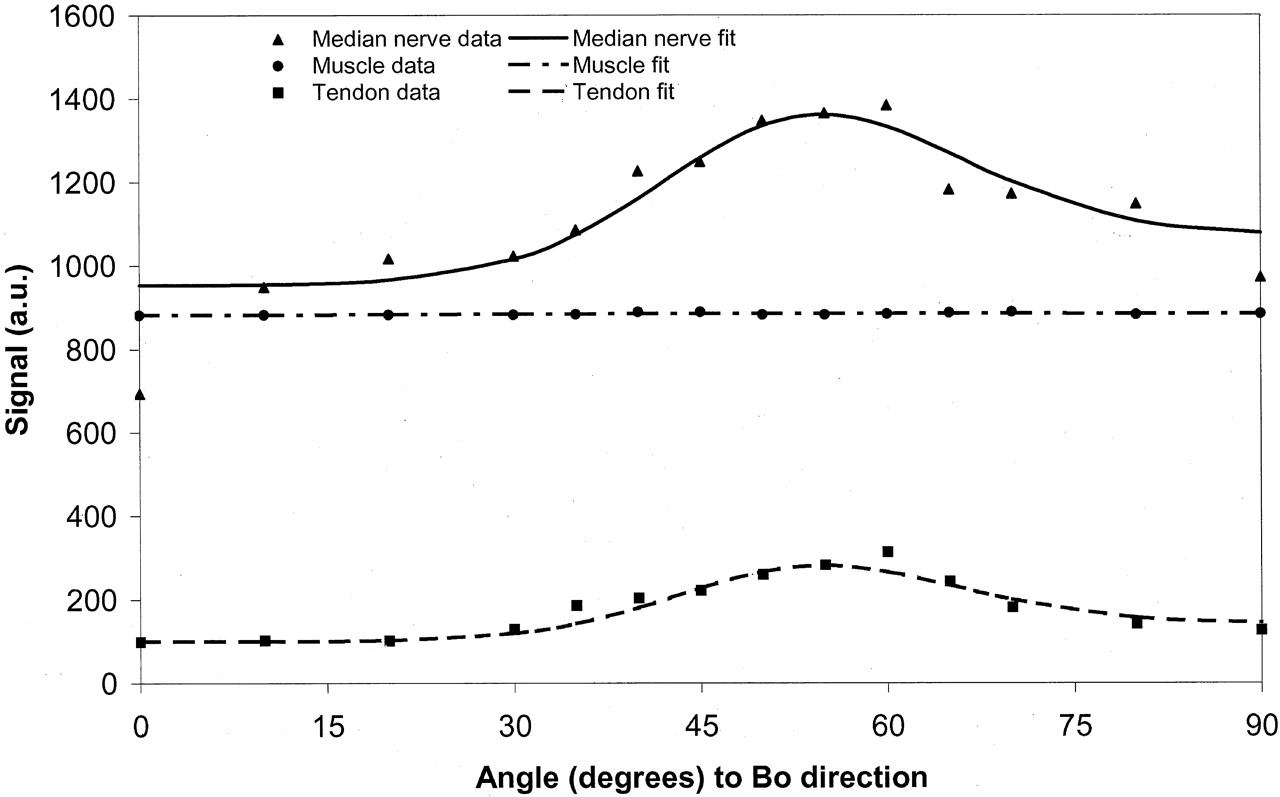
The mathematical basis for the change in signal intensity with orientation for tissues subject to dipolar interactions is summarized in the Appendix. Assuming that peripheral nerve contains both a component whose signal intensity is independent of orientation and a component that is subject to strong dipolar interactions, a good fit to the data shown in Fig 3 is obtained. This supports the view that a significant proportion of the signal intensity from the peripheral nerve originates from orientated collagen.
It is widely accepted that the normal signal intensity of nerve as seen with STIR and fat-suppressed fast spin-echo sequences is slightly hypointense, isointense, or slightly hyperintense to skeletal muscle (1–5). In many diseases, this signal intensity is increased. The typical findings in compressive neuropathy are of focal hyperintensity on T2-weighted or STIR images, with an increased or decreased signal intensity proximal to the site of compression. Malignancy and infection are also associated with an increase in peripheral nerve signal intensity. Radiation damage may produce both an increase in signal intensity in the early phase and a decrease with late fibrosis. From Fig 3, it is clear that nerve signal intensity may be slightly hypointense or isointense to muscle when the nerve is orientated at 0° to B0, but hyperintense at other angles and markedly hyperintense at angles around 55°. This increase in signal intensity may be a source of confusion and may lead to the spurious diagnosis of disease in a number of situations.
With the median nerve, it may be convenient to examine the patient in the “recovery” position when using a solenoidal cryomagnet, with the elbow and forearm resting on the machine table. A comfortable position is with the forearm at 40–50° to B0. Variants of this position are also used (28). In these situations, the median nerve may show a considerably higher signal intensity relative to that of muscle than when the patient is examined with the arm at the side or above the head where the nerve is parallel or nearly parallel to B0.
Examination of the median nerve in carpal tunnel syndrome has been a situation in which flexion and extension of the wrist to 40–45° have both been used as provocative tests to assist in diagnosis (29–32). These maneuvers may change the signal intensity of the nerve relative to that in the neutral position and thus simulate disease.
The general orientation of the brachial plexus as a whole in the conventional examination position within a solenoidal cryomagnet is about 40–60° to B0. Roots, trunks, divisions, cords, and terminal branches are orientated at different angles within this general range even if allowance is made for obliquity in the anteroposterior direction (Fig 9 [33]). Laterally, the main nerves of the plexus (ie, radial, median, and ulnar nerves) pass through an angle of 30–50° as they enter the upper arm where they become essentially parallel to B0. These orientations lead to components of the brachial plexus having a higher signal intensity than that of adjacent skeletal muscle, and a higher signal intensity than that of the the radial, median, and ulnar nerves in the upper arm. This higher signal intensity may simulate disease.

Diagram of brachial plexus. A black line at 55° to the body axis and B0 is superimposed. The components of the plexus are generally orientated parallel to this line, which is at the magic angle. (Reprinted from reference 33 with permission of Icon Learnings Systems.)
It has been suggested that a useful way of examining the ulnar nerve at the elbow may be with the joint flexed (13). In these circumstances, it needs to be recognized that increase in signal intensity in the nerve can occur at the site of curvature of the nerve from magic angle effects. With the joint flexed to 125°, signal intensity in the nerve may increase as the nerve’s orientation increases toward 55° and decrease again as its orientation approaches 90° and then increase again as it approaches 125°. As a result, there may be a local increase in signal intensity near the medial condyle, which is a typical site for compressive neuropathy.
It is possible that magic angle imaging may be useful in characterizing disease within nerves that may be manifest as a reduction in the increase in signal intensity in changing from 0° to 55° to B0. This may be because there is an increase in the free water within the nerve that is not so tightly bound to collagen or it may be produced by loss of order within collagen (or a loss of collagen itself). In scar tissue, collagen is typically more disordered and may show a smaller magic angle effect than normal nerve.
With vertical field magnets (eg, C–magnets or with horizontal-bore open-access systems) circumstances in which changes in signal intensity in nerves occur because of magic angle effects are likely to differ from those seen with conventional solenoidal magnets. For example, with a vertical field magnet, little difference would be expected in the median nerve or the brachial plexus with the examination positions used with conventional solenoidal magnets, but intercostal lumbar and sacral nerves might show changes in signal intensity along their course. With dynamic musculoskeletal studies involving movement at joints, nerves may show an increase in signal intensity in particular positions.
Detailed studies of the magic angle effect in tissue samples performed by other authors have included tendons, cartilage, muscle, kidney, white matter, and the optic nerve, but not peripheral nerves (16, 17). Obvious effects have been seen in tendons and cartilage, but not in kidney, white matter, and optic nerve. Small effects have been observed in skeletal muscle (34–36). Magic angle effects do not appear to have been observed previously in peripheral nerve.
In clinical studies, a generally increased signal intensity in the brachial plexus has been observed (2). This has been attributed to the larger size or central location of nerves, but an association has not been made previously with the magic angle effect. This may not have been recognized for a number of reasons. The use of surface coils produces gradients in signal intensity across the image, limiting the value of skeletal muscle signal intensity as a general reference standard for nerve signal intensity. The widespread use of fat saturation in MR neurography has meant that fat has not been available as another potential reference standard for signal intensity. With provocative testing, it may be difficult to maintain the nerve in the same position relative to a surface coil so changes in signal intensity may appear to be due to differences in uniformity of the coil sensitivity rather than because of intrinsic changes in the nerve signal intensity. Peripheral nerves are often small in relation to the section thickness used in MR neurography and so may show relatively large partial volume effects. Also, they often have undulating courses, so it may be difficult to image a significant length of nerve in a single plane. The caliber of components in the nerve plexus changes, making comparison more difficult. Flow artifacts and the generally low signal-to-noise ratio of both STIR and heavily T2-weighted fat-suppressed fast spin-echo sequences may have contributed to the difficulty in recognizing magic angle effects. However, doubts have been expressed previously about the value of signal intensity assessment as opposed to morphologic features in MR neurography (37, 38), and these may reflect, at least in part, variation in nerve signal intensity due to magic angle effects.
Peripheral nerves are characterized by axon Schwann cells demarcated by basement membrane–nerve fiber units suspended in a collagen-rich extracellular space. This is in contrast to central nervous system tissue where axons are embedded in a complex network of oligodendrolytes and astrocyte processes with a very small extracellular space and no collagen (39). Magic angle effects attributable to the presence of collagen would therefore not be expected in the normal central nervous system. The transition between the central and peripheral nervous system does not take place at the level where roots emerge from the brain or spinal cord but more peripherally at the level of rootlets or mini-rootlets. By the time the nerve root is fully formed from these rootlets, it has the characteristics of a peripheral nerve with its high collagen content.
It is of interest to compare the magic angle effect seen in tendons with that seen in peripheral nerves. The effect in tendons is typically one of a high signal intensity seen with short TE (eg, 3–10 msec) sequences against a very low signal intensity background for normal tendon and appearing over a limited range of angles close to 55°. This produces a focal area of high signal intensity against a dark background. It can usually be recognized as a physical phenomenon and not one due to disease, but confusion may arise in situations such as that of the supraspinatus tendon, since magic angle artifacts occur at a site where degeneration is common.
The changes in peripheral nerves are typically seen with STIR or heavily T2-weighted fast spin-echo (long TE) sequences and are seen against a background of detectable signal intensity. They may appear as a more gradual transition over a wider range of angles rather than just those closely related to 55°. However abrupt changes in signal intensity may be seen where a nerve is sharply angulated. With tendons, increasing TE reduces magic angle effects (since the level of detectable signal intensity decreases), and with a TE beyond about 38 msec they may not be observable at all (40). With peripheral nerves, magic angle effects were seen at longer TEs (eg, 66 msec) with a STIR sequence in this study and may be greater in relation to the magnitude of the baseline signal intensity than at shorter TEs. The paradoxical result that the median nerve shows an obvious magic angle effect and that tendons do not with STIR sequences (Fig 1) probably reflects the use of a relatively long TE for tendon (30 msec) and the fact that tendons have relatively short T1 relaxation times so that the signal from tendons is partly nulled by the STIR sequence. Changes in the flexor tendons could be measured as seen in Fig 3, but these were below the normal window level for image display and were therefore not manifest as visible signal intensity changes.
Conclusion
This study shows that the signal intensity of peripheral nerves varies with the nerve’s orientation to B0. The features were consistent with magic angle effects from highly ordered collagen within them. The increase in signal intensity in nerves relative to that of muscle produced by magic angle effects may simulate disease.
Appendix
Collagen exists as an organic crystalline structure with a uniform orientation in which water has restricted rotation and, hence, bulk effects due to spin-spin interaction. Previous work performed on tendons has shown this effect is due to proton-proton interactions (41). The frequency difference between the two dipolar states (Δω) depends on the orientation (θ) of the structure to B0 and has been described as follows:  1 where k is a constant relating to the interaction between the spins (and hence the distance between the spins) (42).
The T2 of any sample reflects the different relaxation effects in that sample. These combine as the sum so that:  2 where T2 is the observed relaxation time, T2Ν is the relaxation due to the effects of this orientation-dependent spin-spin relaxation, and T2base is the relaxation effect independent of this term.
Experimental work on collagen in tendon has shown the T2 relaxation times at angles of 0° to B0 and 90° to B0 are in the ratio of 1:4 (43), which is consistent with a relaxation dependence on (Δω)2. The dependence on the square of the energy difference is consistent with relaxation effects that are due to chemical exchange (44) or any random walk process in which net phase can be accumulated at a rate of either  or
or  . A model that includes exchange is consistent with spectroscopic models of tendon, as described by Dehl and Hoeve (45).
We therefore modeled the T2 of the peripheral nerve assuming that it includes significant ordered collagen as:  3
3
Thus, in fitting the data in Fig 3A, we included an additional pool that has an angle-independent T2, so that signal intensity, S, was fitted to:  4 where S1, S0, T2base, and á were varied so as to minimize the fitting error (a weighted least squares criteria was used, with the weights derived from the standard deviation of the data at each point). This provided a satisfactory fit to both the data from the median nerve and that from the flexor tendon (Fig 10).

Fit of median nerve, muscle, and flexor tendon data to the model described in the Appendix. There is a close fit for median nerve and flexor tendon, assuming a significant fraction of tissue with dipolar interactions. The muscle data fit without need for significant dipolar interactions.
References
- Received April 17, 2003.
- Accepted after revision June 16, 2003.
- Copyright © American Society of Neuroradiology
In this issue


Jump to section
Related Articles
Cited By...
- Comparing Orientation-Dependent Transverse Relaxation at 3T and 7T: Deciphering Anisotropic Relaxation Mechanisms in White Matter
- On the origin of R2 orientation dependence angle offsets in white matter
- Orientation dependent transverse relaxation in human brain white matter: The magic angle effect on a cylindrical helix
- Myelin water imaging depends on white matter fiber orientation in the human brain
- Visualization of Nigrosome 1 from the Viewpoint of Anatomic Structure
- Review of the principal extra spinal pathologies causing sciatica and new MRI approaches
- Magic Angle Effect: A Relevant Artifact in MR Neurography at 3T?