
Article Figures & Data
Figures
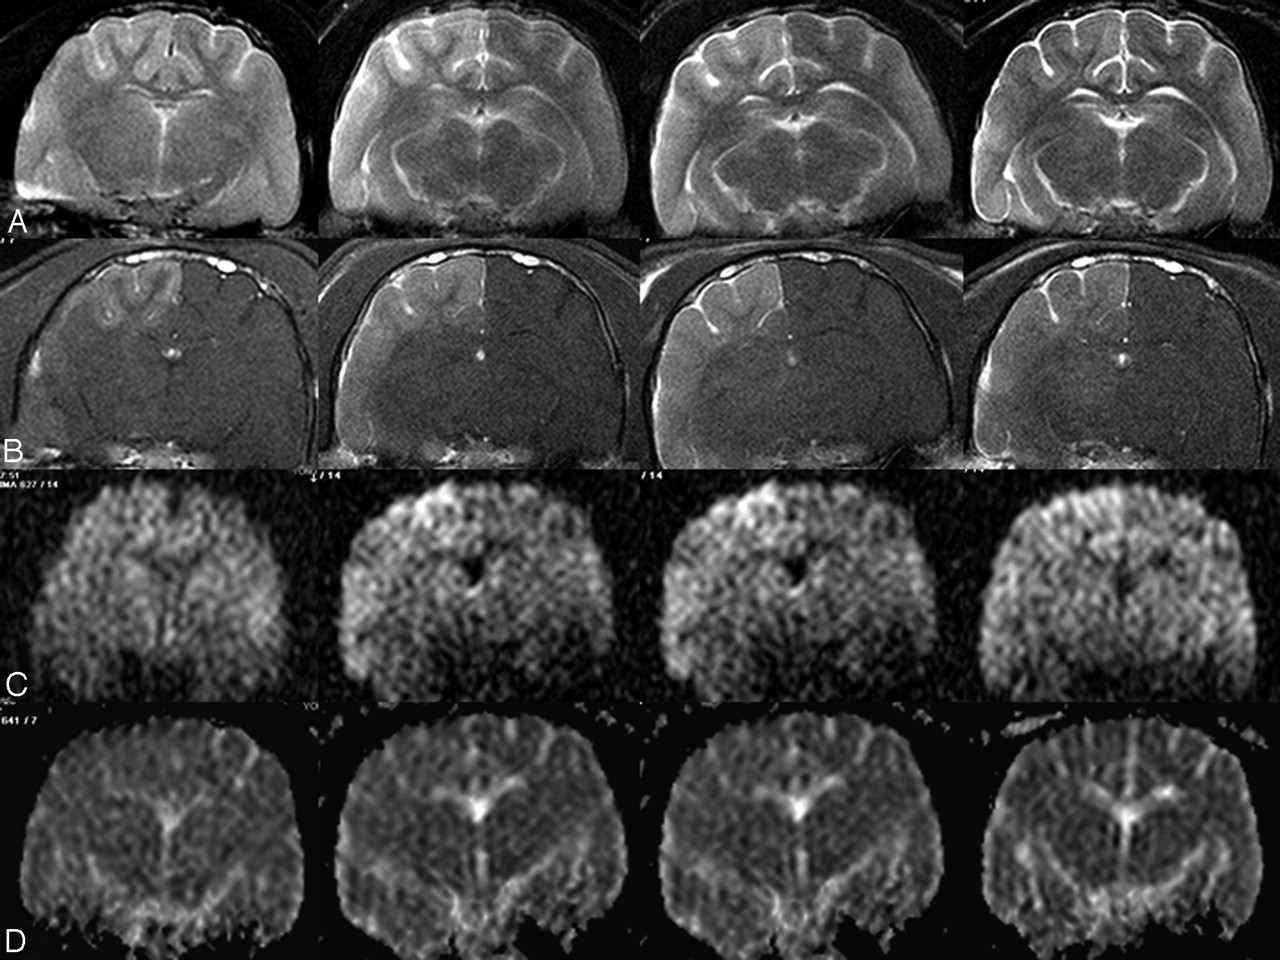
- Fig 1.
Sequential T2-weighted (A), Gd-enhanced T1-weighted (B), diffusion-weighted (C), and ADC map (D) images at 30 minutes (first column), 2 hours (second column), 4 hours (third column), and 6 hours (fourth column) after triolein emulsion infusion in cat 320. T2 hyperintensity (A) is shown at 30 minutes, extends into the subcortical white matter at 2 hours, is maximal in size and intensity at 4 hours, and decreases thereafter. Lesion enhancement on Gd-enhanced T1-weighted imaging (B) is revealed from 30 minutes, increases at 2 hours, and decreases thereafter. Diffusion-weighted images (C) show mild hyperintensity at 2, 4, and 6 hours. ADC map images (D) all reveal isointensity over time.

Tables
- TABLE 1:
Signal intensity ratios of lesion to contralateral normal side on T2-weighted images
Time n Mean ± SD Range 30 min 14 1.01 ± 0.07 0.90–1.16 2 h 14 1.13 ± 0.12 0.99–1.36 4 h 14 1.16 ± 0.11 1.02–1.43 6 h 14 1.12 ± 0.14 0.93–1.40 n indicates number of cats.
- Table 2:
Signal intensity ratios of lesion to contralateral normal side on Gd-enhanced T1-weighted images
Time n Mean ± SD Range 30 min 14 1.14 ± 0.15 1.00–1.53 2 hr 14 1.30 ± 0.20 1.02–1.68 4 hr 14 1.27 ± 0.17 0.94–1.64 6 hr 14 1.25 ± 0.17 0.95–1.53 n indicates number of cats.
- Table 3:
Signal intensity ratios of lesion to contralateral normal side on DWI and ADC map images
Time n Mean ± SD Range DWI 30 min 14 1.08 ± 0.09 0.95–1.23 2 h 14 1.15 ± 0.09 1.01–1.34 4 h 14 1.12 ± 0.18 0.77–1.40 6 h 14 1.11 ± 0.14 0.94–1.35 ADC 30 min 14 1.01 ± 0.12 0.86–1.29 2 h 14 1.17 ± 0.17 0.93–1.46 4 h 14 1.11 ± 0.19 0.84–1.36 6 h 14 1.05 ± 0.24 0.74–1.53 n indicates number of cats.
- Table 4:
Relative ratios of lesion to contralateral normal side on perfusion-weighted images
Time n Mean ± SD Range rCBV 30 min 14 1.03 ± 0.20 0.72–1.35 2 h 14 0.96 ± 0.23 0.67–1.23 4 h 14 0.98 ± 0.09 0.82–1.14 6 h 14 1.00 ± 0.15 0.84–1.30 rCBF 30 min 14 1.12 ± 0.39 0.53–1.82 2 h 14 1.07 ± 0.36 0.25–1.38 4 h 14 1.14 ± 0.34 0.64–1.75 6 h 14 0.94 ± 094 0.53–1.15 MTT 30 min 14 0.98 ± 0.07 0.89–1.08 2 h 14 0.97 ± 0.15 0.70–1.21 4 h 14 0.95 ± 0.09 0.80–1.08 6 h 14 0.99 ± 0.10 0.87–1.17 Note.—n indicates number of cats; rCBV, relative cerebral blood volume; rCBF, relative cerebral blood flow; MTT, mean transit time.
In this issue


Jump to section
Related Articles
Cited By...
- No citing articles found.