
Abstract
BACKGROUND AND PURPOSE: Clinical MR imaging scanners now offer many choices of hardware configurations that were not available in the first 25 years of their existence. Our goal was to assess the influence of coil technology, magnetic field strength, and echo time (TE) on the sensitivity, reflected by the signal intensity-to-noise-ratio (SNR) and reproducibility of proton MR spectroscopy (1H-MR spectroscopy).
MATERIAL AND METHODS: The SNR, the intersubject reproducibility, and the intrasubject reproducibility of N-acetylaspartate (NAA), creatine (Cr), and choline (Cho) levels were compared at the common TEs of 30, 144, and 288 ms, by using 1H-MR spectroscopy in 6 volunteers at (1) 3T with a single-element quadrature (SEQ); (2) 1.5T with SEQ; and (3) 1.5T with a 12-channel phased-array (PA) head coil.
RESULTS: In terms of sensitivity, the best SNR for all metabolites was obtained at the shortest TE (30 ms). It was comparable between the 3 and 1.5T with the PA, but ∼35% better than the 1.5T with SEQ. This SNR difference declined <25% at TE of 144 ms and to equity among all imagers at TE of 288 ms. Reproducibility, reflected in the coefficient of variation (CV), was best for NAA at TE of 288 ms, 15%–50% better than at TE of 30 ms in either gray (GM) or white matter (WM). The CV for Cr was best, at TE of 288 ms for GM, but its WM results were independent of TE. Metabolite level reproducibility did not depend on coil technology or magnetic field strength.
CONCLUSIONS: For the same coil type, the SNR of all major metabolites was ∼35% better at 3T than at 1.5T. This advantage, however, was offset at 1.5T with a PA coil, making it a cost-effective upgrade for existing scanners. Surprisingly and counterintuitively, despite the lowest SNR, the best reproducibility was obtained at the longest TE (288 ms), regardless of field or coil.
In the first 2 decades of clinical neuro-MR imaging, the instrumentation offered by the mainstream manufacturer was limited to a magnetic field strength, B0, of 1.5T and a single-element quadrature (SEQ) coil to its many variants. Although higher B0, 3- to 4T scanners,1–3 and custom multichannel phased arrays (PA) have been operational since the early 1990s,4,5 neither technology was packaged into FDA-approved clinical products until nearly a decade later.
Each of these technologies can by itself increase the sensitivity, as reflected by the signal intensity-to-noise-ratio (SNR) per unit time of brain MR imaging and proton MR spectroscopic imaging (1H-MR spectroscopy), via a different mechanism. Higher B0 values can theoretically achieve linear improvements in field strength,6,7 though T2 losses during the echo time (TE) reduce the actual gain to 20%–30% for doubling B0 values from 1.5 to 3T.8–11 The PA extends to the entire head the up to 10-fold SNR benefits from the improved filling-factor of surface coils.12–14 Because these mechanisms are independent, their SNR advantages can be combined potentially for even greater overall gain.15
Although many 1H-MR spectroscopy studies have examined the influence of B0 or coil technology on the SNR,16 few investigated the clinically more relevant quantity, reproducibility.17–20 Even then, the focus was always on the performance of a specific hardware and sequence combination and not, to our knowledge, on optimizing both for reproducibility. In light of the clinical relevance of resolving “normal” from “pathological,” the new choices of B0 values, coils, sequence-parameters, and their substantial cost difference, establishing optimal setup for reproducibility for each configuration seems to be timely. Consequently, our aim was to evaluate the dependence of the reproducibility and the SNR of the major 1H-MR spectroscopy observable metabolites: N-acetylaspartate (NAA), choline (Cho), and creatine (Cr) on the magnetic field strength, coil technology, and TE.
Methods
Subjects
We chose for this study a cohort of healthy young volunteers to minimize the “biologic noise.” Specifically, we assumed that the physiologic variations of the concentrations of the different metabolites in analogous regions in their brains would be the smallest. Consequently, 6 healthy volunteers (3 women and 3 men; mean age, 26 years; age range, 22–28 years) were enrolled. The study was approved by our institutional review board, and each subject was briefed on the procedure they were about to undergo and gave written informed consent.
MR Imaging and 1H-MR Spectroscopy Acquisition
The experiments were conducted on 3 different MR scanners: (1) A 3T head-only imager with a SEQ transmit-receive head coil; (2) a 1.5T whole-body instrument with a SEQ receive-only coil; and (3) a 1.5T whole-body with a 12-channel receive-only PA head coil. All scanners were from the same manufacturer and used in their standard commercial brain MR imaging/MR spectroscopy configuration.
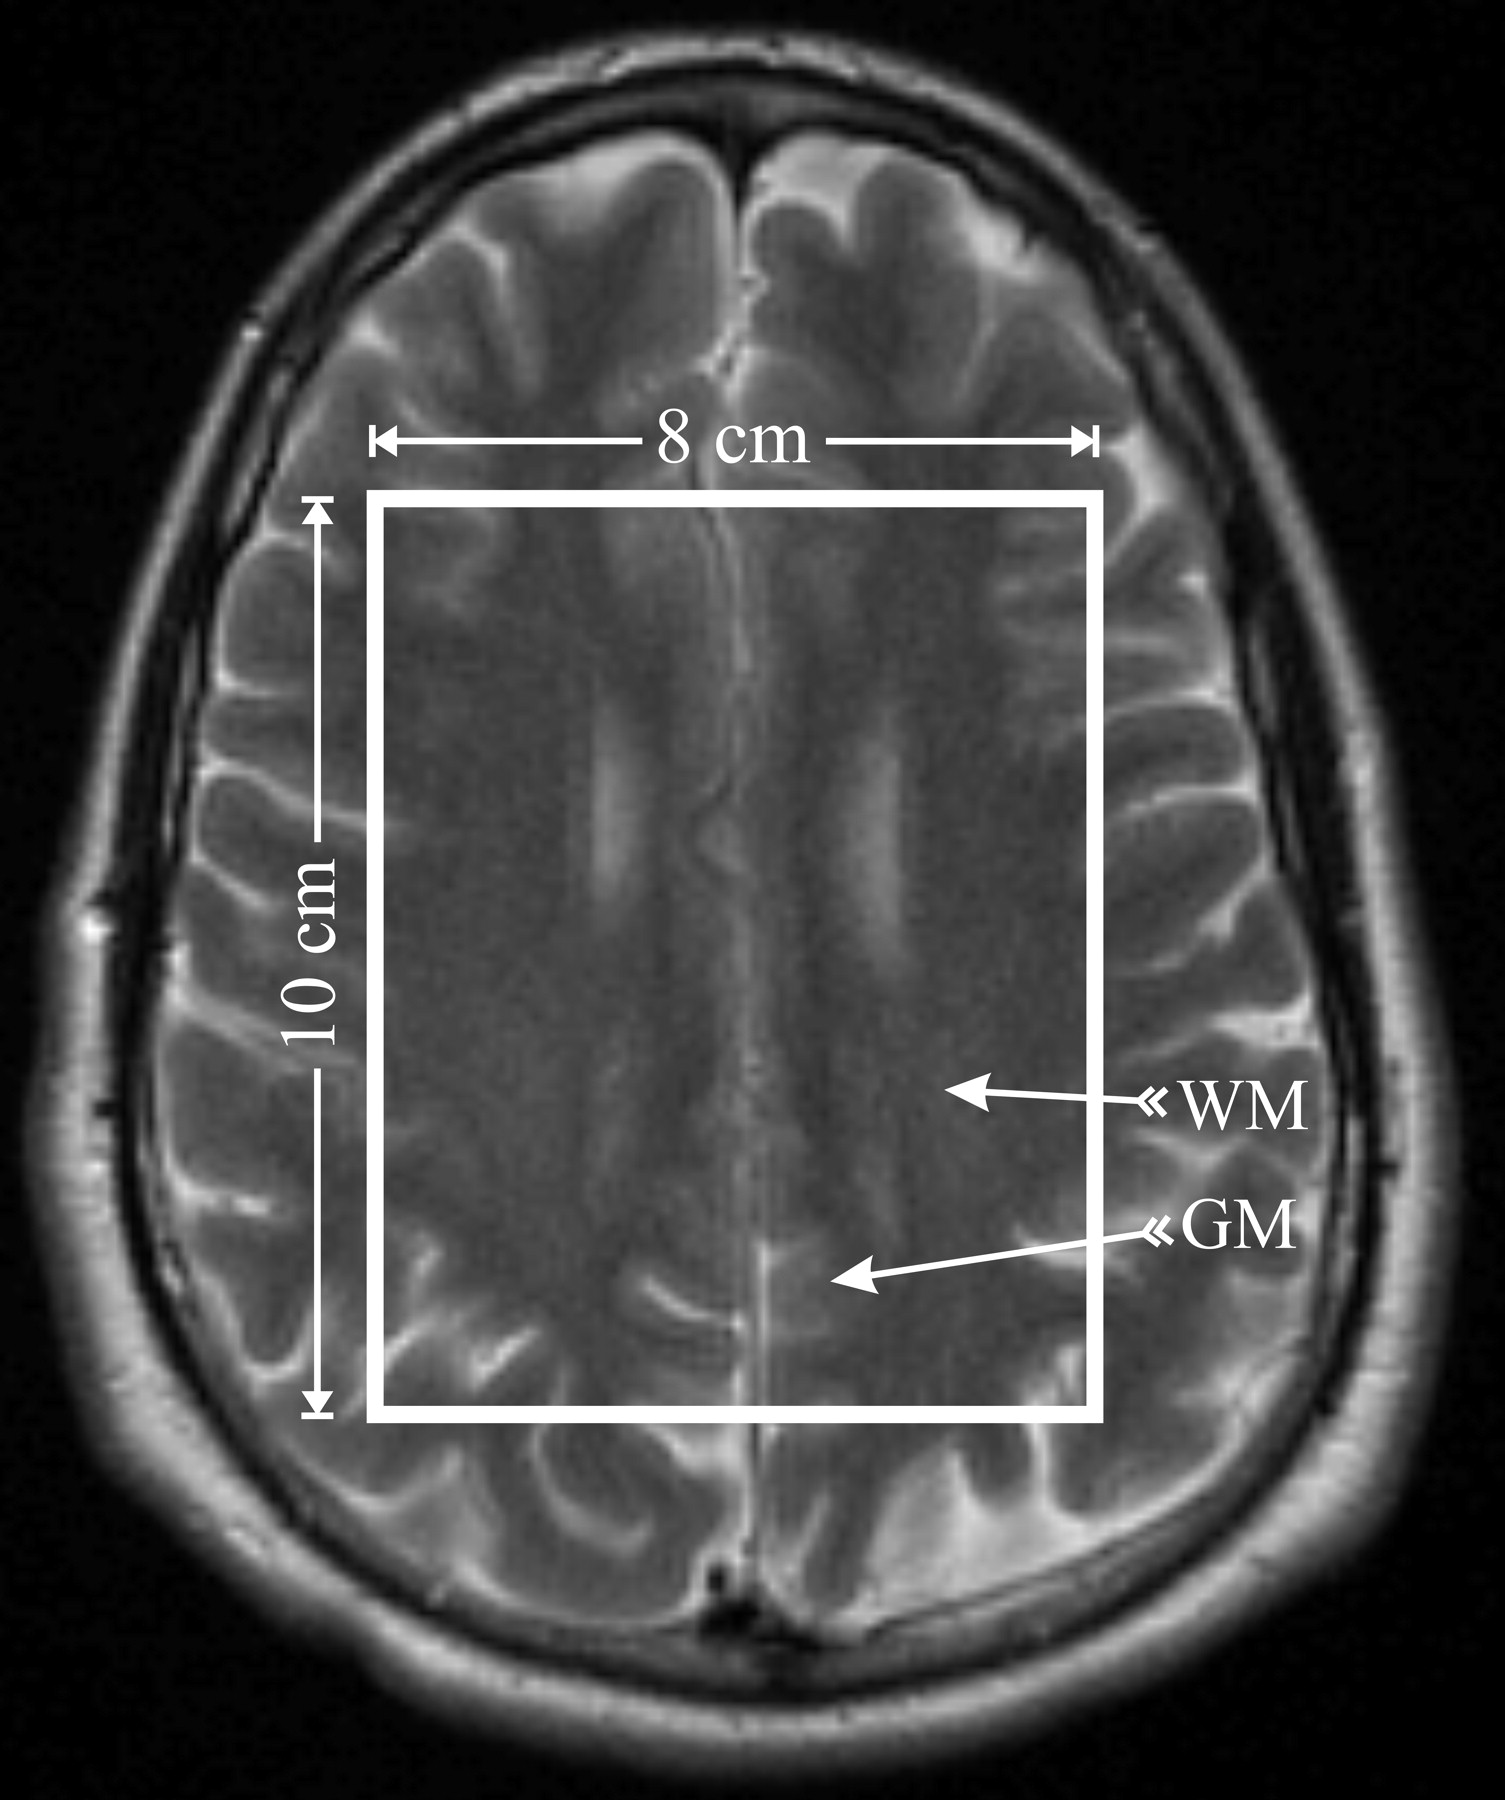
Fifteen 5-mm-thick axial T2-weighted (retention time [TR]/TE = 6000/99 ms; 90° flip angle; 256 × 256 matrix; 24 × 24 cm2 field of view [FOV]) images were used to guide an 8-cm left-right × 10-cm anteroposterior × 1.5-cm inferior-superior volume of interest (VOI). It was placed onto a similar brain location, shown in Fig 1, in every subject by an experienced neuroradiologist (M.L.). The VOI was excited by using point-resolved spectroscopy (PRESS) and partitioned into the superior border of the lateral ventricles 8LR × 10AP voxels, 1 × 1 × 1.5 mL each, with 16 × 16 2D chemical shift imaging (CSI) along a 16LR × 16AP-cm FOV, with the same radio-frequency pulses, section-select, crusher gradients strengths, slew-rates, and duration on all 3 imagers. The signal intensity was acquired at 500-Hz bandwidth with 1024 complex points at 1.5T and 1 kHz with 2048 points at 3T, to yield equal (1 Hz per point) spectral resolution at each B0.

Axial, T2-weighted MR imaging of a healthy female volunteer, superimposed with the 8LR × 10AP × 1.5IS = 120 mL MR spectroscopy VOI (solid white outline), which was placed over similar anatomy (superior margin of the lateral ventricles) in all 6 subjects by a neuroradiologist. The VOI was partitioned into 8LR × 10AP voxels, 1.5 mL each. Arrows indicate the WM and GM voxels selected for the analyses in each subject.
The 2D 1H-MR spectroscopy in the VOI was repeated at short, intermediate, and long TEs (30, 144, and 288 ms), back to back, all with the same TR (1850 ms) for each of the 6 subjects. Every subject was scanned on all 3 instruments in the same day.
1H-MR Spectroscopy Quantification
Residual water was removed from the MR spectroscopy data in the time domain,21 and the signals were apodized with a 2-Hz lorentzian, voxel-shifted to align the CSI grid with the VOI of the NAA,22 and Fourier-transformed in the spatial and spectral directions. Automatic frequency, zero, and first-order phase corrections were made by using the NAA and Cr peaks for reference in each voxel.10 Relative amounts of the ith (= NAA, Cr, or Cho) metabolite in the jth (= 1 … 80) voxel of the kth (= 1 … 6) subject, Qijk, were estimated from the spectral peak areas, Sijk, by using parametric spectral modeling and least-squares optimization.23 The Qijk’s were converted into absolute amounts by repeating the 1H-MR spectroscopy on a reference 3-L sphere of 0.033 mol of NAA in water as24,25  1) where S̄R is the reference’s voxels average NAA peak area. Because 2 coils were receive-only, no corrections for loading were made. Because the same subjects were compared in all imagers, we assume that the errors associated with this omission had little effect on the conclusions.
The Qijk from Equation (1) were corrected for the differences in the relaxation times between the reference phantom T1/T2 values (NAA only, T1ref = 1.4 seconds, T2ref = 0.5 seconds at 1.5T) and those reported in vivo: NAA T1/T2 = 1.4/0.43 seconds; Cr = 1.6/0.21 seconds; Cho = 1.2/0.36 seconds at 1.5T26,27 and similar T1 but shorter T2s of 230, 150, and 186 ms, respectively,28,29 at 3T, by using25  2)
2)
Because similar brain locations were compared in all subjects, as shown in Fig 1, possible regional T1 or T2 variations29 were ignored. SNR, defined as the ratio of the peak height, hijk (= Sijk/T2i)30 to the root mean square of the noise,31 was automatically estimated in each voxel.
Statistical Analyses
Mixed model analysis of variance was used to compare imagers and TEs with respect to the mean, SNR, and coefficient of variations (CV = SD/average) of the NAA, Cr, and Cho levels. A separate analysis was conducted for each outcome (mean, SNR, CV) of each metabolite within each tissue type (gray matter [GM] or white matter [WM]). In each case, the dependent variable comprised the outcome levels observed for all subjects and the model included machine and TE as fixed classification factors as well as the term representing their interaction. The covariance structure was modeled by assuming observations to be correlated or independent when acquired from the same or different subjects, respectively, with the strength of correlation dependent on whether the data were from the same session and by allowing the error variance to differ across machines and TEs. Within this framework, likelihood ratio tests were used to compare machines and TEs with respect to CV, whereas Tukey honestly significant difference (HSD) procedure was used to make all pairwise comparisons among machines and TEs in terms of mean levels and SNR while maintaining the family-wise significance level for the set of comparisons at or below the 5% level.
Results
Overall, for 6 (subjects) × 3 (TEs) × 3 (scanners) this study yielded 54 1H-MR spectroscopy datasets. The SNRs for the NAA, Cr, and Cho, in the GM and WM, 3 imagers, 2 coil types, and 3 TEs, are compiled in Table 1 and the CVs in Table 2. Because of numerous possible pairwise statistical comparisons among these variables, we summarize, for the sake of simplicity, only the specific findings pertaining to sensitivity and reproducibility.
Signal intensity-to-noise-ratio (SNR) values in gray matter (GM) and white matter (WM) from the volunteers for selected metabolites
Within-subject CVs for selected metabolites at different echo times (TE) in gray matter (GM) and white matter (WM) of volunteers
Sensitivity (SNR)
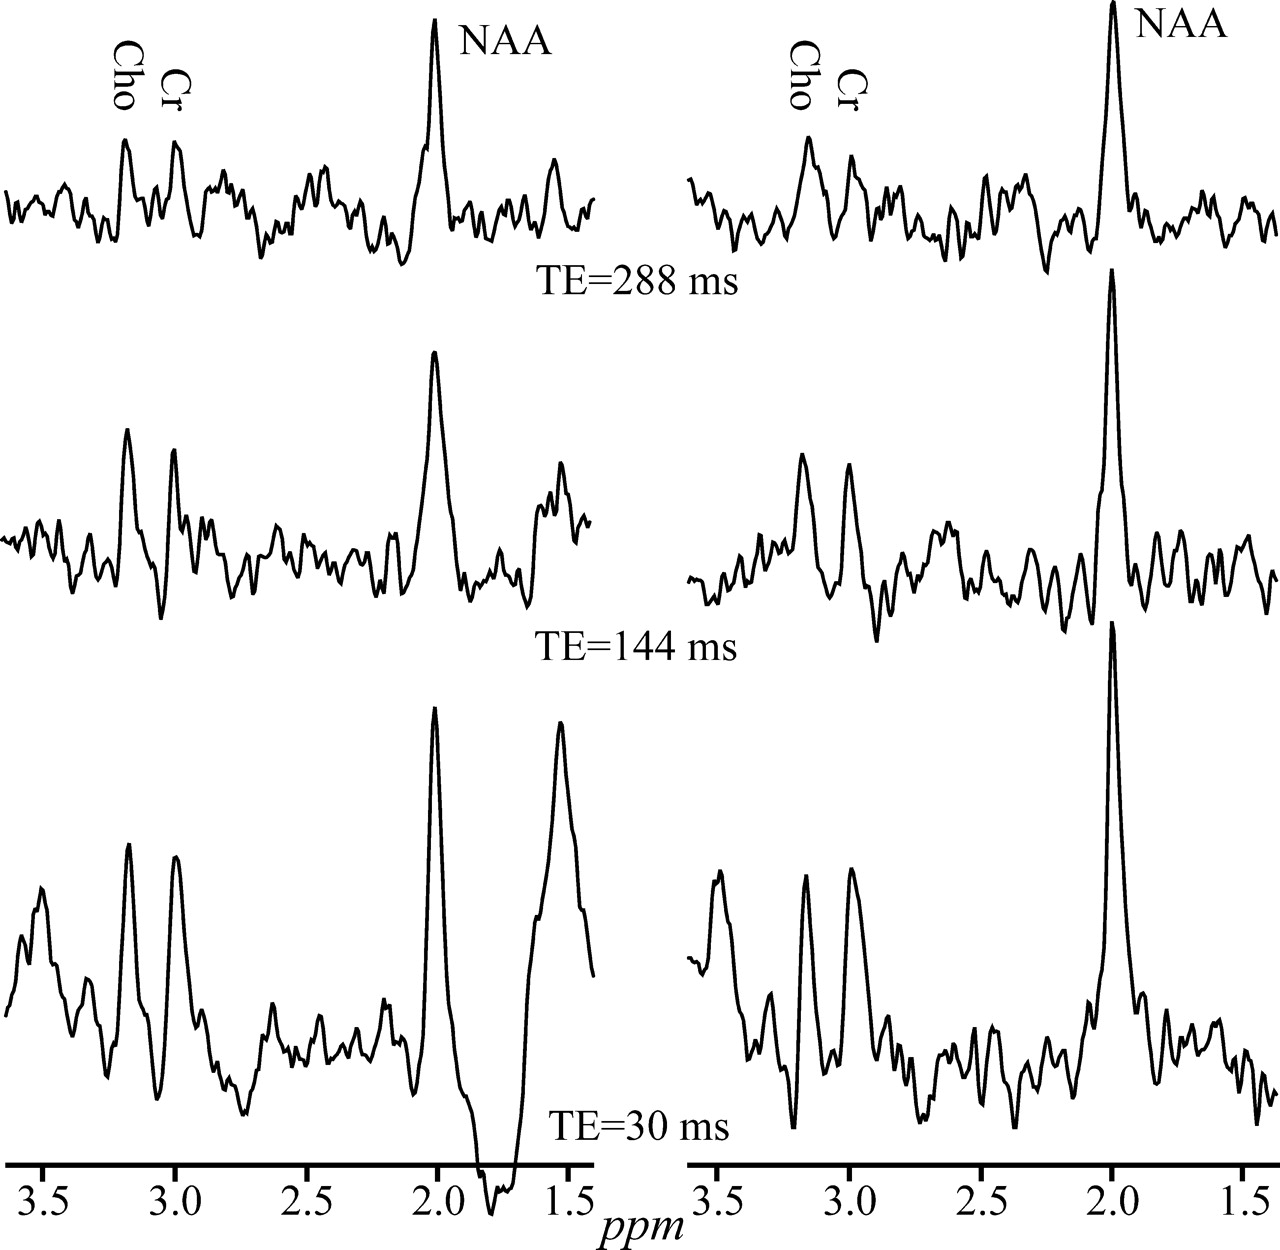
It was no surprise that the best SNRs, compiled in Table 1, were obtained at the short TE (30 ms) for all metabolites, magnetic fields, tissue types, and coil technology, as demonstrated in Fig 2. It was quite a surprise, however, that the SNR at 3T + SEQ coil was statistically indistinguishable from that of a 1.5T imager with PA. Both were significantly better (∼50%) than that of the 1.5T with SEQ coil, as shown in Fig 3. The similarity of the SNRs at 3T and 1.5T with PA recurred at the intermediate TE (144 ms) but they were now only <25% better than the 1.5T with SEQ. At the long TE (288 ms) the SNRs of all metabolites were on par regardless of field or coil.

Real part of the GM 1H-MR spectrum acquired at 1.5T with a SEQ coil at short (30 ms), intermediate (144 ms), and long TE (288 ms) in 2 female volunteers, displayed on common intensity (vertical) and indicated chemical shift (parts per million [ppm]) scales. Note the consistent pattern of increasing NAA, Cr, and Cho SNRs with decreasing TE in both subjects and the between-subjects spectra feature consistency.

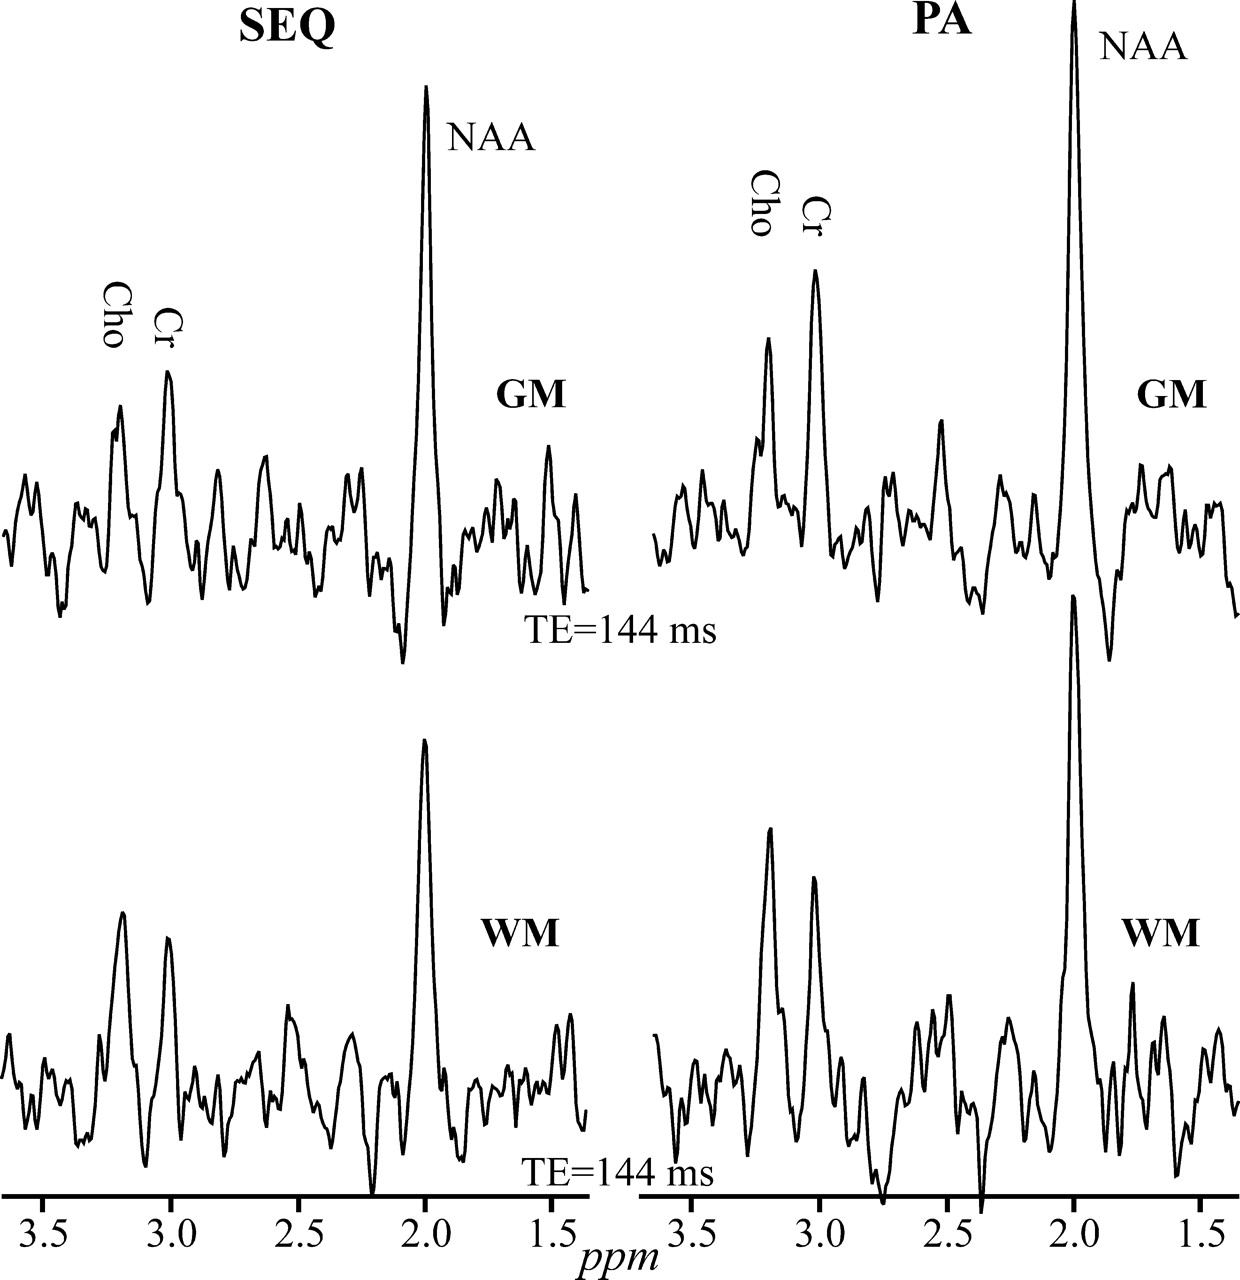
Comparison between the real part of the GM (top) and WM (bottom) 1H-MR spectroscopy (TE = 144 ms) on common intensity and ppm scales, acquired from the same 2 voxels in a male volunteer at 1.5T with SEQ (left) and PA (right) coils. Note the higher SNRs for all metabolites in both GM and WM at with the PA versus SEQ coil.
Reproducibility (CV)
Within-subject reproducibility, expressed as CVs, is compiled in Table 2 as functions of B0, tissue type, metabolite, and coil technology. To our astonishment, despite the lowest SNR, the best reproducibility was obtained at the longest TE (288 ms) for all metabolites, tissue type field, or coil technology. The reproducibility of NAA was 15%–50% worse (larger CVs) at the shortest TE (30 ms) across all imagers. This pattern of longer TE associated with better reproducibility was also observed for Cr in the GM, whereas its WM results were indistinguishable across all TEs and imagers. The reproducibility of the Cho concentrations was similar in both GM and WM at 3T, ∼30% better than at 1.5T, regardless of coil technology.
Discussion
Our spectroscopic tool of choice for this comparison was 2D multivoxel 1H-MR spectroscopy over the simpler more common single-voxel (SV) variants for 2 reasons: first, this technology facilitates much smaller voxels—typically <1 mL for the former versus >3 mL for the latter—which translate to much better spatial resolution. Second, we also wished to exploit the voxel-shift property of CSI,22 to be able to position voxels, in postprocessing, as precisely as possible over the same anatomy across all subjects. We assume, on the basis of the literature, that variations would have been smaller if larger voxels had been used, because of smaller GM/WM/CSF partial volume impact on their content.20 However, this would have come at the cost of lower spatial resolution, making “mostly GM” voxels, for example, more difficult to define.
Because the new clinical MR imaging scanners now offer a wide selection of hardware configurations and performance choices that were not available in the past, the aim of this study was to investigate the influence of coil technology, B0, and TE on the sensitivity and reproducibility (SNR and CV) of 1H-MR spectroscopy. The goal was to identify hardware and methodology configurations that led to better 1H-MR spectroscopy in the brain (ie, what is the current “best” and the best way to achieve it).
Although a linear SNR increase with B0 was theoretically predicted for 1H-MR spectroscopy,32,33 it was not actually realized. Lower-sensitivity coils, poorer shimming, and shorter T2s combine to reduce the expected gain to a more realistic 25%–50%, depending on the TE.9,10,34 Therefore, our a priori expectation was that the higher (3T) field imager will also yield similar SNR improvements over the 1.5T imagers. Indeed, (1) for the same coil technology, the 3T yielded better SNR than its 1.5T counterpart, which is consistent with previous reports,9,10 and (2) the best SNR for all metabolites and tissue types for a respective scanner was obtained at the shortest TE (30 ms), as shown in Table 1. That high field advantage, however, was offset by the PA coil on the 1.5T imager, which indicates that the latter is also worth 25%–50% SNR gain, but at a cost that is an order of magnitude lower. This was further corroborated by comparing the 2 1.5T scanners (ie, the SEQ vs PA coils) with the latter offering ∼50% better SNR over the former (Table 1). Therefore, although a PA coil was not offered by the manufacturer for our 3T imager, its stands to reason that the best SNR overall would have been attained with it at the higher B0.
Despite the SNR gain, the PA coil is not without its own disadvantages compared with transmit-receive SEQ coils. For MR spectroscopy applications, PA coils suffer in 3 main areas: first, their receive-only nature precludes straightforward, reciprocity-based loading corrections, detracting from the precision of intersubject absolute quantification; second, the consequent requirement for body-coil transmit restricts the strength of the radio-frequency fields attainable with it and greatly increases the power deposition (SAR); third, the different local receive sensitivity profiles of PA coils may lower the precision of their regional, intrasubject, absolute-level comparisons. Corrections for the first and third issues, especially for multivoxel arrays, is complex35,36 and, in clinical settings, unlikely to be implemented by any manufacturer in the near future.
The most surprising finding in this study was that the best reproducibility was obtained at the longest TE (288 ms), where the SNR was worst, regardless of metabolite, tissue type, magnetic field, or coil technology. Our intuitive expectation was that with better SNR, obtained at the shorter TE, we could expect to better distinguish smaller changes. Because clinical applications require differentiating reliably and consistently “normal” from “abnormal,” reproducibility is arguably more useful than SNR. Consequently, for current clinical applications—especially longitudinal or comparative studies focused on NAA, Cr, and Cho—the longer TEs are better performers, even though modern imagers with their fast shielded gradients and efficient transmit-receive coils could produce TEs more than an order of magnitude shorter.
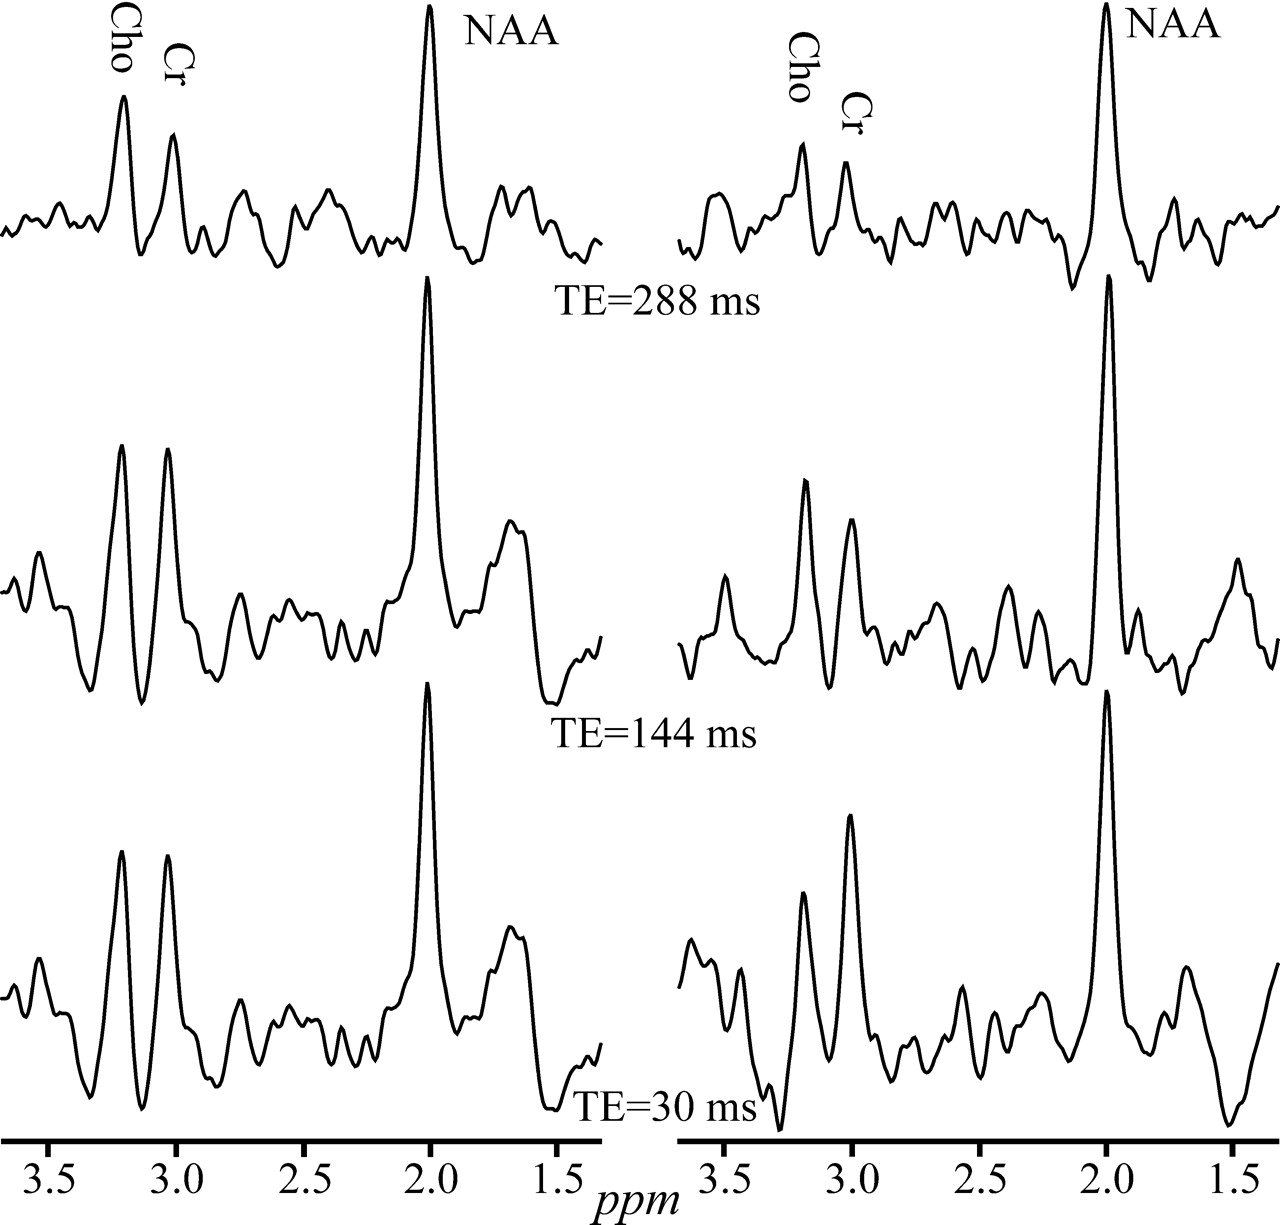
In retrospect, several reasons could account for this counterintuitive finding. First, the more undulating baseline characteristics of shorter TEs—shown in Figs 2 and 4—could add random quantification noise. This hypothesis is supported by the fact that the greatest benefactor from this improvement is the NAA (Table 2), which is also the closest to the offending leaking-lipid resonances. Second, several brain macromolecular metabolites that give rise to the broad resonances37 underlie primarily the NAA, and only to a lesser extent the Cr and Cho peaks. Compared with the metabolites of interest, these macromolecules undergo more rapid T2 decay into the noise at long TEs, increasing the precision of numeric fitting. Finally, the extraneous lipids signals which may “leak” into the VOI also experience T2 decay at long TEs, yielding a flatter baseline and, consequently, more reproducible quantification especially, again, for the NAA, as demonstrated in Figs 2 and 4.

Real part of the GM 1H-MR spectra, at 3T with SEQ coil, from 2 healthy male volunteers, at short, intermediate, and long TEs, displayed on common intensity and chemical shift scales. Note the reduced baseline undulations at the longest TE (288 ms) in both subjects compared with the intermediate and short TEs.
Conclusion
Our data indicate that long TEs yield better reproducibility, which is arguably the most valuable attribute for clinical applications. Therefore, because setting long TEs (270 or 288 ms) is a trivial user setting at scan time, this could be the preferred choice for those clinical applications focusing on metabolites with long T2 singlet peaks. In addition, the SNR gain afforded by a PA coil upgrade is very cost-effective (∼50%). Most important, on the basis of our findings, we assume the combination of a 3T and a PA coil, not available to us in this study, holds the most promise of dramatically enhancing performance from the B0 doubling of these new high-field imagers with anticipated results potentially ushering in a new “gold standard.”
Footnotes
This work was supported by National Institutes of Health grants EB01015, NS050520, NS051623, and NS39135 and by the Martin S. Davis Research Fellowship Endowment from the National Multiple Sclerosis Society.
References
- Received March 30, 2005.
- Accepted after revision August 1, 2005.
- Copyright © American Society of Neuroradiology


