Advertisement

Main menu

  • Home
  • Content
    • Current Issue
    • Accepted Manuscripts
    • Article Preview
    • Past Issue Archive
    • AJNR Case Collection
    • Case of the Week Archive
    • Classic Case Archive
    • Case of the Month Archive
  • Special Collections
    • Spinal CSF Leak Articles (Jan 2020-June 2024)
    • 2024 AJNR Journal Awards
    • Most Impactful AJNR Articles
  • Multimedia
    • AJNR Podcast
    • AJNR Scantastics
    • Video Articles
  • For Authors
    • Submit a Manuscript
    • Author Policies
    • Fast publishing of Accepted Manuscripts
    • Graphical Abstract Preparation
    • Manuscript Submission Guidelines
    • Imaging Protocol Submission
    • Submit a Case for the Case Collection
  • About Us
    • About AJNR
    • Editorial Board
  • More
    • Become a Reviewer/Academy of Reviewers
    • Subscribers
    • Permissions
    • Alerts
    • Feedback
    • Advertisers
    • ASNR Home
  • Other Publications
    • ajnr

User menu

  • Alerts
  • Log in

Search

  • Advanced search
American Journal of Neuroradiology

American Journal of Neuroradiology

ASHNR American Society of Functional Neuroradiology ASHNR American Society of Pediatric Neuroradiology ASSR
  • Alerts
  • Log in

Advanced Search

  • Home
  • Content
    • Current Issue
    • Accepted Manuscripts
    • Article Preview
    • Past Issue Archive
    • AJNR Case Collection
    • Case of the Week Archive
    • Classic Case Archive
    • Case of the Month Archive
  • Special Collections
    • Spinal CSF Leak Articles (Jan 2020-June 2024)
    • 2024 AJNR Journal Awards
    • Most Impactful AJNR Articles
  • Multimedia
    • AJNR Podcast
    • AJNR Scantastics
    • Video Articles
  • For Authors
    • Submit a Manuscript
    • Author Policies
    • Fast publishing of Accepted Manuscripts
    • Graphical Abstract Preparation
    • Manuscript Submission Guidelines
    • Imaging Protocol Submission
    • Submit a Case for the Case Collection
  • About Us
    • About AJNR
    • Editorial Board
  • More
    • Become a Reviewer/Academy of Reviewers
    • Subscribers
    • Permissions
    • Alerts
    • Feedback
    • Advertisers
    • ASNR Home
  • Follow AJNR on Twitter
  • Visit AJNR on Facebook
  • Follow AJNR on Instagram
  • Join AJNR on LinkedIn
  • RSS Feeds

Welcome to the new AJNR, Updated Hall of Fame, and more. Read the full announcements.


AJNR is seeking candidates for the position of Associate Section Editor, AJNR Case Collection. Read the full announcement.


Research ArticleBRAIN

Histogram Analysis versus Region of Interest Analysis of Dynamic Susceptibility Contrast Perfusion MR Imaging Data in the Grading of Cerebral Gliomas

M. Law, R. Young, J. Babb, E. Pollack and G. Johnson
American Journal of Neuroradiology April 2007, 28 (4) 761-766;
M. Law
  • Find this author on Google Scholar
  • Find this author on PubMed
  • Search for this author on this site
R. Young
  • Find this author on Google Scholar
  • Find this author on PubMed
  • Search for this author on this site
J. Babb
  • Find this author on Google Scholar
  • Find this author on PubMed
  • Search for this author on this site
E. Pollack
  • Find this author on Google Scholar
  • Find this author on PubMed
  • Search for this author on this site
G. Johnson
  • Find this author on Google Scholar
  • Find this author on PubMed
  • Search for this author on this site
  • Article
  • Figures & Data
  • Info & Metrics
  • Responses
  • References
  • PDF
Loading

Article Figures & Data

Figures

  • Tables
  • Fig 1.
    • Download figure
    • Open in new tab
    • Download powerpoint
    Fig 1.

    Sample histogram. Percentile mean and SD measures are calculated from the top 50%, 25%, and 10% of the histogram curve. Skewness is zero if the data are distributed symmetrically around the mean, negative if the data are more spread out on the left of the mean, and positive if the data are more spread out on the right of the mean. Kurtosis, a measure of how “peaked” the histogram is, equals zero if the histogram is Gaussian, is positive if the histogram has a sharper peak, and is negative if it has a flatter top.
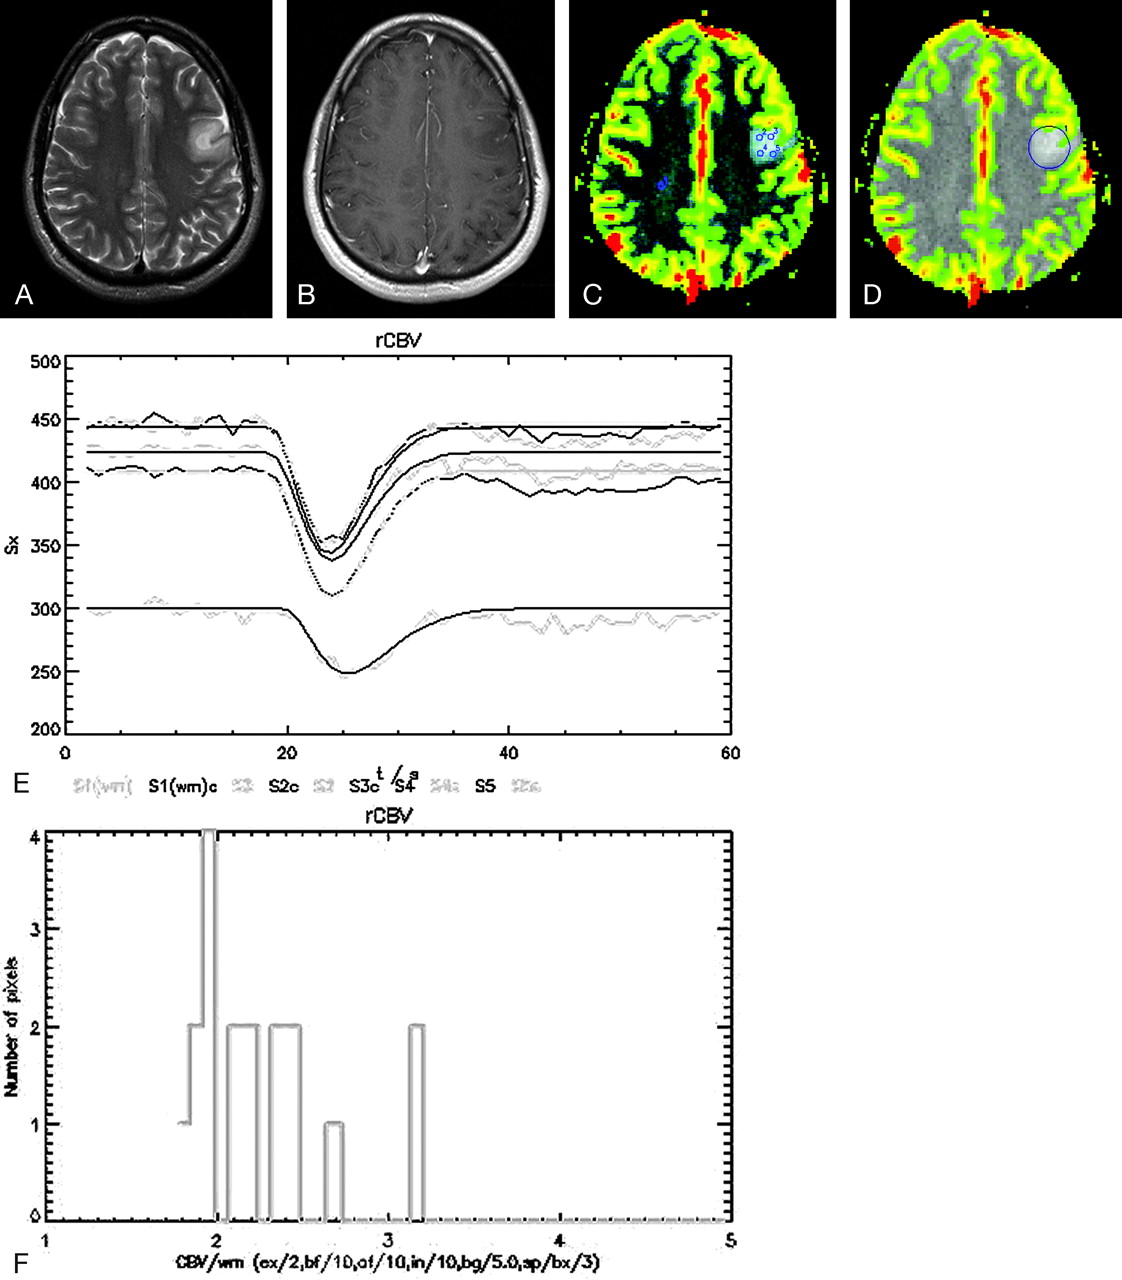
  • Fig 2.
    • Download figure
    • Open in new tab
    • Download powerpoint
    Fig 2.

    Low-grade glioma (grade II/IV) in left frontal lobe, T2-weighted (A) and contrast T1-weighted (B) images. The rCBVmax method uses 4 small ROIs targeted to foci of greatest perfusion on the rCBV map (C), with the maximal rCBV recorded from the subsequent perfusion curves (E). The signal intensity curves from each of the 5 ROIs are denoted as S1, S2, S3, S4, and S5, where S1 is the signal intensity curve for the ROI placed in normal brain and S2–S5 are the other ROIs placed in the tumoral tissue. These 5 signal intensity curves were obtained from a single section from the perfusion dataset. The rCBV histogram method uses a single ROI (D) that encompasses the maximal tumor diameter to generate the histogram curve (F), from which multiple metrics are derived.
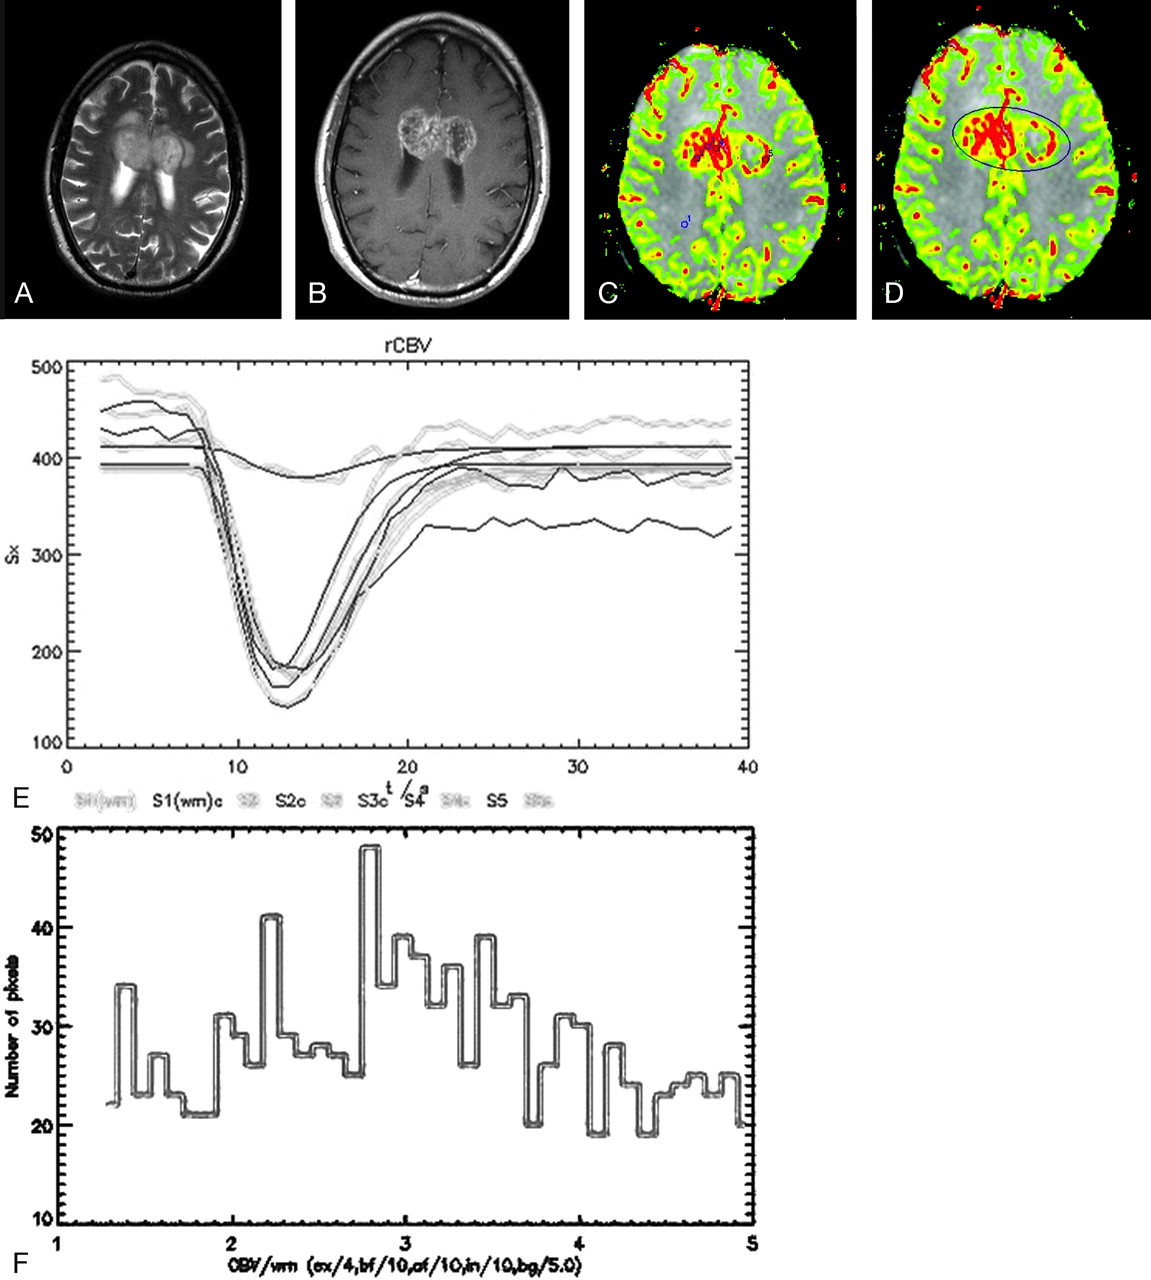
  • Fig 3.
    • Download figure
    • Open in new tab
    • Download powerpoint
    Fig 3.

    High-grade glioma, glioblastoma multiforme (grade IV/IV) in frontal lobes spanning the corpus callosum. T2-weighted (A) and contrast T1-weighted (B) images are shown along with rCBVmax map (C) with ROIs targeted to avoid areas of radiologic necrosis to determine perfusion curves (E). rCBV histogram map (D) and histogram curve (F) are derived from the maximal tumor diameter regardless of heterogeneity.

Tables

  • Figures
    • View popup
    Table 1:

    Mean ± SD for rCBV histogram measures

    Grade
    IIIIIIV
    Median1.14 ± 0.492.86 ± 1.132.72 ± 0.68
    Mean1.24 ± 0.472.90 ± 0.832.83 ± 0.68
    SD0.49 ± 0.322.31 ± 0.322.32 ± 0.29
    Mean501.58 ± 0.583.65 ± 0.933.63 ± 0.86
    SD500.46 ± 0.361.96 ± 0.311.94 ± 0.32
    Mean251.85 ± 0.664.12 ± 0.824.12 ± 0.81
    SD250.38 ± 0.331.80 ± 0.341.70 ± 0.33
    Mean102.18 ± 0.764.55 ± 0.764.46 ± 0.71
    SD100.35 ± 0.331.64 ± 0.421.54 ± 0.31
    Skew1.07 ± 0.830.46 ± 1.120.46 ± 0.78
    Kurt1.60 ± 3.040.59 ± 3.43−0.26 ± 1.18
    PH0.22 ± 0.090.20 ± 0.180.19 ± 0.16
    PP1.10 ± 0.613.28 ± 1.853.34 ± 1.75
    A1SD0.66 ± 0.110.55 ± 0.200.55 ± 0.18
    • Note:—rCBV indicates relative cerebral blood volume; mean50, mean of the top 50% of the histogram; SD50, SD of the top 50%; mean25, mean of the top 25%; SD25, SD of the top 25%; mean10, mean of the top 10%; SD10, SD of the top 10%; skew, skewness; kurt, kurtosis; PH, peak height of the histogram; PP, peak position (ie, the mode); and A1SD, area under the histogram curve within 1 SD.

    • View popup
    Table 2:

    rCBVT histogram metrics compared with rCBVmax and glioma grade, with correlation factors (r values) and Bonferroni-corrected significance <.005 (P values)

    rCBVmaxGrade
    r valueP valuer valueP value
    Median0.68880<.00010.65849<.0001
    Mean0.69444<.00010.67710<.0001
    SD0.66036<.00010.71758<.0001
    Mean500.68600<.00010.68166<.0001
    SD500.53042<.00010.68441<.0001
    Mean250.66355<.00010.68254<.0001
    SD250.53365<.00010.66394<.0001
    Mean100.63072<.00010.66342<.0001
    SD100.57135<.00010.67416<.0001
    Skew−0.42895<.0001−0.26876.0096
    Kurt−0.29511.0043−0.34505.0008
    PH−0.11601.2708−0.21640.0383
    PP0.63647<.00010.62906<.0001
    A1SD−0.22241.0331−0.23301.0254
    • Note:—rCBV indicates relative cerebral blood volume; mean50, mean of the top 50% of the histogram; SD50, SD of the top 50%; mean25, mean of the top 25%; SD25, SD of the top 25%; mean10, mean of the top 10%; SD10, SD of the top 10%; skew, skewness; kurt, kurtosis; PH, peak height of the histogram; PP, peak position (ie, the mode); and A1SD, area under the histogram curve within 1 SD. The highest correlations in each category are underlined; the metrics achieving significance are in bold.

    • View popup
    Table 3:

    rCBVmax and rCBVT, thresholds with respective sensitivities, specificities, and p values

    rCBVmaxrCBVT
    High grade if metric is≥1.75≥2.15SD ≥1.7SD25 ≥1.24SD50 ≥1.35
    Sensitivity (%)98.495.195.195.195.1
    Specificity (%)67.780.710096.896.8
    P value (vs rCBVmax ≥ 1.75)<.001<.001<.001
    P value (vs rCBVmax ≥ 2.15).002.004.004
    • Note:—rCBV indicates relative cerebral blood volume; SD50, SD of the top 50%; SD25, SD of the top 25%.

PreviousNext
Back to top

In this issue

American Journal of Neuroradiology: 28 (4)
American Journal of Neuroradiology
Vol. 28, Issue 4
April 2007
  • Table of Contents
  • Index by author
Advertisement
Print
Download PDF
Email Article

Thank you for your interest in spreading the word on American Journal of Neuroradiology.

NOTE: We only request your email address so that the person you are recommending the page to knows that you wanted them to see it, and that it is not junk mail. We do not capture any email address.

Enter multiple addresses on separate lines or separate them with commas.
Histogram Analysis versus Region of Interest Analysis of Dynamic Susceptibility Contrast Perfusion MR Imaging Data in the Grading of Cerebral Gliomas
(Your Name) has sent you a message from American Journal of Neuroradiology
(Your Name) thought you would like to see the American Journal of Neuroradiology web site.
CAPTCHA
This question is for testing whether or not you are a human visitor and to prevent automated spam submissions.
Cite this article
M. Law, R. Young, J. Babb, E. Pollack, G. Johnson
Histogram Analysis versus Region of Interest Analysis of Dynamic Susceptibility Contrast Perfusion MR Imaging Data in the Grading of Cerebral Gliomas
American Journal of Neuroradiology Apr 2007, 28 (4) 761-766;

Citation Manager Formats

  • BibTeX
  • Bookends
  • EasyBib
  • EndNote (tagged)
  • EndNote 8 (xml)
  • Medlars
  • Mendeley
  • Papers
  • RefWorks Tagged
  • Ref Manager
  • RIS
  • Zotero
0 Responses
Respond to this article
Share
Bookmark this article
Histogram Analysis versus Region of Interest Analysis of Dynamic Susceptibility Contrast Perfusion MR Imaging Data in the Grading of Cerebral Gliomas
M. Law, R. Young, J. Babb, E. Pollack, G. Johnson
American Journal of Neuroradiology Apr 2007, 28 (4) 761-766;
del.icio.us logo Twitter logo Facebook logo Mendeley logo
  • Tweet Widget
  • Facebook Like
  • Google Plus One

Jump to section

  • Article
    • Abstract
    • Materials and Methods
    • Results
    • Discussion
    • Conclusion
    • Footnotes
    • References
  • Figures & Data
  • Info & Metrics
  • Responses
  • References
  • PDF

Related Articles

  • No related articles found.
  • PubMed
  • Google Scholar

Cited By...

  • Discrimination between Glioma Grades II and III Using Dynamic Susceptibility Perfusion MRI: A Meta-Analysis
  • MRI Evaluation of Non-Necrotic T2-Hyperintense Foci in Pediatric Diffuse Intrinsic Pontine Glioma
  • Quantitative Evaluation for Differentiating Malignant and Benign Thyroid Nodules Using Histogram Analysis of Grayscale Sonograms
  • Contrast Leakage Patterns from Dynamic Susceptibility Contrast Perfusion MRI in the Grading of Primary Pediatric Brain Tumors
  • ASFNR Recommendations for Clinical Performance of MR Dynamic Susceptibility Contrast Perfusion Imaging of the Brain
  • Imaging Intratumor Heterogeneity: Role in Therapy Response, Resistance, and Clinical Outcome
  • Phase II Study of Bevacizumab, Temozolomide, and Hypofractionated Stereotactic Radiotherapy for Newly Diagnosed Glioblastoma
  • Differentiation of Tumor Progression from Pseudoprogression in Patients with Posttreatment Glioblastoma Using Multiparametric Histogram Analysis
  • A Prognostic Model Based on Preoperative MRI Predicts Overall Survival in Patients with Diffuse Gliomas
  • Potential Role of Preoperative Conventional MRI Including Diffusion Measurements in Assessing Epidermal Growth Factor Receptor Gene Amplification Status in Patients with Glioblastoma
  • Atypical Imaging Features of Epstein-Barr Virus-Positive Primary Central Nervous System Lymphomas in Patients without AIDS
  • Diffusion-Weighted MR Imaging and MGMT Methylation Status in Glioblastoma: A Reappraisal of the Role of Preoperative Quantitative ADC Measurements
  • Semi-automated and automated glioma grading using dynamic susceptibility-weighted contrast-enhanced perfusion MRI relative cerebral blood volume measurements
  • Imaging biomarkers of angiogenesis and the microvascular environment in cerebral tumours
  • Correlation of MR Relative Cerebral Blood Volume Measurements with Cellular Density and Proliferation in High-Grade Gliomas: An Image-Guided Biopsy Study
  • Differentiation among Glioblastoma Multiforme, Solitary Metastatic Tumor, and Lymphoma Using Whole-Tumor Histogram Analysis of the Normalized Cerebral Blood Volume in Enhancing and Perienhancing Lesions
  • An Automatic Procedure for Normalization of Cerebral Blood Volume Maps in Dynamic Susceptibility Contrast-Based Glioma Imaging
  • Crossref
  • Google Scholar

This article has not yet been cited by articles in journals that are participating in Crossref Cited-by Linking.

More in this TOC Section

  • Multimodal CT Provides Improved Performance for Lacunar Infarct Detection
  • Statin Therapy Does Not Affect the Radiographic and Clinical Profile of Patients with TIA and Minor Stroke
  • Optimal MRI Sequence for Identifying Occlusion Location in Acute Stroke: Which Value of Time-Resolved Contrast-Enhanced MRA?
Show more Brain

Similar Articles

Advertisement

Indexed Content

  • Current Issue
  • Accepted Manuscripts
  • Article Preview
  • Past Issues
  • Editorials
  • Editors Choice
  • Fellow Journal Club
  • Letters to the Editor

Cases

  • Case Collection
  • Archive - Case of the Week
  • Archive - Case of the Month
  • Archive - Classic Case

Special Collections

  • Special Collections

Resources

  • News and Updates
  • Turn around Times
  • Submit a Manuscript
  • Author Policies
  • Manuscript Submission Guidelines
  • Evidence-Based Medicine Level Guide
  • Publishing Checklists
  • Graphical Abstract Preparation
  • Imaging Protocol Submission
  • Submit a Case
  • Become a Reviewer/Academy of Reviewers
  • Get Peer Review Credit from Publons

Multimedia

  • AJNR Podcast
  • AJNR SCANtastic
  • Video Articles

About Us

  • About AJNR
  • Editorial Board
  • Not an AJNR Subscriber? Join Now
  • Alerts
  • Feedback
  • Advertise with us
  • Librarian Resources
  • Permissions
  • Terms and Conditions

American Society of Neuroradiology

  • Not an ASNR Member? Join Now

© 2025 by the American Society of Neuroradiology All rights, including for text and data mining, AI training, and similar technologies, are reserved.
Print ISSN: 0195-6108 Online ISSN: 1936-959X

Powered by HighWire