
Article Figures & Data
Figures
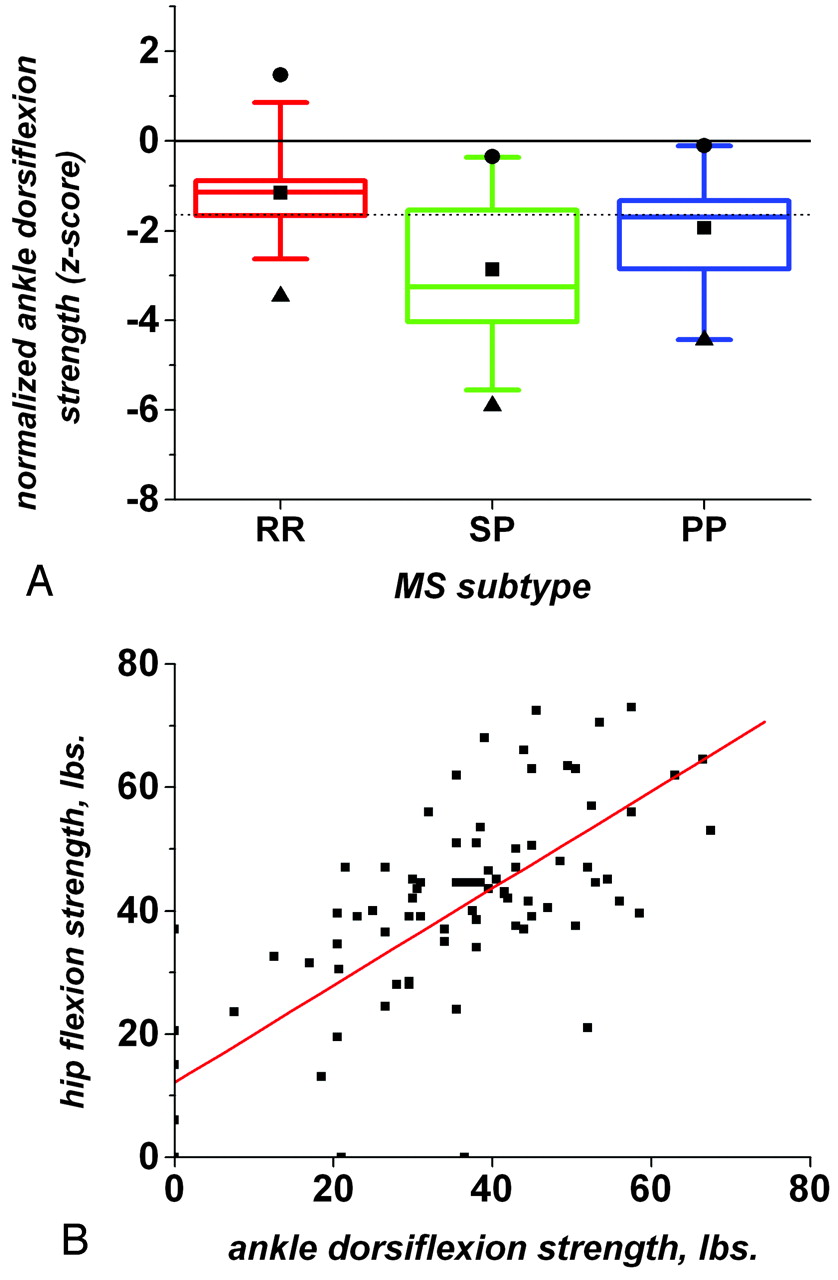
- Fig 1.
A, Box plots showing the distribution of normalized ankle dorsiflexion strength across our population of individuals with MS (92 ankles). Ankle strengths are reported as z-scores, corrected for age, handedness, and sex. Red indicates RRMS; green, SPMS; purple, PPMS. For each box-and-whisker plot, the central line represents the median, the box represents the interquartile range, and the whiskers represent the fifth and ninety-fifth percentiles. The dotted horizontal line denotes the fifth percentile of healthy controls. B, Correlation between ankle dorsiflexion and hip flexion strength in the same individuals (87 ankles and hips). The best-fitting linear regression line is shown in red.
- Fig 2.
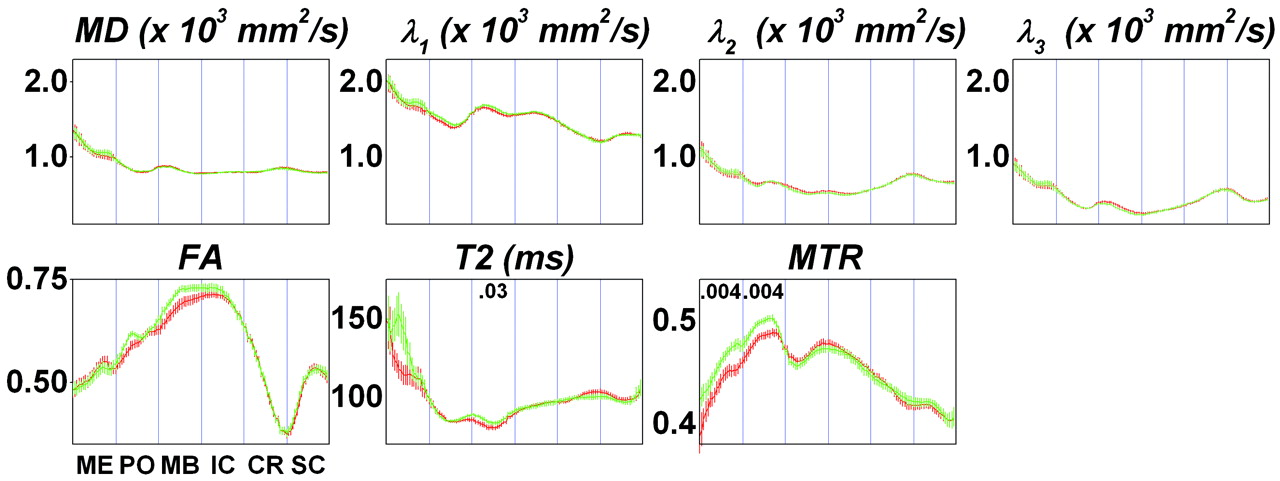
CST profiles depicting the average MR imaging index at each tract position for the stronger half (green) and weaker half (red) of our MS cohort. Strength assessment was based on ankle dorsiflexion power. The 6 segments of the CST are demarcated with vertical lines and abbreviated as follows: ME indicates medulla; PO, pons; MB, midbrain; IC, internal capsule; CR, corona radiata; SC, subcortical white matter. Error bars show 1 standard error of the mean in each tract subsegment. Each plot corresponds to a different MR imaging index, labeled as the following: MD; λ1, λ2, and λ3 (the major, medium, and minor diffusion tensor eigenvalues); FA; T2 relaxation time; and MTR. Where there was a significant difference between median MR imaging indices for stronger and weaker subjects, the P value is given within the corresponding segment at the top of the plot. Significance was determined by multiple linear regression analysis, accounting for age, sex, and number of reconstructed fibers in the CST.
- Fig 3.
Sample axial sections from MD maps (left) and CST profiles (right) from 3 individuals with MS at 2 different time points (red, earlier; green, later). The mean (black) and 90% confidence intervals (gray), derived from a collection of healthy controls, are also displayed. The CST segments are abbreviated as follows: ME indicates medulla; PO, pons; MB, midbrain; IC, internal capsule; CR, corona radiata; SC, subcortical white matter. A, Left tract: A 33-year-old man with RRMS. B, Right tract: A 40-year-old woman with RRMS. C, Left tract: A 49-year-old man with SPMS.


Tables
Characteristics of the multiple linear regression model for predicting limb strength from clinical and MR imaging data
Ankle Dorsiflexion (lb) Hip Flexion (lb) Medulla Included Medulla Excluded Medulla Included Medulla Excluded Number of ankles* 72 88 68 83 Model coefficients† Midbrain, median MTR −276 ± 86 (P = .002) −224 ± 78 (p = .005) −183 ± 68 (P = .01) −158 ± 71 (P = .03) Pons, median MTR 300 ± 99 (P = .003) 254 ± 83 (P = .003) 175 ± 88 (P = .03) 176 ± 75 (P = .004) Medulla, median MTR 153 ± 57 (P = .009) 134 ± 48 (P = .006) MS clinical subtype‡ −21.7 ± 3.9 (P < .001) −19.5 ± 3.7 (P < .001) −22.9 ± 3.2 (P < .001) −20.4 ± 3.3 (P < .001) Constant −42 ± 59 (P = .5) −26 ± 48 (P = .6) −21 ± 47 (P = .7) −27 ± 43 (P = .5) Partial correlation coefficients§ Midbrain, median MTR −0.37 (P = .002) −0.30 (P = .005) −0.32 (P = .01) −0.24 (P = .03) Pons, median MTR 0.35 (P = .003) 0.32 (P = .003) 0.27 (P = .03) 0.26 (P = .02) Medulla, median MTR 0.31 (P = .009) 0.34 (P = .006) MS clinical subtype −0.56 (P < .001) −0.50 (P < .001) −0.67 (P < .001) −0.57 (P < .001) Model performance Adjusted r2 0.36 (P < .0001) 0.30 (P < .0001) 0.45 (P < .0001) 0.33 (P < .0001) Predictions within 10% of actual strength 28% 21% 5% 30% Median difference of prediction from actual strength 13% 21% 50% 17% Model performance vs prior imaging and strength testing r2 0.34 (P < .0001) 0.17 (P = .0004) 0.38 (P < .0001) 0.28 (P < .0001) Predictions within 10% of actual strength 24% 15% 25% 22% Median difference of prediction from actual strength 21% 23% 32% 29% * Each subject contributes up to 2 ankles (right and left). The number of hips and ankles listed here is lower than the overall total because MTR was not obtained for all subjects. The model does not account for correlations between ankles in the same subject. Pearson correlation coefficients are used.
† Coefficient errors are ± 1 standard deviation.
‡ MS clinical subtype is modeled as 1 for secondary progressive MS, 0 otherwise.
§ Pearson correlation coefficients for model parameter, holding the others constant.
In this issue


Jump to section
Related Articles
Cited By...
- Identification of posterior visual pathway lesions and MRI burden in people with Multiple Sclerosis
- Diffusional Kurtosis Imaging of the Corticospinal Tract in Multiple Sclerosis: Association with Neurologic Disability
- Longitudinal changes in diffusion tensor-based quantitative MRI in multiple sclerosis
- T2 lesion location really matters: a 10 year follow-up study in primary progressive multiple sclerosis