
Abstract
BACKGROUND AND PURPOSE: Posterior reversible encephalopathy syndrome (PRES) is known to occur after solid organ transplantation (SOT), potentially associated with cyclosporine and tacrolimus. In this study, we assess the frequency and clinical and imaging characteristics of PRES after SOT.
MATERIALS AND METHODS: We identified 27 patients (13 men and 14 women; age range, 22–72 years) who developed PRES after SOT. Features noted included SOT subtype, incidence and timing of PRES, infection and rejection, mean arterial pressure (MAP), and toxicity brain edema.
RESULTS: PRES developed in 21 (0.49%) of 4222 patients who underwent transplantation within the study period (no significant difference among SOT subtypes). Transplantation was performed in 5 patients before the study period, and 1 patient underwent transplantation elsewhere. In consideration of all 27 patients, PRES typically developed in the first 2 months in patients who had SOT of the liver (9 of 10 patients) and was associated with cytomegalovirus (CMV), mild rejection, or systemic bacterial infection. PRES also typically developed after 1 year in patients who had SOT of the kidney (8 of 9 patients) and was associated with moderate rejection or bacterial infection. Toxicity MAP was significantly lower (P < .001) in liver transplants (average MAP, 104.8 ± 16 mm Hg) compared with that in kidney transplants (average MAP, 143 ± 20 mm Hg). Toxicity brain edema was significantly greater (P < .001) in patients who had liver transplants and developed PRES compared with patients who had undergone kidney transplants despite severe hypertension in those who had the kidney transplants.
CONCLUSION: Patients who had undergone SOTs have a similar low incidence of developing PRES. Differences between those who have had liver and kidney transplants included time after transplant, toxicity MAP, and PRES vasogenic edema noted at presentation. In patients who have undergone kidney transplants, severely elevated MAP was associated with reduced, not greater, brain edema.
Neurotoxicity with the development of the posterior reversible encephalopathy syndrome (PRES) imaging pattern is most typically noted in solid organ transplantation (SOT), allogeneic bone marrow transplantation (allo-BMT), and eclampsia.1–17 PRES is also seen in association with infection, sepsis, shock, autoimmune disease, and after chemotherapy.18–27 Patients develop headache, visual disturbance, or altered mentation, which often progress to seizure.28 Severe hypertension is commonly present, but patients may be normotensive (20% to 30%).3,29,30
On CT or MR imaging, vasogenic edema is typically present in the occipital and parietal regions but also in the frontal lobes (in particular, along the superior frontal sulcus), inferior temporo-occipital junction, and cerebellar hemispheres.1,3,18,19,31 Involvement of the deep white matter (WM), basal ganglia, and brain stem is also seen, with areas of restricted diffusion and focal hemorrhage occasionally noted.4,6,31
Although many case reports have described PRES or cyclosporine and tacrolimus neurotoxicity in SOT, to our knowledge, a comprehensive assessment has not been performed. The purpose of this retrospective study was to evaluate the incidence of PRES after SOT along with the clinical and imaging features of PRES neurotoxicity in a large population of patients who have undergone SOT.
Methods
We searched the radiology report data base at our institution from January 1, 1998, through August 31, 2006, for any patients in whom PRES was demonstrated on brain CT and MR imaging reports associated with SOTs. In addition, the adult SOT data base cited 4222 SOTs performed during the same study period, and we assessed records of any patients who developed neurologic dysfunction and had either brain CT or MR imaging studies for evaluation. We obtained approval from our institutional review board for this retrospective study.
Brain CT and MR imaging studies were reviewed in the identified patients for features consistent with the characteristics of cyclosporine and tacrolimus neurotoxicity or PRES, and cases were included by consensus agreement between 2 experienced neuroradiologists. Criteria for confirmation of PRES included complete or partial expression of the typical PRES pattern, reversibility on follow-up imaging, vasogenic edema as demonstrated by MR diffusion imaging, and a presentation consistent with clinical neurotoxicity. Twenty-seven patients were identified who developed PRES after SOT, and these patients are the focus of this report.
The clinical inpatient and outpatient records of these 27 patients were comprehensively reviewed. We paid specific attention to identify clinical features including cyclosporine and tacrolimus levels, bacterial infection, evolving viral infection or reactivation (ie, cytomegalovirus [CMV]) and organ rejection. We sought baseline/toxicity blood pressures and calculated mean arterial pressure (MAP; 2/3 diastolic pressure +1/3 systolic pressure) at toxicity.
Imaging Evaluation
CT studies were obtained with 5-mm section thickness through the posterior fossa along with 5 to 10-mm section thickness through the supratentorial hemispheres. When used, contrast material consisted of 150 mL of intravenous iothalamate meglumine (Conray 60; Mallinckrodt, St. Louis, Mo) or iohexol 300 (GE Healthcare, Milwaukee, Wis).
MR imaging, where obtained, was performed at 1.5T and included sagittal and axial T1-weighted images (TR, 600 msec; TE, min; section thickness, 5 mm; number of acquisitions, 1) and spin-echo or fast spin-echo axial proton density (TR, 2000-2500 msec; TE, min; section thickness, 5 mm; number of acquisitions, 1) and T2-weighted images (TR, 2000-2500 msec; TE, 84-102 msec; section thickness, 5 mm; number of acquisitions, 1). Contrast enhanced T1-weighted images were obtained with 0.1 mmol/kg gadolinium dimeglumine (Magnavist; Berlex Laboratories, Wayne, NJ) or gadopentatate (Prohance; Braco Diagnostics, Princeton, NJ) using typical T1-weighted parameters as described above. Fluid attenuation inversion-recovery (FLAIR) images (TR, 9000-10000 msec; TE, 149 msec; TI, 2200 msec) and diffusion weighted imaging (single shot echoplanar; TR, 10000 msec; TE, min; section thickness, 5 mm; matrix, 128) sequences were also available in most patients.
Imaging Assessment and Edema Grading
The imaging features seen in cyclosporine and tacrolimus neurotoxicity, eclampsia, and PRES have been described previously.2–7,16,18,19,31 CT and MR imaging studies were assessed by 2 experienced neuroradiologists with locations of imaging abnormality (vasogenic edema, restricted diffusion, enhancement) itemized and tabulated by consensus agreement. Specific regions of vasogenic edema were tabulated separately including the frontal, parietal, occipital, and temporal lobes; cerebellum; brain stem; basal ganglia; and deep WM (ie, external and internal capsule, corona radiata).
Imaging studies were independently graded by 2 neuroradiologists for extent and severity of hemispheric cortex and WM edema (grade summary: 1, limited cortex/WM edema; 2, WM>cortex edema with some deep WM extension; 3, WM>cortex edema with limited ventricle surface extension; 4, WM≫cortex edema, diffuse, widely confluent, extensive ventricle contact; 5, severe WM≫cortex edema, diffuse confluence, ventricle deformity) as previously described.18
The depth of vasogenic edema and cortical scope in PRES are generally observed to track in parallel, particularly as separate regions become confluent. Vasogenic edema grade was based on the most severely involved region of the visualized hemispheric PRES pattern. This was most typically the parietal or occipital lobes, or both (“posterior” brain). Grade judgment was therefore primarily based on the depth of edema in the maximum involved region and secondarily on medial and lateral scope, confluence, or anterior extension. A single-grade value was generated by each observer based on impression of maximum edema extent. In asymmetric or aberrant PRES, the most extensively involved region was used for grading. Graders were blinded to the patient's blood pressure and transplant subtype, and differences in edema grade were resolved by consensus.
Transplantation Management
Graft rejection control was managed with tacrolimus and cyclosporine (historical maintenance morning trough blood levels of ≤20 and ≤400 ng/mL, respectively; currently ≤10 and ≤200 ng/mL). Patients who had undergone liver transplantation typically received approximately 30% lower dosing because of their intrinsic disease-related immune-suppressed status. All recipients received prophylactic antibacterial, antifungal, and antiviral treatment for at least 6 months, and all infections were treated aggressively.
Statistical Assessment
Statistical significance was evaluated with the software package SAS release 8.2 (SAS Institute, Cary, NC). Parametric comparisons of blood pressure and brain edema grade, respectively, between liver and kidney transplant subsets was performed with the Student t test and Mann-Whitney test for nonparametric comparisons. Comparison of PRES incidence between SOT subtypes was performed with the Fisher-Freeman-Halton test. The Pearson correlation coefficient was calculated between toxicity blood pressures and edema grades. Statistical significance was considered to exist for P < .05.
Results
Twenty-seven patients who developed PRES after SOT were identified. The results are summarized in Tables 1, 2 and in the on-line Table. Thirteen of 27 patients were men and 14 womene with an average age of 48 years (range, 22–72 years). Twenty-one patients underwent transplantation during the study period (January 1, 1998 to August 31, 2006) with 5 patients having a transplant before January 1, 1998. One additional patient developed PRES after having a second liver transplant at another institution. A total of 4222 SOTs were performed at our institution during the study period.
Incidence of PRES developing after transplantation between January 1, 1998 and August 31, 2006, in 21 patients (by transplanted organ)
Clinical presentation at toxicity included isolated seizure (7 patients) or a combination of headache, confusion, altered mentation, or vision change alone (8 patients) or with progression to generalized seizure (12 patients). Blood pressure at toxicity was normal in 8 patients (MAP ≤ 105 mm Hg), mildly elevated in 6 (MAP, 106–115 mm Hg), and severely elevated in 13 (MAP ≥ 116 mm Hg).
MR imaging was available in 25 of 27 patients, with CT imaging only in 2. Lesion distribution included the parietal lobe in 27 of 27, occipital lobe in 22 of 27, frontal lobe in 22 of 27, temporal lobe in 7 of 27, cerebellum in 11 of 27, basal ganglia in 5 of 27 [thalamus in 5; caudate nucleus in 1], deep WM in 6, corpus callosum in 1, and brain stem in 2.
Overall Neurotoxicity with PRES After SOT (Table 1)
Neurotoxicity with PRES was identified in 21 (0.49%) of the 4222 patients after SOT performed during the study period (January 1, 1998 to August 31, 2006). Individual organ-specific incidence of PRES is summarized in Table 1. Minor variation in PRES incidence was noted between SOT subtypes (range, 0.34% [Kidney/Kidney-Pancreas] to 0.84% [Small Bowel]), but differences were not statistically significant.
Differences Among SOT Organ Groups (Table 2 and On-line Table)
Organ-specific differences
Although the incidence of PRES was similar among SOT subtypes, several particularly striking differences were present between liver and kidney transplants, with other SOT subtypes being intermediate.
Time of PRES Occurrence
Time of PRES occurrence was markedly different between liver and kidney transplants (Table 2 and on-line Table). After liver transplantation, neurotoxicity and PRES occurred immediately after transplantation in 9 patients (11–68 days; average, 31 days) with 1 patient developing PRES at 173 days in the face of significant and ongoing sepsis. In contrast, 8 patients with kidney transplants developed PRES many years after transplantation (14–120 months; average, 53 months) with only 1 patient developing PRES earlier (236 days) after kidney-pancreas transplant in the face of severe sepsis and rejection. Onset of neurotoxicity and PRES after transplant in other SOTs was intermediate and variable.
Blood Pressure
Average blood pressure at neurotoxicity was lower in patients with liver transplantation (average MAP, 104.8 ± 16 mm Hg [range, 86–132 mm Hg]) but markedly elevated in patients who had undergone kidney transplantation (average MAP, 143 ± 20 mm Hg [range, 117–177 mm Hg]), and this difference was statistically significant (t test; P < .001; Mann-Whitney test; P = .002; if we exclude the 2 renal transplants with CT scans only: t test; P = .002; Mann Whitney test; P = .005).
Vasogenic Edema Grade
Extent of brain edema graded at presentation was also markedly different between patients who had undergone liver transplantation and those who had had a kidney transplant. Brain edema was greater in patients who had undergone liver transplantation (average edema grade, 3 ± .8; Fig 1) and lower in those who had undergone kidney transplantation (average edema grade, 1.55 ± .5; Fig 2) and developed PRES, and this difference was statistically significant (t test; P = .001; Mann-Whitney test; P = .002; if we exclude the 2 renal transplants with CT scans only: t test; P = .001; Mann-Whitney test; P = .002).

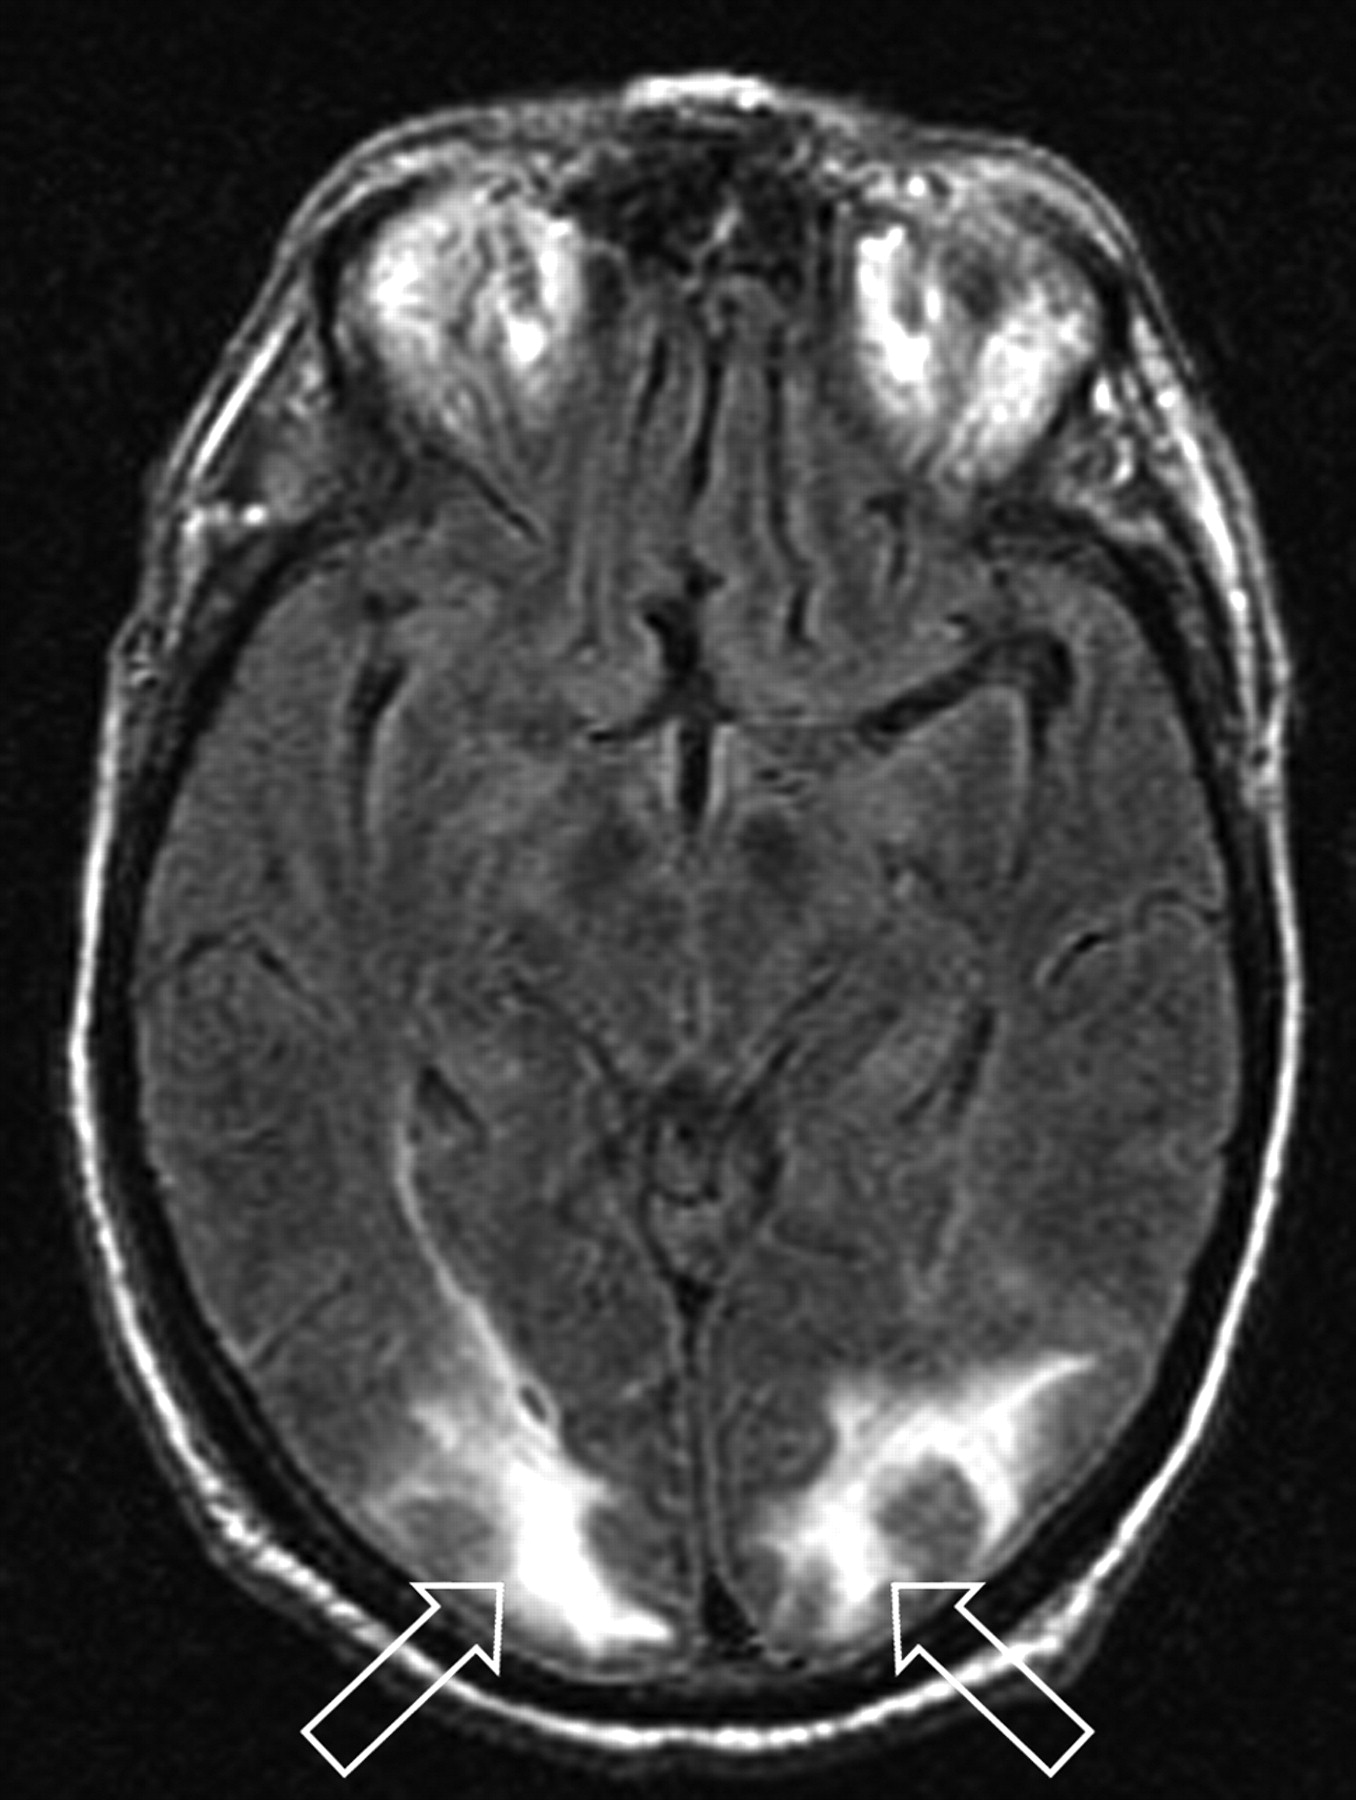
Patient 1 is a 73-year-old man who developed altered mental status 11 days after orthotopic liver transplant for cholangitis and cirrhosis with blood pressure at toxicity of 140/76 mm Hg. Mild organ rejection was being treated with increased immune suppression (trough tacrolimus level minimally elevated: 21 ng/mL), and intercurrent blood culture results were positive for coagulase-negative Staphylococcus. MR imaging (FLAIR sequence) obtained at toxicity demonstrates cortex and deep WM vasogenic edema in the occipital region bilaterally (open arrows) judged Edema grade 3. Follow-up MR imaging 1 month later demonstrated complete resolution of the vasogenic edema.

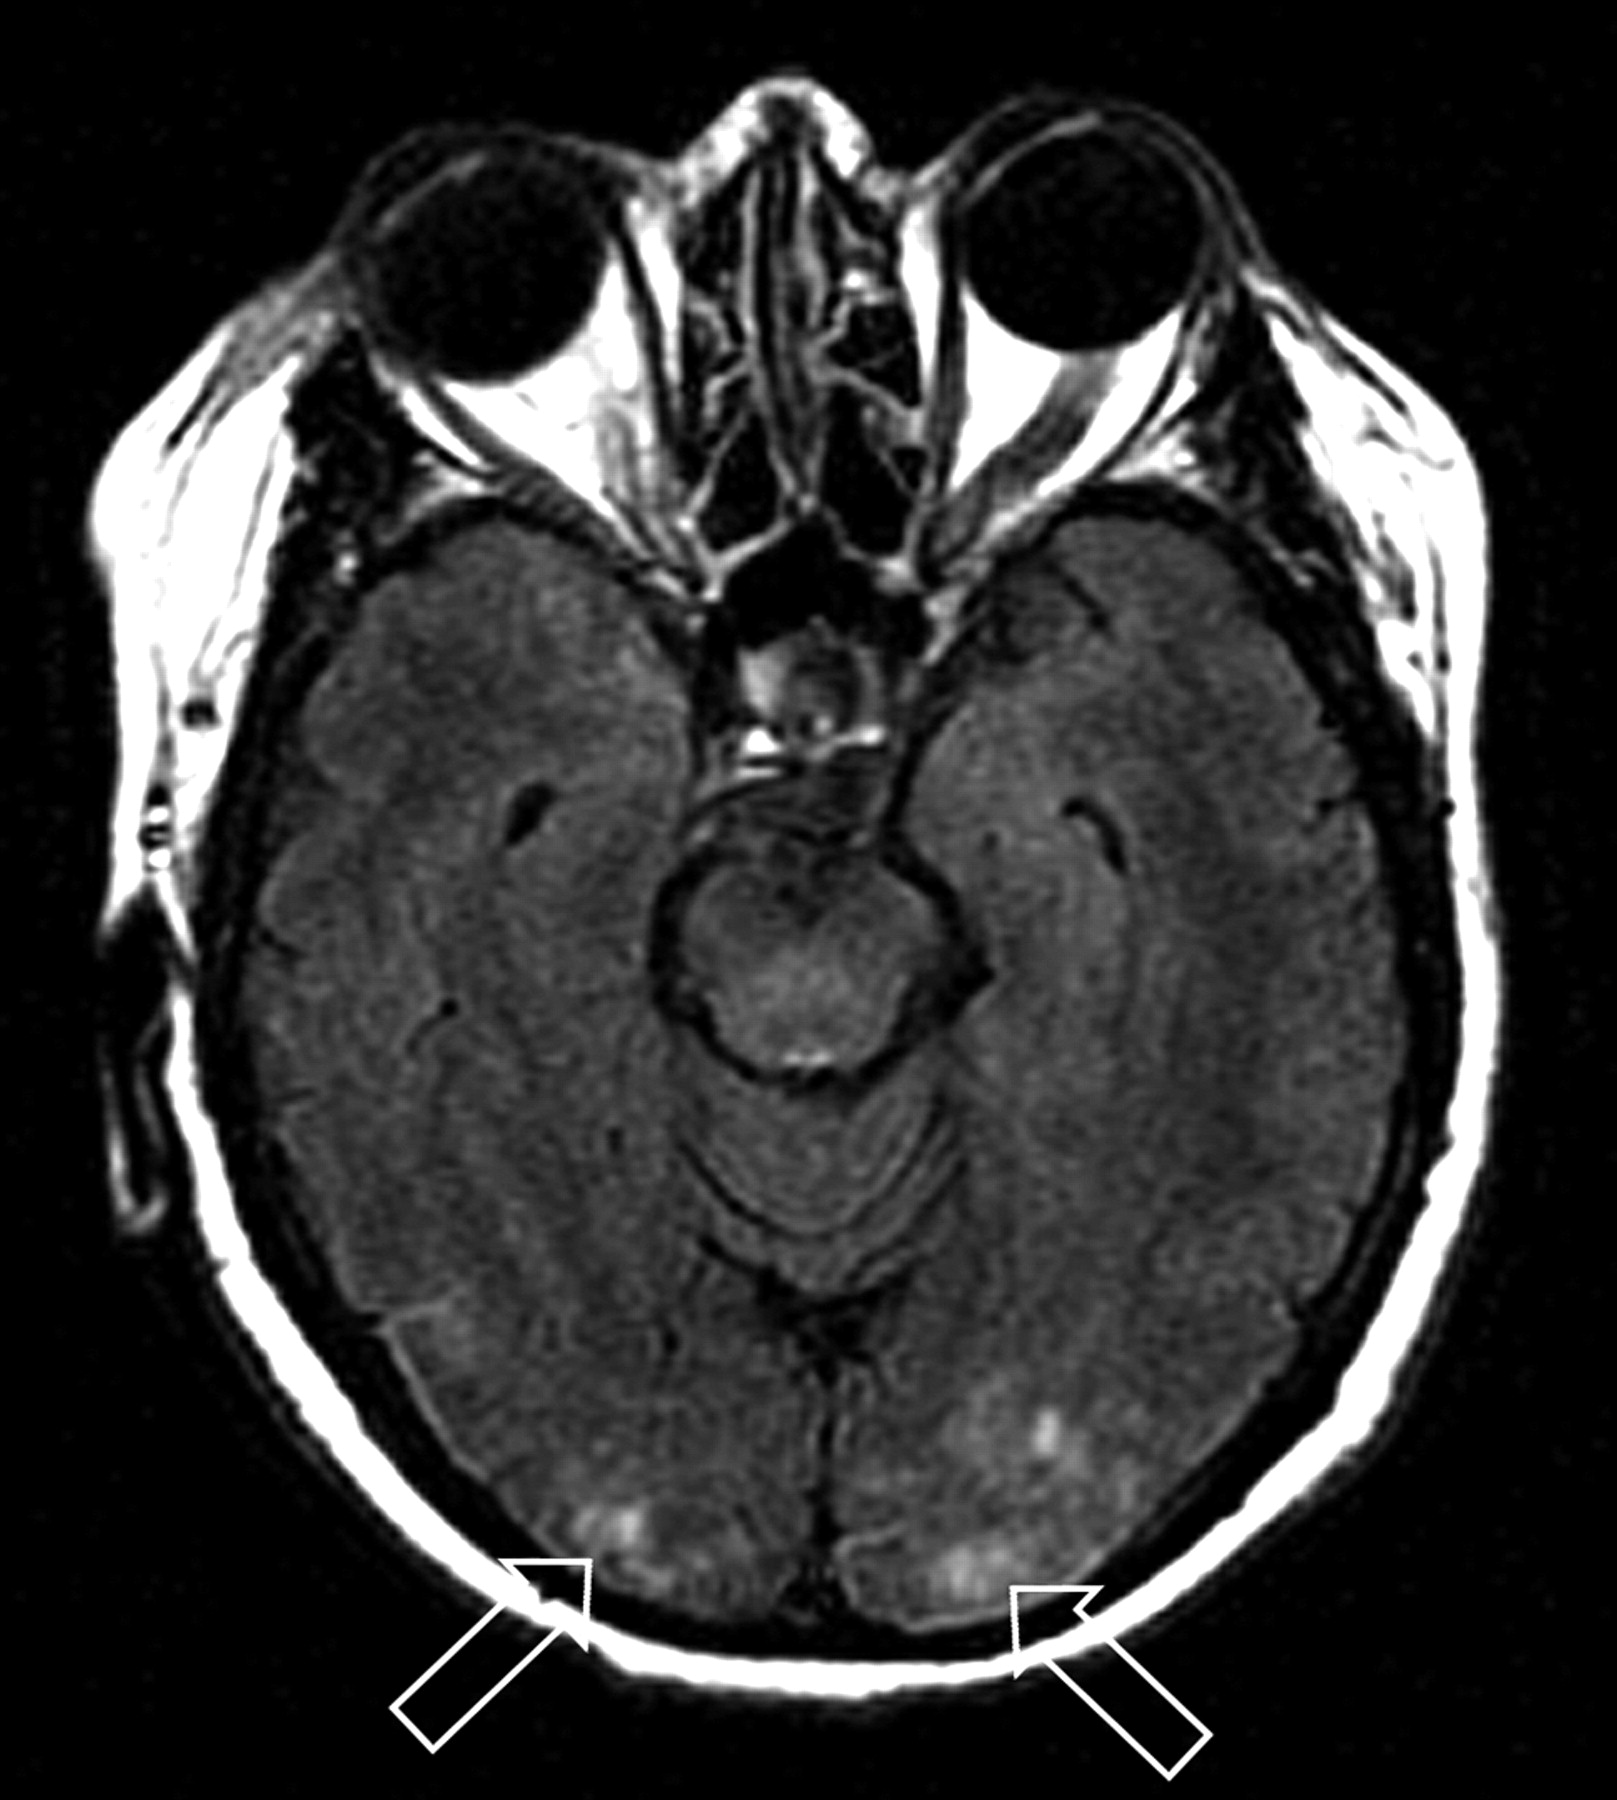
Patient 21 is a 59-year-old woman who developed altered mental status, loss of consciousness, and severe hypertension (220/100 mm Hg) 17 months after cadaveric renal transplant for hypertension-related chronic renal failure. She was being managed for mild organ rejection just before toxicity. MR imaging (FLAIR sequence) obtained at toxicity demonstrates primarily cortical vasogenic edema in the occipital poles bilaterally (open arrows) judged Edema grade 1. Follow-up MR imaging 3 days later demonstrated resolution of the vasogenic edema.
Of particular interest, average edema grade in patients who had kidney transplantation with PRES was significantly lower despite the markedly elevated blood pressures encountered at toxicity. The correlation (coefficient, P value) between toxicity blood pressure and brain edema grade included 1) entire study group (−.35, P = .07), 2) liver only (−.18, P = .63), and 3) kidney only (−.06, P = .87).
Clinical Features at Toxicity
Patients who had undergone liver transplantation typically developed PRES in the immediate or early period after transplantation with significant bacterial infection (7 patients, blood culture results positive: 6 gram-positive Staphylococcus, Enterococcus, 1 gram-negative Pseudomonas) and biopsy-positive organ rejection (4 patients) noted (on-line Table). New-onset CMV expression during or after neurotoxicity and PRES was noted in 7 of 10 patients with liver transplants, representing reactivation (6 patients) or new-onset infection (1 patient).
In patients who had undergone kidney/kidney-pancreas transplantation (8 cadaveric,1 living donor), PRES was typically seen in association with sporadic late but severe infection (6 patients: kidney abscess/hemorrhage, lung abscess/empyema, pneumonia, sepsis [Streptococcus. Enterococcus, Staphylococcus, Moraxella], and CMV colitis) and biopsy-positive organ rejection (6 patients) noted (on-line Table). PRES was also seen in association with dialysis fistula inflammation and infection (1 patient) and narcotic or cocaine use (1 patient). One patient developed PRES 8 months after transplantation in association with severe rejection and sepsis.
In a similar fashion, patients with other organ transplants typically developed PRES in the setting of infection or organ rejection (on-line Table).
At presentation, immunosuppression was within the normal range in 23 patients (tacrolimus) and minimally elevated in 4 (3 liver transplants, tacrolimus; 1 heart transplant, cyclosporine).
Discussion
Neurotoxicity with development of PRES occurs in association with transplantation (SOT and allo-BMT; cyclosporine or tacrolimus toxicity), eclampsia, high-dose chemotherapy, and autoimmune disease.3–6,9–17,19,22–27,32 Severe infection, sepsis, and shock may also represent important associations.18 Although blood levels of cyclosporine and tacrolimus tend not to correlate with PRES, medication withdrawal often results in alleviation of toxicity.33,34
The cause of neurotoxicity with PRES remains controversial. From a historical persective, hypertension with failed autoregulation and hyperperfusion has been suggested as the cause of the developing vasogenic edema. Alternatively, vasospasm has been demonstrated (catheter or MR angiography: delayed eclampsia, allo-BMT, chemotherapy, infection, sepsis, and shock), brain hypoperfusion has been demonstrated (Tc99m hexamethylpropyleneamine oxime single-photon emission CT; MR perfusion), and the imaging appearance likely reflects a watershed distribution of vasogenic edema.2,14,35–41 In addition, hypertension is not present in approximately 20% to 30% of patients who develop PRES with eclampsia.3,29,30
Our data demonstrate several important features related to PRES in SOT including 1) a low incidence of PRES in SOT in particular when compared with allo-BMT; 2) a similar incidence of PRES among the different SOT subtypes; 3) marked difference in several features of PRES between liver and kidney transplants including time point of onset, extent of brain edema, and blood pressure at presentation; 4) high frequency of bacterial infection, CMV expression, and organ rejection in the peripresentation period. These features may further expand our understanding of the causes of PRES.
Incidence of PRES in SOT
In our patients who had undergone SOT, the incidence of PRES was 0.49% and appears similar among SOT subtypes. This parallels several previous reports of neurotoxicity after liver and kidney transplantation (PRES incidence, 0.4% to 0.5%).8,42,43 In our renal transplant population, PRES was primarily encountered 1 year or more after surgery, which suggests a delayed, time-dependent incidence (overall, 0.35%; rate, 0.044% per year). Older reports or studies covering a previous era of transplantation have suggested a higher incidence of PRES after SOT (2.7% to 4%) and an earlier occurrence of PRES after renal transplant.8,17,44–46 Our study covers a more recent period, and current refined posttransplant management (minimized maintenance immunosuppression, bacterial and viral infection control, immunosuppression blood levels and early toxicity recognition) may account for these differences.
The incidence of PRES after SOT was significantly lower than the reported incidence of cyclosporine neurotoxicity after allo-BMT (5% to 8%), with several important factors potentially accounting for the differences.32,47,48 In allo-BMT, conditioning regimens (marrow ablative chemotherapy, total body irradiation) are used to eliminate host marrow, which may induce endothelial or tissue injury with production of inflammatory cytokines.32,49,50 Graft versus host disease (GVHD) is likely a more systemic and aggressive immune-reactive process than organ rejection, and the dose of immunosuppression (cyclosporine and tacrolimus) is typically greater in patients undergoing allo-BMT (GVHD control) than in those undergoing SOT.51,52 In addition, the combined result of marrow ablation and higher-dose immunosuppression renders the patient with allo-BMT significantly more susceptible to infection posttransplantation to the point of requiring isolation.53
Transplant Differences: Kidney Versus Liver Transplants
Although the incidence of PRES among SOT subtypes was similar, striking clinical differences were present (ie, time of onset, blood pressure at presentation, brain vasogenic edema) in particular between patients who had undergone liver transplantation and those who had undergone kidney transplantation. Several factors related to the clinical and surgical challenges of transplantation may be responsible for these differences.
Clinical Differences
Patients who have undergone kidney transplantation are generally healthier than those undergoing liver transplantation (organ failure addressed with dialysis until appropriately matched donor identified), and the transplant procedure is technically easier (extraperitoneal iliac fossa approach; discharged within 3–7 days).54,55 Problems after transplantation typically develop late after the actual kidney transplant procedure, and these problems are primarily related to episodes of infection or rejection.56 Progressive organ rejection involves CD4 T-cell activation to transplant endothelium (including tumor necrosis factors-α and β, interferon-γ, and interleukin-1 cytokine expression) along with progressive cytotoxic CD8 T-cell activation with direct endothelial or tissue injury.57 The inflammatory response to the graft leads to leukocyte trafficking (T-cells, macrophages, other leukocytes) and endothelial adhesion molecule activation promoting leukocyte interaction and organ hypoperfusion. B-cell activation or antibody production can also occur. This chronic allograft nephropathy inflammatory process results in the organ and stromal injury that constitute the effects of rejection observed on histologic examination.57
Long-standing host exposure to transplant endothelium might “preactivate” T-cell populations (including memory T-cells) and host endothelium that may subsequently react more vigorously in the face of an added immunologic challenge (through antigen presenting cell costimulation) such as bacterial/viral infection or increasing transplant rejection.57–60
Liver transplantation is performed on the basis of clinical need (sickest patients first).61 Patients are intrinsically immunocompromised with low albumin, hepatic failure, and an underlying coagulopathy (intrinsic platelet dysfunction, platelet consumption [splenomegaly], and inadequate coagulation factors).61–63 The surgical procedure is technically complex with a mandatory “no-turning-back” point (major vessels clamped, bypass established, recipient liver removed), significant blood and fluid shifts, and intrinsic coagulopathy.64
The immediate period after liver transplantation (0–3 months) is challenging, with a high risk for infection (bacterial, viral, or fungal) and cardiovascular instability (hypotension: exaggerated venous capacitance [varices], low albumin, operative blood and fluid loss) and intrinsic immunosuppression.65 Multiorgan dysfunction syndrome is common.65 Of interest, the native liver, through hepatic vagal afferents and the hypothalamic-pituitary-adrenal axis, functions to detect low levels of circulating bacteria (endotoxin).60,66,67 Resultant production of cortisol and vagal efferent signal intensity diminish production of macrophage tumor necrosis factor (limiting the systemic inflammatory response to infection) and attenuate endotoxin-induced hypotension.60,66,67 In the denervated orthotopic liver transplant, hepatic vagal afferents are not present.
The transplanted liver also contains a significant number of mobile immunologically active cells (T-cells, macrophages, and stem cells) that exit the donor liver in the first 45 days after transplantation, interacting with the recipient, similar to an allo-BMT, or establishing permanent residence within the host (potential “microchimerism”).68 Early development of PRES after liver transplantation (first 2 months) parallels the early development phase of PRES in the first month after allo-BMT and could reflect similar mechanisms (GVHD, infection).32
The development of neurotoxicity with PRES early after liver transplant may be related to features of this complex and unstable posttransplantation state. Expression of CMV (reactivation) likely reflects the immune-challenged condition or effects of intercurrent sepsis. Once stable, patients with liver transplants tend to remain so for long periods after transplantation, likely related to better overall immune adaptation.68
Brain Edema and Hypertension
In our study population, liver transplant recipients developed substantial brain edema at presentation (average grade, 3 ± .8) with, on average, normal blood pressures (average MAP, 104.6 ± 16 mm Hg). In stark contrast, patients who had undergone kidney transplantation had significantly less brain edema at presentation (average grade, 1.55 ± .5), despite acute-onset severe hypertension (average MAP, 143 ± 20 mm Hg), and the differences between these 2 groups of patients are statistically significant (P < .005). CT and MR imaging studies were used to compute the vasogenic edema grade for renal transplants because of the limited number of patients available, but results remain significant even when retabulated without the CT studies included. The correlation between toxicity edema and blood pressure, though not statistically significant, was negative for the entire SOT dataset (−.35), liver transplants (−.18), and kidney transplants (−.06). If acute, severe hypertension were the cause of PRES, one would expect the opposite observation (ie, greater vasogenic edema in patients with renal transplants in whom severe hypertension develops—positive correlation). Reduced edema has been reported in patients with severe hypertension and infection, sepsis, or shock who develop neurotoxicity or PRES.18 Our observations between patients with liver transplants and those with kidney transplants parallel this finding, but the relationship seems to be even more dramatic.
The observed differences in PRES neurotoxicity noted between our patients with liver transplants and those with kidney transplants (brain edema, toxicity blood pressure, and timing of toxicity occurrence) are most likely related to the substantial perioperative or posttransplant clinical differences, or both, between these 2 groups. Progressive rejection in patients undergoing kidney transplantation is related to an ongoing immune response to the organ (CD4/CD8 T-cell activation, tissue inflammation or injury, cytokines, B-cell activation) balanced by immunosuppression.57 Significant challenge to the immune system could lead to an augmented response in the face of T-cell preactivation, in particular, if challenged by a superantigen (ie, infection with gram-positive organisms), which can stimulate 5% to 20% of T-cells.59,60 The resulting systemic inflammatory response (endothelial adhesion or white cell trafficking) could lead to organ hypoperfusion with vasospasm or hypertension as an intrinsic reactive response (platelets: thromboxane; cytokines: endothelin) or a reactive response designed to improve perfusion.57,60 The developing hypertension could therefore be protective (Cushing-like) and responsible for the reduced brain edema, as observed.
Why hypertension does not routinely accompany PRES or neurotoxicity after liver transplantation is unclear, but this is an important question. The clinical features surrounding or following liver transplantation (hepatic failure, immune suppression, cardiovascular challenge, immune challenge from the transplanted organ, opportunistic infection, low oncotic pressure) may lead to a postoperative state similar to that of multiorgan dysfunction syndrome or sepsis with resultant intravascular inflammatory changes, organ hypoperfusion, and sustained hypotension with a compromised vasoconstrictive response. Platelet dysfunction or consumption could reduce thromboxane-mediated vasoconstriction. Altered hepatic vagal afferent response to infection could diminish the hypothalamic-pituitary-adrenal–mediated pressor response, sustaining lower systemic perfusion and facilitating the process that leads to PRES or neurotoxicity.60,66,67
Given the above-described inverse relationship of toxicity vasogenic edema and blood pressure between liver and kidney SOTs, implications for patient care might include earlier identification of PRES in patients with normotensive blood pressure and confirmation of toxicity brain perfusion to guide management.
Conclusion
The overall incidence of PRES after SOT is low, with a similar incidence among SOT subtypes. Statistically significant differences between SOT groups at presentation included the following: 1) PRES developed early in patients who had undergone liver transplantation, and these patients had generally normotensive blood pressure and greater brain vasogenic edema; and 2) PRES developed late in patients who had undergone kidney transplantation, and these patients had severe hypertension at presentation but had much less brain vasogenic edema. These differences in PRES, with an inverse relationship between toxicity blood pressure and observed vasogenic edema, are likely related to the many clinical differences between liver and kidney transplantation.
Acknowledgments
The authors thank Marcia Kurs-Lasky, MS, for her extensive support with statistical analysis and Eric Jablonowski, for his assistance with image preparation.
Footnotes
Indicates article with supplemental on-line table.
References
- Received August 24, 2007.
- Accepted after revision November 5, 2007.
- Copyright © American Society of Neuroradiology
In this issue


Jump to section
Related Articles
Cited By...
- Pediatric Lung Transplantation
- Posterior Reversible Encephalopathy Syndrome as an Overlooked Complication of Induced Hypertension for Cerebral Vasospasm: Systematic Review and Illustrative Case
- Posterior reversible encephalopathy syndrome: the importance of early diagnosis
- The posterior reversible encephalopathy syndrome in HIV infection
- Hemorrhage in Posterior Reversible Encephalopathy Syndrome: Imaging and Clinical Features