
Abstract
BACKGROUND AND PURPOSE: Brain proton MR spectroscopy (1H-MR spectroscopy) is a useful technique for evaluating neuronal/axonal damage and demyelization in multiple sclerosis (MS). Because MS disability is frequently related to spinal cord lesions, potential markers for MS stage differentiation and severity would require in vivo quantification of spinal integrity. However, few spectroscopy studies have investigated cervical disease due to technical difficulties. The present study used 3T 1H-MR spectroscopy to measure the main metabolites in cervical spinal cord plaques of a group in patients with relapsing-remitting MS (RRMS) and compared them with metabolite measurements in healthy volunteers.
MATERIALS AND METHODS: A 1H-MR point-resolved spectroscopy sequence volume of interest was prescribed along the main axis of the cord between C2 and C3 levels on a plaque in a group of 15 patients with RRMS for a total acquisition time of approximately 14 minutes. MR spectroscopy data were analyzed by the user-independent fitting routine LCModel, and relative metabolite concentrations were expressed by the absolute concentration ratios. A Student t test was used to evaluate the difference compared with the healthy metabolite content previously published.
RESULTS: We found a significant decrease of total N-acetylaspartate/choline and an increase in choline/creatine and myo-inositol/creatine content on MS plaques in comparison with healthy cervical spine tissue.
CONCLUSIONS: In vivo 1H-MR spectroscopy, if confirmed by other similar studies, should be as reliable for clinical studies as it is in brain imaging. Moreover, 1H-MR spectroscopy allows examination of spinal cord integrity at a biochemical level and may be sensitive to subtle changes occurring during the course of MS disease.
Multiple sclerosis (MS) is a central nervous system (CNS) disease with a complex relapsing and remitting course, including inflammation, demyelination, remyelination, axonal loss, and gliosis, alternating or present at the same time. These abnormal conditions have been demonstrated both in lesions and in normal-appearing white matter (NAWM) and normal-appearing gray matter (NAGM).1–10
T1- and T2-weighted MR imaging is currently the diagnostic reference to define and monitor MS, but it has poor specificity and sensitivity in detecting pathophysiologic MS changes correlated with clinical disability.6,11–15
For some years, brain proton MR spectroscopy (1H-MR spectroscopy) has been used to study MS by offering a unique opportunity to evaluate biochemical changes that could shed light on the complex pathophysiology of the disease and potentially define new markers correlated with the clinical evolution of MS.1,16
Many cerebral quantitative MR spectroscopy studies in patients with MS have evaluated the correlation of the specific single metabolites with specific physiologic events during the MS disease course.11,17 The N-acetylaspartate (NAA) peak is thought to be a neuronal marker indicative of axonal integrity, and it has been found reduced in acute and chronic lesions and in NAWM and NAGM.1,16 In some cases, the NAA deficit correlated with MS-related clinical disability better than the traditional MR imaging radiologic markers.18,19 A peak increase in choline-containing compounds (Cho), representing increased Cho mobility, in patients with MS is considered to reflect inflammation, demyelination, and remyelination.11 Last, a myo-inositol (mIns) peak increase in patients with MS has been interpreted as a possible indicator of gliosis or glial cell proliferation.11 Some studies have advocated mIns as a potential marker of the clinical MS evolution of patients with an initial clinically isolated syndrome.20
Although disability in MS is frequently related to spinal cord lesions, few spectroscopy studies have addressed cervical diseases21–26 because of technical difficulties limiting the quality of the spectroscopy data, due to strong magnetic field inhomogeneities present in the spinal cord region, respiratory and cardiac movements, and the small size of the spinal cord. A recent study published a protocol for quantitative single-voxel cervical spinal cord spectroscopy, presenting the first mean relative concentration ratios for NAA, creatine plus phosphocreatine (Cr), Cho, and mIns in a group of 10 healthy volunteers by using a clinical 3T MR imaging system.27 The present study applied the same acquisition and postprocessing protocol to quantify the main CNS metabolites on the cervical spinal cord plaques of a group of 15 patients with relapsing-remitting MS (RRMS) and compared them with the metabolite content of the group of healthy volunteers, to see if there was a difference between the MR spectroscopic findings of the cervical spinal cord in patients with RRMS and in volunteers. Then we evaluated whether these MR imaging measures correlate with disability in these patients, assessed through the Expanded Disability Status Scale (EDSS).
Materials and Methods
Patients
We recruited a group of 15 patients (9 women and 6 men; range, 25–74 years of age; mean, 39 ± 12 years) with a diagnosis of RRMS,28 who presented with at least 1 lesion in the spine between C2 and C3 documented by conventional MR imaging. On the day of scanning, all patients were clinically assessed and were scored on the EDSS. All subjects provided written informed consent before the study, which was approved by the local ethics committee.
Conventional MR Imaging and MR Spectroscopy
All patients underwent a morphologic study by using a 3T whole-body system (Signa Excite; GE Healthcare, Milwaukee, Wis) with a standard 8-channel phased array spinal coil (USAI 8ch CTL coil; GE Healthcare), with the 4 upper elements selected (configuration used for cervical spine imaging).
T2-weighted fast spin-echo images (FSE; TR, 3000 ms; TE, 106 ms; NEX, 4) on the sagittal plane, without and with fat saturation; T2* weighted gradient-echo images (multiple echo recombined gradient-echo; TR, 600 ms; TE, 10 ms; NEX, 2) on the axial plane; and T1-weighted FSE images (TR, 600 ms; TE, 17 ms; NEX, 3) on the sagittal plane, before and after contrast administration, were obtained.
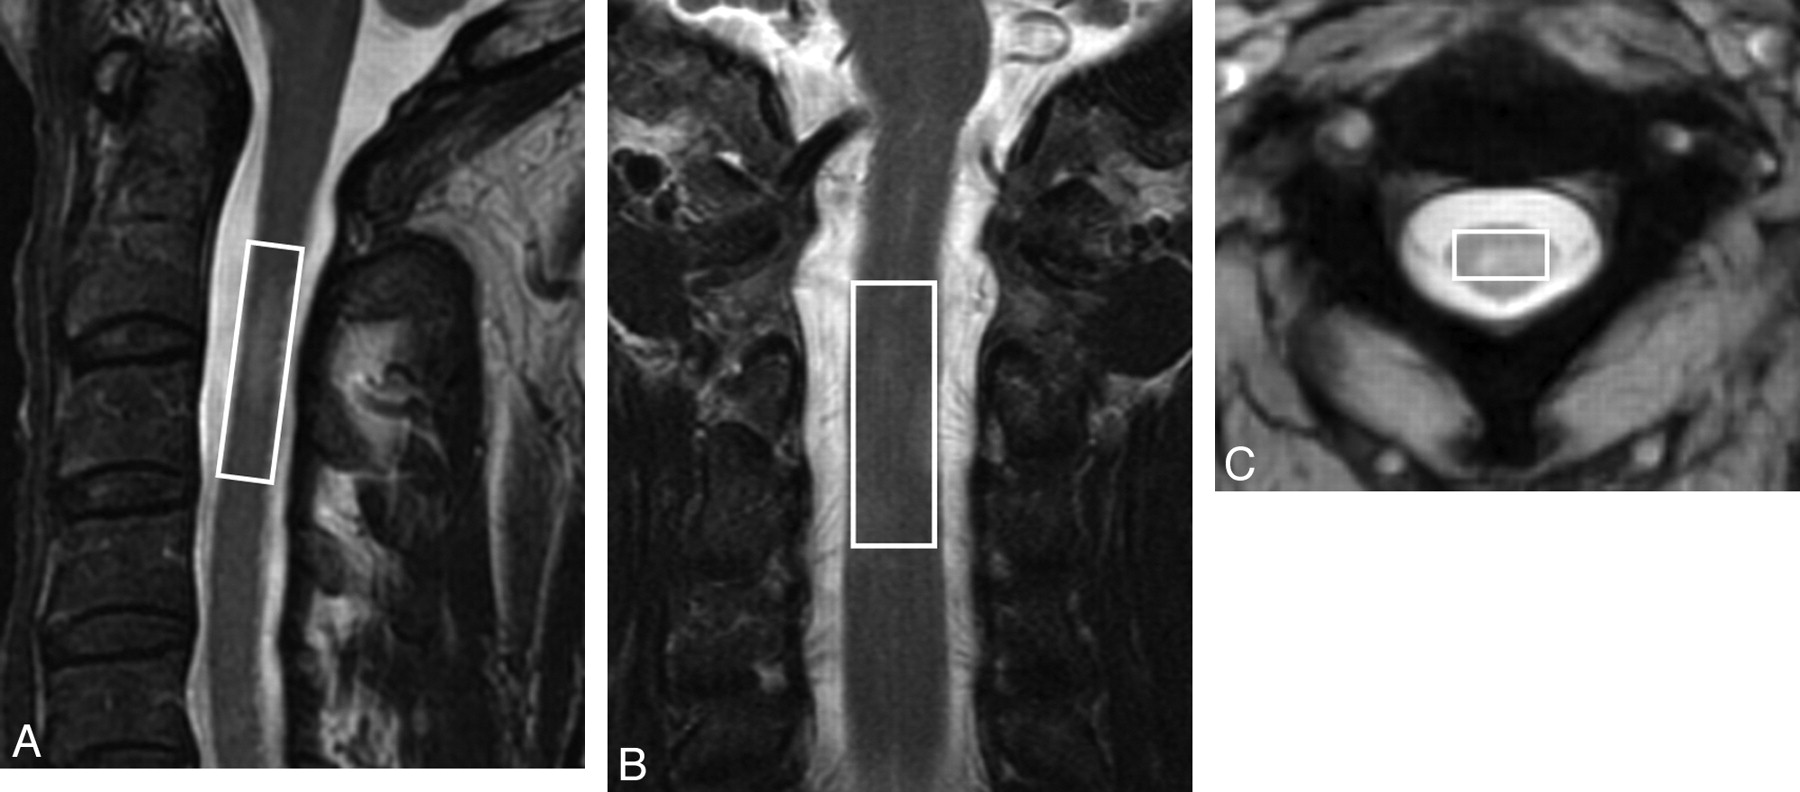
The single-voxel spectra were obtained by using the same machine and coil with a point-resolved spin-echo sequence, with a TR of 2000 ms and a TE of 35 ms. A 3-pulse chemical shift selective sequence to provide water suppression and 400 repetitions was used. Six very selective suppression29 saturation bands with a thickness 30 mm were placed contiguous to the volume of interest (VOI) to minimize fat contamination. Following the suggestions of Cooke et al30 to prevent fat contamination, a rectangular 1H-MR spectroscopy VOI with dimensions of approximately 7 × 9 × 35 mm (mean volume, 1.7 ± 0.4 mL; ranging from 1.0 to 3.5 mL) was prescribed along the main axis of the cord, approximately between levels C2 and C3, over a plaque identified as hyperintense on previously acquired sagittal and coronal T2-weighted FSE and axial T2* weighted images, avoiding healthy tissue as much as possible (Fig 1).

A, Point-resolved spin-echo sequence volume of interest (VOI) location on a sagittal fast spin-echo (FSE) T2-weighted image. B, The same VOI as in A on a coronal FSE T2- weighted image. C, The same VOI as in A and B on an axial T2* weighted image between C2 and C3.
For each metabolite spectrum, 16 additional acquisitions with unsuppressed water were performed, with a total spectrum acquisition time of approximately 14 minutes. Automated optimization of gradient shimming, transmitter pulse power, and water suppression was used. To maintain acceptable acquisition times in a clinical setting and to compare data with the values obtained in healthy subjects,27 we used automatic shimming and did not apply cardiac gating.
Imaging Postprocessing and Analysis
All MR spectroscopy data were analyzed by the user-independent fitting routine LCModel (http://s-provencher.com/pages/lcm-test.shtml)27,31 (with LCMgui). As reported in the LCModel user manual, the program automatically recognizes the phased array data and combines them by a weighted average on the basis of the observed scatter in each channel. Three typical postprocessed spectra from 3 patients are shown in Fig 2.

A−C, LCModel analysis results from 3 different patients with RRMS.
The concentrations relative to the internal water signal intensity and in arbitrary institutional units were obtained by using the GE-provided basis sets (acquired with a TE = 35 ms and a TR = 6000 ms) and the transmit gain and receiver amplitude corrections as described in the LCModel user manual. The relative concentrations expressed by the absolute concentration ratios of total NAA (NAA + N-acetyl aspartylglutamate, hereafter reported as tNAA), Cho-containing compounds, mIns, and Cr were calculated. Mean, SD, and coefficient of variation (CV) of the main metabolite absolute concentrations and ratios were calculated.
The Student t test was used to evaluate the previously published27 difference in healthy metabolite content of the cervical spinal cord, acquired with the same protocol on a group of 10 healthy volunteers (4 women and 6 men; range, 22–66 years of age; mean, 34.9 ± 12.2 years) who were age- and sex-matched with the group of patients with RRMS, with a statistically significant threshold of P = .01.
The linear correlation between each metabolite ratio (tNAA:Cr, tNAA:Cho, Cho:Cr, and mIns:Cr) value and the EDSS scores for the patient group was evaluated by linear regression by using the statistical threshold P = .01.
Results
The final full width at half maximum and signal intensity–to-noise values (reported as mean ± SD) for the patients with RRMS, estimated by the LCModel, were 0.11 ± 0.02 ppm and 4 ± 1. The corresponding values for the healthy group were 0.10 ± 0.02 ppm and 4 ± 1.
The Table lists the mean, SD, and CV of the main metabolite concentration ratios (in arbitrary institutional units) obtained from the patients with RRMS compared with the healthy subjects. The significance values for the evaluation of the statistical difference between the 2 groups of data are reported in the last row of the Table.
Main metabolite concentration ratios in the cervical spinal cord of healthy volunteers and patients with RRMS
The group mean SD percentage values obtained by LCModel analysis for the main metabolites in the patients with RRMS were 18 for tNAA, 14 for Cr, 9 for Cho, and 11 for mIns. The corresponding values for healthy volunteers were 13 for tNAA, 13 for Cr, 10 for Cho, and 12 for mIns. The linear correlation analysis between each main metabolite ratio (tNAA:Cr, tNAA:Cho, Cho:Cr, and mIns:Cr) and the EDSS scores did not give a statistically significant coefficient of determination.
Discussion
Among the few cervical spine spectroscopy studies,21–27,30,32–34 only 4 provided data acquired in patients with MS and only 126 quantified the main metabolites on T2-weighted hyperintense plaques.
Kendi et al21 measured NAA, Cr, Cho, mIns, lipids, and lactate on the normal-appearing cervical cord of patients with MS, finding only NAA significantly reduced with respect to the corresponding values in healthy volunteers.
Blamire et al22 recently quantified NAA, Cr, Cho, and mIns in the cervical cord of patients with MS, but they did not verify the presence of potential T2-weighted lesions on the measured cervical cord tract. They also found only NAA significantly reduced with respect to the corresponding values in healthy volunteers.
A methodologically interesting study just published by Henning et al23 measured the main cervical spine metabolites of only 1 patient with MS, finding a decrease of NAA and mIns and an increase in Cho compared with a group of healthy volunteers.
The present study focused on cervical spine lesions that were hyperintense on T2-weighted MR images in a group of patients with RRMS, without differentiating among them in terms of contrast enhancement or T1-weighted hypointensity as Ciccarelli et al26 had done. We compared the values obtained with those of age- and sex-matched healthy volunteers.
We focused on T2 hyperintense lesions because, according to Bot and Barkhof,35 in contrast to brain MR imaging findings, MS abnormalities are only rarely seen on sagittal T1-weighted images. Enhancing lesions may be seen on T1-weighted images, representing active MS pathology, though the prevalence of these enhancing lesions is low compared with that in the brain.35–38
The findings of Henning et al23 are in agreement with the metabolite trend found in the present study, except for the mIns peak, but the data from a single patient are insufficient for the purposes of comparison.
In comparison with previous studies,21–22 we found a greater metabolite variation between patients and volunteers. In addition to confirming the significant drop in NAA:Cr in patients, we also found a significant difference in Cho:Cr and mIns:Cr. This discrepancy is probably due to the fact that we measured a group of lesions already displayed by T2-weighted imaging, albeit heterogeneous, in a more uniform group of selected patients with MS, including only subjects with RRMS.
The changes in metabolite ratios documented in this study are in accord with the metabolic abnormalities already observed on the brain plaques of patients with RRMS.11 Metabolite measurements in T2-weighted hyperintense brain areas1 disclosed a Cho increase related to attacks of inflammation, with consequent demyelination and a degree of remyelination. These attacks are taken to characterize the early course of relapsing MS. In the later stages of disease, a decrease of NAA is related to neurodegeneration or dysfunction, and an mIns increase results from gliosis and, early in the disease course, may have a prognostic value of future relapse and disability.20 All these findings confirm the emerging thesis that axonal dysfunction and myelin sheath destruction both contribute to MS abnormalities at every stage of the disease. MS brain and spine studies1,16,22,39,40 also demonstrated that axonal pathology and CNS atrophy are the main causes of MS-related disability.
Unlike other reports on the brain and cervical spine,18,19,22,40 but in agreement with Ciccarelli et al,26 the reduction of tNAA:Cr in our study did not correlate with the EDSS. This is not surprising because our data were collected from cervical MS plaques with varying degrees of activity (according to the MR imaging classification) in a group of patients with RRMS at different stages of disease. However, despite the variability of our patients, the group data show a metabolic change in all 3 main CNS metabolites (NAA, Cho, and mIns) involved in the pathophysiology of MS abnormalities.
More than 80% of patients with early-stage MS show MR imaging spinal cord abnormalities, and spinal cord examination can enhance the MS diagnostic specificity when there are MR imaging brain white matter abnormalities.38 Moreover, the occurrence and the characteristics of spinal cord abnormalities are largely independent of brain lesions.22,41 Although the sensitivity of spinal cord MR imaging is high, the relation between MR imaging and clinical findings remains poor. As already demonstrated by several brain studies, MR imaging parameters (like T2, T1, but also magnetization transfer ratio) in the spine also correlate better with demyelination than with the axonal disease,41–43 which is the most direct cause of disability in patients with MS.
In addition, high-field in vitro studies of MS pathologic spinal cord tissue41 suggested that the MS pathologic spinal cord tissue and the MS brain tissue have different biophysical properties and that MR imaging changes (like T2, T1, and magnetization transfer parameters) in the spinal cord are less specific than those in the brain. This finding increases the importance of the MR spectroscopy spinal cord examination in patients with MS in better evaluating the potential clinical disease evolution.
Spinal cord atrophy is sometimes estimated with MR imaging,44,45 but some authors22 observed that atrophy and NAA decrease are not correlated and that atrophy is not a complete marker of disease progression and axonal damage in the spine. Again, the addition of MR spectroscopy metabolic information can enhance the evaluation of pathologic cord involvement.
The present study did not address cord atrophy, but the possible effect of tissue atrophy on metabolite quantification was avoided by using the metabolite ratios instead of the absolute values.
Conclusions
Our in vivo proton 1H-MR spectroscopy spinal quantification protocol, already optimized on healthy volunteers, is reliable for clinical studies in patients with MS and could facilitate monitoring the disease course and the efficacy of therapy in routine clinical practice. Riccioli et al46 showed this on a spinal demyelinating lesion in a patient with RRMS evaluated with 6 1H-MR spectroscopy from the onset of a relapse phase until the symptoms regression, 126 days later.
Because this technique is sensitive to subtle changes occurring during the disease course, it may be potentially useful in monitoring the outcome of therapy. In addition, this cervical spectroscopy protocol could be used to investigate other cervical cord pathologies. The long acquisition time is the main drawback of this technique in clinical practice because there is the risk of patient movement during the acquisition.
References
- Received March 31, 2009.
- Accepted after revision May 26, 2009.
- Copyright © American Society of Neuroradiology


