
Abstract
BACKGROUND AND PURPOSE: Relative cerebral blood volume (rCBV) accuracy can vary substantially depending on the dynamic susceptibility-weighted contrast-enhanced (DSC) acquisition and postprocessing methods, due to blood-brain barrier disruption and resulting T1-weighted leakage and T2- and/or T2*-weighted imaging (T2/T2*WI) residual effects. We set out to determine optimal DSC conditions that address these errors and maximize rCBV accuracy in differentiating posttreatment radiation effect (PTRE) and tumor.
MATERIALS AND METHODS: We recruited patients with previously treated high-grade gliomas undergoing image-guided re-resection of recurrent contrast-enhancing MR imaging lesions. Thirty-six surgical tissue samples were collected from 11 subjects. Preoperative 3T DSC used 6 sequential evenly timed acquisitions, each by using a 0.05-mmol/kg gadodiamide bolus. Preload dosing (PLD) and baseline subtraction (BLS) techniques corrected T1-weighted leakage and T2/T2*WI residual effects, respectively. PLD amount and incubation time increased with each sequential acquisition. Corresponding tissue specimen stereotactic locations were coregistered to DSC to measure localized rCBV under varying PLD amounts, incubation times, and the presence of BLS. rCBV thresholds were determined to maximize test accuracy (average of sensitivity and specificity) in distinguishing tumor (n = 21) and PTRE (n = 15) samples under the varying conditions. Receiver operator characteristic (ROC) areas under the curve (AUCs) were statistically compared.
RESULTS: The protocol that combined PLD (0.1-mmol/kg amount, 6-minute incubation time) and BLS correction methods maximized test AUC (0.99) and accuracy (95.2%) compared with uncorrected rCBV AUC (0.85) and accuracy (81.0%) measured without PLD and BLS (P = .01).
CONCLUSIONS: Combining PLD and BLS correction methods for T1-weighted and T2/T2*WI errors, respectively, enables highly accurate differentiation of PTRE and tumor growth.
Dynamic susceptibility-weighted contrast-enhanced perfusion MR imaging (DSC) offers important imaging biomarkers to evaluate high-grade gliomas in the posttreatment setting. Tumor recurrence and posttreatment radiation effect (PTRE) both demonstrate contrast-enhancing MR imaging lesions, which are often indistinguishable on conventional imaging; however, DSC measures of relative cerebral blood volume (rCBV) can differentiate the 2 entities on the basis of differences in inherent microvascular attenuation.1,2
We previously correlated localized DSC measurements with image-guided tissue analysis to establish rCBV threshold values that accurately identify histologically distinct subregions of tumor and PTRE within large enhancing lesions.2 Use of DSC and these thresholds provides a noninvasive diagnostic tool that can characterize lesion heterogeneity and help determine appropriate clinical management, because MR imaging lesions predominantly composed of tumor are often treated differently from predominantly PTRE lesions.
In clinical practice, however, the accuracy of rCBV measurements and representative rCBV maps can vary substantially depending on the DSC acquisition and postprocessing methods due to blood-brain barrier (BBB) disruption and resulting T1-weighted leakage and T2- and/or T2*-weighted imaging (T2/T2*WI) residual effects.3–6 These effects occur commonly in both tumor and PTRE lesions and can diminish test reliability, whether the rCBV maps are evaluated qualitatively (visual inspection), semiquantitatively, or quantitatively (region of interest analysis). Thus, it is paramount that the DSC technique be optimized to prevent or correct these inaccuracies and ensure that rCBV measurements maintain their correlation with histopathology.
Preload dosing (PLD) and baseline subtraction (BLS) techniques have been proposed as simple methods to minimize and correct for T1-weighted leakage and T2/T2*WI residual effects, respectively.3,5 These approaches are empiric, in contrast to mathematic modeling approaches such as gamma variate analysis.4,5,7 PLD administration of contrast agent before the DSC acquisition minimizes T1-weighted leakage effects by saturating the extravascular-extracellular-space tissue T1-weighted signal intensity, thereby diminishing T1-induced signal-intensity increases during the subsequent DSC contrast injection. The BLS correction technique applied during postprocessing integration prevents overestimation of rCBV caused by T2/T2*WI residual effects from leakage and/or recirculation, which causes persistent signal-intensity decreases following the initial first-pass contrast bolus.
Evidence suggests that PLD amount and other factors, such as incubation time, may impact the adequacy of T1-weighted leakage correction and rCBV measurement accuracy.4,5,8 Published PLD amounts currently range from 0.01 to 0.10 mmol/kg, at a 1.5T field strength;4,5,8,9 however, no general consensus exists regarding which PLD amount enables the most accurate rCBV estimation, whether PLD amounts >0.1 mmol/kg provide further benefit, and what optimal protocols are necessary at higher field strengths. Additionally, T2/T2*WI residual effects and the need for appropriate correction methods, such as BLS, may be related to PLD amount, further confounding accurate rCBV measurement.3,5
There is a clear need in the medical imaging community to validate DSC techniques to determine standardized methods that provide clinically reliable measurements across multiple institutions.10 These DSC methods should also take into consideration the recent linkage between nephrogenic systemic fibrosis and total contrast dosage.11 Because DSC optimization impacts both clinical safety and measurement accuracy, the ultimate goal would be to identify the DSC protocol that maximizes test reliability while, at the same time, minimizing overall patient contrast load.
To our knowledge, there has not been a formal study that evaluates the dose-dependent relationship between PLD amount, T2/T2*WI correction, and rCBV accuracy to distinguish PTRE from tumor. We report a prospective study that correlates image-guided tissue analysis of enhancing MR imaging lesions with localized rCBV measurements at increasing PLD amounts, with and without BLS correction. We hypothesized that rCBV accuracy depends on PLD amount and that combining both PLD and BLS correction methods maximizes test accuracy in differentiating tumor from PTRE. Our goal was to provide recommendations that improve DSC method accuracy and standardization, to diagnose the histologic heterogeneity in posttreatment gliomas.
Materials and Methods
Subject Recruitment and Exclusion Criteria
From January 2007 to April 2008, we consecutively recruited previously treated patients with World Health Organization grade III and IV primary high-grade gliomas undergoing preoperative imaging for surgical re-resection of recurrent newly developed contrast-enhancing lesions on surveillance MR imaging. All patients had previously undergone initial treatment for their tumors, which consisted of combined surgical resection with adjuvant chemotherapy (which included temozolomide in all cases) and radiation therapy before enrollment into this study.
All patient information was anonymized for Health Insurance Portability and Accountability Act compliance. The institutional review board approved our study, and each subject gave written and informed consent.
The estimated glomerular filtration rate (eGFR) was calculated from serum creatinine levels, patient demographics, and age. Patients with eGFR < 60 mg/min/1.72 m2 were excluded before enrollment. For each subject, we documented the presence of steroid therapy at the time of imaging and radiation therapy timing and dose. Criteria for exclusion of MR imaging data based on quality are described in detail in the “Coregistration of Stereotactic and DSC Image Datasets” subsection.
Preoperative DSC and PLD Protocol
Our project design consisted of a stepwise predosing protocol by using a broad range of increasing PLD amounts and incubation times before rCBV measurements, as previously described.12 We performed 6 sequential evenly timed DSC acquisitions, each using a half-dose (0.05 mmol/kg) bolus of gadodiamide (Omniscan; Nycomed Amersham, Oslo, Norway) injected at a rate of 3–5 mL/s (followed by a 20-mL normal saline flush) on the 10th time point of each series. Each 2-minute DSC acquisition consisted of 60 time points, and 1 minute separated the end of 1 DSC acquisition and the start of the next. Thus, sequential contrast injections were separated by 3 minutes. Note that the total contrast dosage following all 6 DSC acquisitions (0.3 mmol/kg) was within the US Food and Drug Administration−approved limit for this agent.
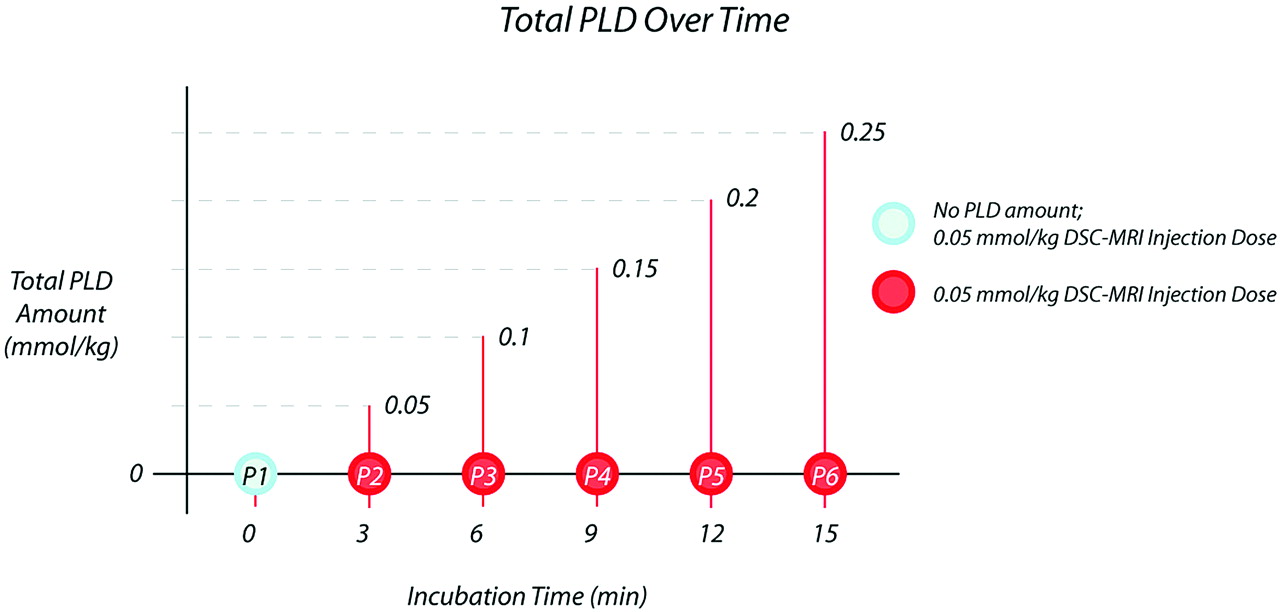
In summary, we acquired 6 separate DSC datasets by using 6 distinct DSC protocols in each patient, on the basis of which each successive DSC acquisition and rCBV measurement were performed with incrementally increasing PLD amounts and incubation times from the sum of all prior injections, as depicted in Fig 1. For example, the first DSC acquisition was performed by using a protocol without PLD, whereas the sixth DSC acquisition was performed by using a protocol with 0.25-mmol/kg PLD administered during an incubation time of 15 minutes. In a previous article, we reported information from 1 of the 6 DSC MR imaging datasets, with the purpose of establishing the feasibility of correlating localized DSC values with stereotactic surgical tissue specimens to convey the clinical utility of rCBV in distinguishing tumor and PTRE.2 In that article, we referred to a separate citation,12 which compared the clinical accuracies of all 6 DSC datasets and ultimately supported our decision to report only the third sequential DSC dataset (acquired by using the following protocol parameters: preload dose of 0.1 mmol/kg and a total contrast dose of 0.15 mmol/kg).2 Because the general issue and methodology of pursuing DSC−MR imaging technique optimization were beyond the scope of that previous paper,2 we did not include the experimental data or statistical analyses from all 6 injections.12

Diagram demonstrates the step-wise preload dosing (PLD) protocol. Circles depict the 6 sequential dynamic susceptibility-weighted contrast-enhanced (DSC)-acquisition 0.05-mmol/kg contrast injections, each separated by 3 minutes. Relative cerebral blood volume (rCBV) was calculated from each DSC acquisition. The PLD amount for each acquisition (ie, P2 through P6) equals the sum of all preceding contrast-injection amounts. The blue circle (P1) represents the control DSC acquisition with no PLD amount. MRI indicates MR imaging.
To address this distinctly important issue of DSC−MR imaging technique optimization, our current article describes in detail the methodology, experimental results, and clinical recommendations from the aforementioned citation, which includes information from all 6 DSC−MR imaging datasets in full.12 To this end, our current purpose was to describe the effects of T1-weighted and T2/T2*WI correction on the correlation with spatially accurate histopathology, specifically regarding the presence of and variation of the preload dosage, incubation timing, and use of baseline subtraction postprocessing. Our hope is that this information further supports the need for standardization and improved accuracy of the DSC−MR imaging technique in posttreatment patients with glioma.
MR Imaging Parameters
All patients were scanned within 1 day before surgery on a 3T MR imaging magnet (Signa HDx; GE Healthcare, Milwaukee, Wisconsin) following placement of an intravenous catheter in the antecubital fossa or forearm. A standard manufacturer DSC sequence was used with the following parameters: gradient-echo echo-planar imaging (EPI) with TR/TE/flip angle (FA), 2000 ms/20 ms/60°; FOV, 24 × 24 cm; matrix, 128 × 96; 5-mm sections; no gap. We recognized differences in T1-weighted and T2/T2*WI sensitivity and image quality with different choices of pulse sequence. In our case, the longer TR enabled ample section coverage and the FA provided signal intensity–to-noise-ratio benefits. The wide availability of our chosen DSC sequence also improved the likelihood that other centers could reproduce this technique.
T1-weighted spoiled gradient-refocused-echo inversion-recovery−prepped stereotactic MR imaging datasets (TI/TR/TE, 300/6.8/2.8 ms; matrix, 320 × 224; FOV, 26 cm; section thickness, 2 mm) were obtained immediately before and following DSC to guide stereotactic surgical-specimen collection.
Intraoperative Tissue-Specimen Collection
Image-guided tissue collection was performed as previously described.2 In brief, a neurosurgeon created the smallest possible diameter craniotomy to minimize brain shift and collected an average of 3 tissue specimens from each subject during surgical resection. Specimens were randomly sampled from different poles of enhancing locations within the lesion periphery. All stereotactic imaging locations were visually validated with corresponding intracranial neuroanatomic landmarks. Screen-capture images were recorded to document specimen stereotactic location for coregistration with the DSC dataset. Tissue collection was performed without knowledge of DSC measurements.
Coregistration of Stereotactic and DSC Image Datasets
Stereotactic MR imaging and the 6 DSC image datasets were transferred to an off-line Linux-based workstation to perform rigid-body coregistration by using Statistical Parametric Mapping (SPM5; Wellcome Department of Imaging Neuroscience, London, UK) to help offset EPI image distortion. Before coregistration, images in each DSC dataset were visually evaluated by a neuroradiologist with >9 years’ experience with DSC (L.S.H.) to ensure that no significant patient motion occurred during the time series. Contrast bolus susceptibility changes typically confound accurate coregistration and image realignment techniques during a single acquisition; thus, obvious motion during any of the 6 acquisitions excluded all of that patient’s data from further analysis. For the remaining subjects, the fourth DSC dataset was arbitrarily chosen to provide a mean of 2 time-series images before and following contrast-bolus passage. The stereotactic MR imaging dataset and all other DSC time-series images were coregistered to that mean image for each subject. This process corrected patient motion between DSC acquisitions. A neuroradiologist (L.S.H.) visually validated coregistration accuracy.
DSC Data Postprocessing and rCBV Calculation
DSC data were analyzed by using an in-house Matlab-based (MathWorks, Natick, Massachusetts) MR perfusion analysis program with postprocessing steps based on previously published methods.2,13,14
Calculation of Cerebral Blood Volume.
After excluding the first 3 data points from each time series to allow tissue signal-intensity saturation, we generated whole-brain cerebral blood volume (CBV) maps by trapezoidal integration under the ΔR2*(t) area curve from the start to the end of the first-pass contrast bolus on a voxel-by-voxel basis using 2 different methods (Fig 2): 1) integration without BLS; and 2) integration with BLS, which excluded a right triangular area whose hypotenuse was determined by the line extending from prebolus to postbolus baselines and whose height was determined by the difference between prebolus and postbolus ΔR2*(t) values.3 Trapezoidal integration provides a common, robust, and simple method compared with other techniques such as gamma variate fitting.15,16 We determined the integration interval on the basis of the first-pass ΔR2*(t) curves from normal brain parenchyma. We applied this integration interval to every voxel on the map. To account for possible noise and timing variation in the time-course data, we determined the postbolus ΔR2*(t) baseline as the average of 5 ΔR2*(t) values, which included the value at the end of the integration interval and values from the 4 successive time points.
rCBV Map Generation.
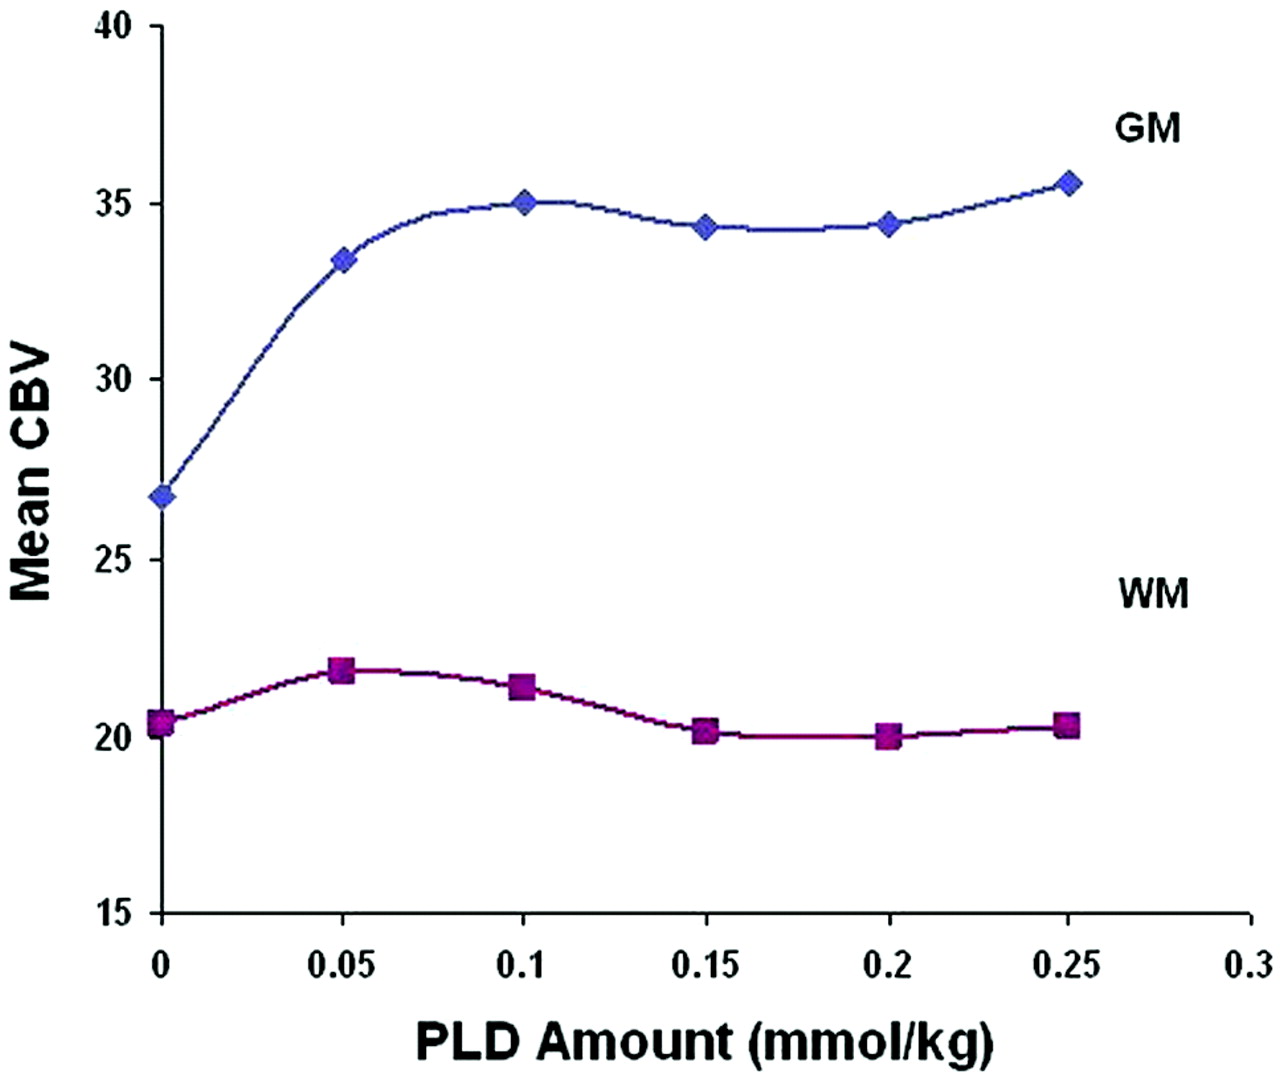
A method of normalizing CBV maps to both normal-appearing gray matter (NAGM) and white matter (NAWM) contralateral to the enhancing lesion was previously described.2 However, despite BLS techniques, NAGM CBV demonstrated greater variability with increasing PLD amounts compared with NAWM (Fig 3), which could confound the evaluation of the PLD relationship with lesion rCBV. Due to NAWM CBV stability, we normalized CBV maps to the average of two 3 × 3 voxel regions of interest placed centrally within frontal and parietal NAWM to generate whole-brain rCBV maps. Note that changing the method of normalization will alter rCBV threshold values.2
rCBV Map Region-of-Interest Analysis.
Coregistration of datasets enabled placement of 3 × 3 voxel-sized (∼0.4 cm2) regions of interest centrally within the previously recorded stereotactic dataset locations for each surgical tissue specimen. We calculated mean rCBV values and correlated these with corresponding specimen histopathology, as previously described.2 All regions of interest were inspected to ensure exclusion of visible vessels. DSC measurements were performed without knowledge of histopathology.
Tissue Histopathologic Diagnosis
All surgical specimens were formalin-fixed, paraffin-embedded, sectioned, and hematoxylin-eosin stained per standard diagnostic protocol at our institution. Without knowledge of DSC results, we histopathologically categorized each specimen as either tumor or PTRE, as previously described2: PTRE features included paucicellularity, lack of numerous atypical cells, lack of mitotic figures, and reactive cells including gemistocytes. Necrosis, if present, involved parenchyma rather than cellular tumor. Tumor-recurrence features included sheets and/or nests of atypical cells often with mitotic figures. Necrosis involved cellular tumor rather than parenchyma. Samples containing a mixture of both tumor and PTRE were classified as tumor, regardless of the percentage of tumor bulk. Only samples with pure radiation change (in the absence of tumor criteria) were categorized as PTRE. The sole presence of a few isolated, scattered atypical cells did not qualify as tumor categorization, as long as other neoplastic features were absent.

Graph shows cerebral blood volume (CBV) calculation methods. A, Uncorrected CBV calculation by trapezoidal integration without baseline subtraction (BLS). B, BLS integration excludes a triangular area (red) that estimates the T2/T2*WI residual effects. The remaining area under the curve (AUC) (blue lines) estimates the corrected CBV.

Graph shows CBV over an increasing PLD amount from normal-appearing gray matter (GM) and white matter (WM) regions of interest. CBV values are calculated by using BLS integration.
Statistical Analysis: rCBV Correlation with Histopathology and Region-of-Interest Comparison
We performed a primary analysis for all rCBV datasets by generating receiver operator characteristic (ROC) curves to distinguish tumor and PTRE samples. This was done for rCBV datasets acquired following all 6 PLD amounts and calculated both with and without BLS postprocessing. Thus, a total of 12 ROC curves were generated for the 36 tissue specimens. Areas under the curve (AUCs) were calculated for each ROC and statistically compared by using the Delong Delong Clarke-Pearson method. Sensitivity, specificity, and 95% confidence intervals (CIs) for distinguishing PTRE and tumor were generated from each ROC curve at a number of rCBV cutoff points (Analyse-it Software, Leeds, UK) to determine the optimal threshold value that maximized accuracy (defined as the average of sensitivity and specificity).
To evaluate possible covariance grouping effects from multiple intrasubject specimens, we performed a secondary analysis of ROC curves for all 12 conditions by using a smaller set of samples. We limited this analysis to single randomly selected specimens and corresponding rCBV values from each subject. We calculated AUCs for ROC curves and statistically compared them by using the Delong Delong Clarke-Pearson method to evaluate for the similarity in trends to the first analysis of the complete dataset. Results of the secondary analysis trended in the same direction as those of the primary analysis, though the secondary analysis did not reach statistical significance, likely due to the reduced sample size. Results of the primary analysis are presented herein. A biostatistician (A.C.D.) performed all analyses.
Results
Study Subjects, Tissue Specimens, and Histopathologic Analysis
Initially, 40 tissue specimens were collected from 13 subjects; however, 4 samples from 2 subjects were excluded from the data analysis due to motion during ≥1 of the sequential DSC acquisitions. A total of 36 tissue samples (11 subjects) were included for final data analysis and categorized as tumor (n = 21) or PTRE (n = 15). The group mean and SD of craniotomy diameters were 3.97 ± 1.71 cm. The average tissue-specimen volume was approximately 0.3 cm3. Table 1 summarizes the patient demographics, subtype and grade of originally treated tumor, presence of steroid therapy, and radiation therapy type and timing. Of the 11 subjects, 3 (27.2.%) had only PTRE specimens, 5 (45.5%) had only tumor specimens, and 3 (27.2.%) had both types of specimens.
Patient demographic and clinical information
rCBV versus Histopathology: ROC Analyses and Accuracy Comparison
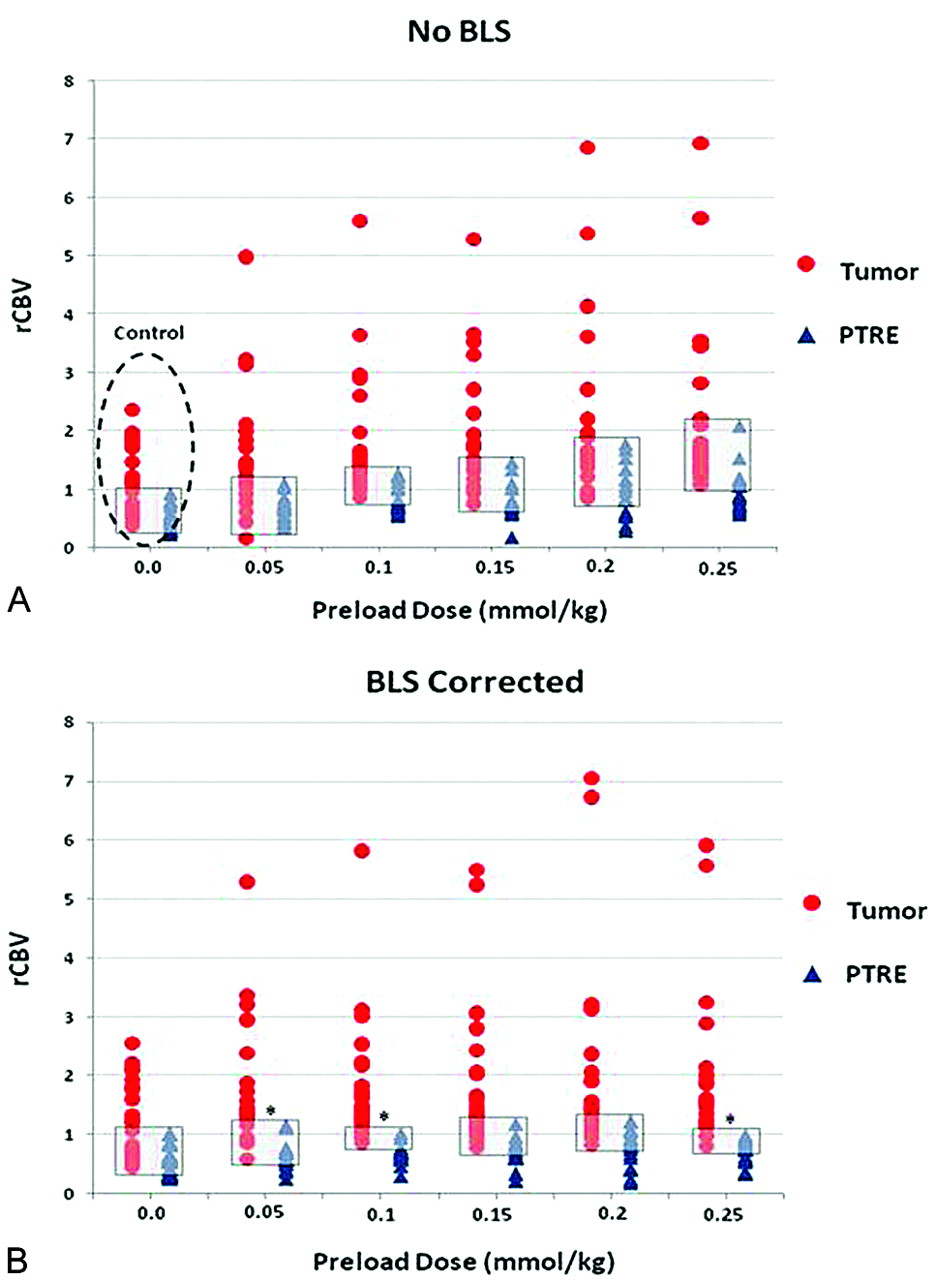
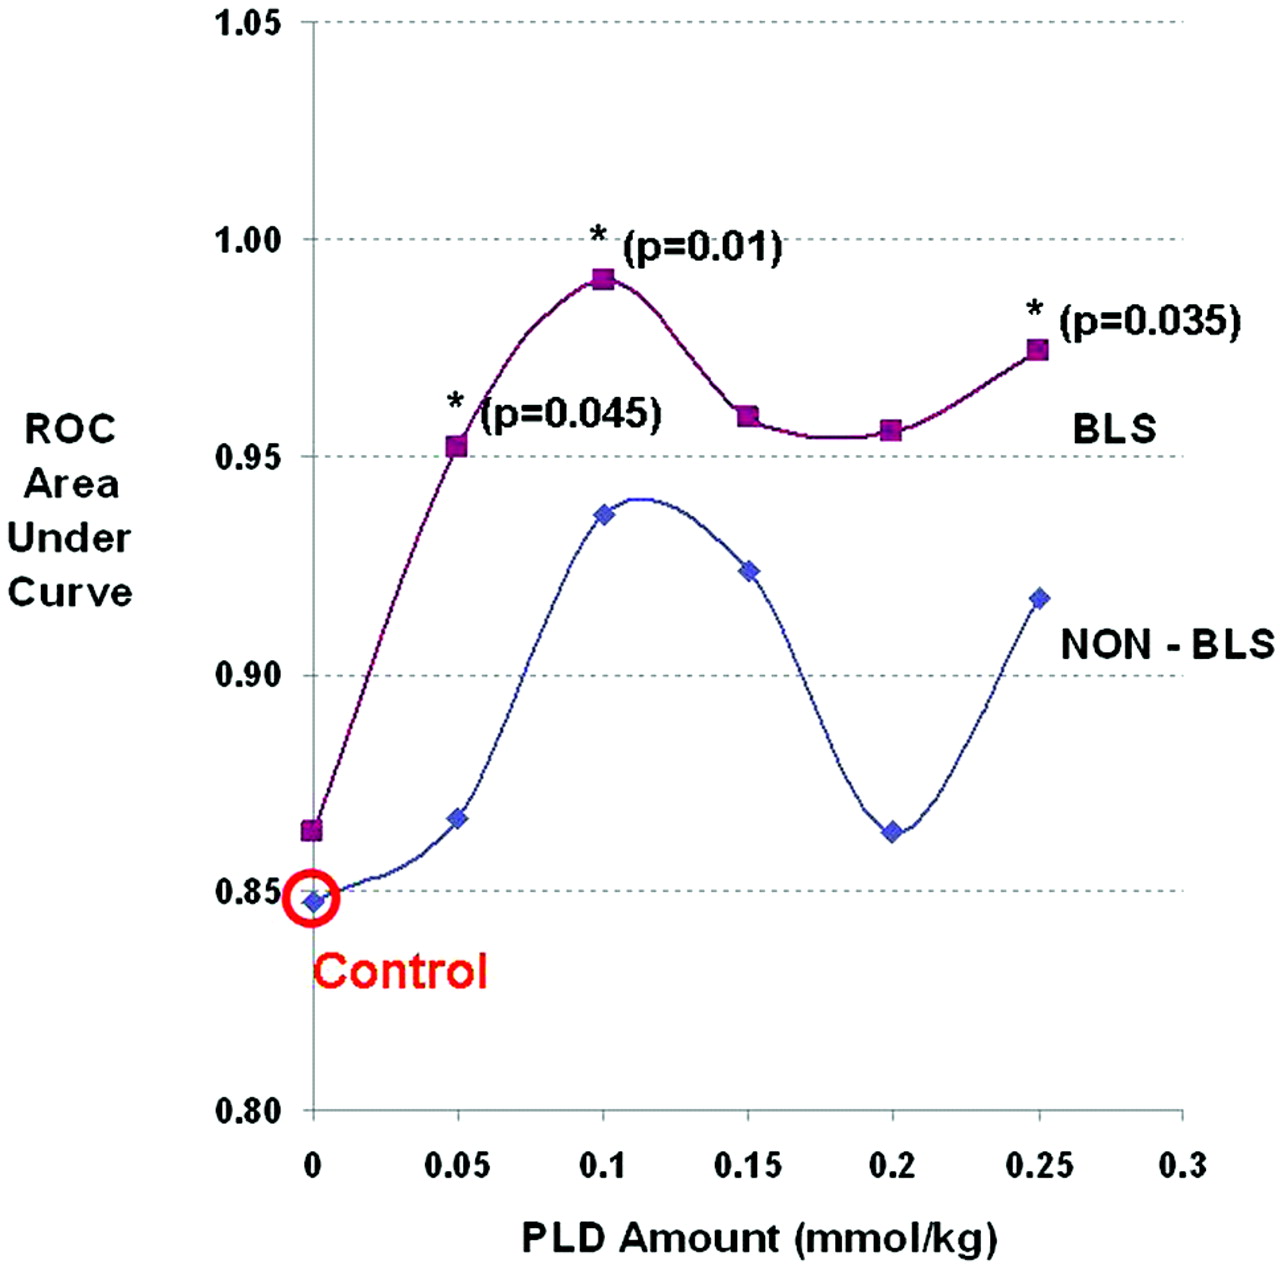
Figure 4 summarizes the primary analysis results and the distribution of rCBV values for the tumor and PTRE groups for the 12 DSC methods, with respect to PLD amount and presence of BLS correction. Uncorrected test AUC (0.85) in the absence of any type of correction (either PLD or BLS) represented the comparison control, with a maximized test accuracy of 81% (sensitivity, 61.2%; specificity, 100%) over an rCBV threshold value range between 0.93 and 0.97 (95% CI, 58.3%–91.0%). BLS correction alone (in the absence of PLD correction) did not result in an appreciable increase in test AUC compared with that of controls. As PLD amount and incubation time increased, trends demonstrated that the test AUC increased in the absence of BLS; however, for no PLD amount (in the absence of BLS) did the AUC increase reach statistical significance compared with that of the control. When PLD and BLS correction methods were combined, test AUC significantly improved at specific PLD amounts and incubation times (Figs 4 and 5). Table 2 summarizes the percentage of tumor and PTRE specimens that were correctly diagnosed by rCBV measures by using the 12 specific PLD and BLS protocols. The protocol using a 0.1-mmol/kg PLD amount, an incubation time of 6 minutes, and BLS correction yielded the highest test AUC (0.99), with a test accuracy of 95.2% (sensitivity, 90.5%; specificity, 100%) over an rCBV threshold value range between 1.02 and 1.04 (95% CI, 73.9%–99.4%), while minimizing contrast dosage to the subjects.

Graph shows distribution of rCBV values for tumor (red circles) and posttreatment radiation-effect (PTRE) (blue triangles) groups over the increasing PLD amounts without BLS (A) and with BLS (B). Gray boxes depict the range of overlapping rCBV values between groups under each condition. Asterisks in B denote conditions that demonstrated statistically significant increases in the rCBV receiver operator characteristic (ROC) AUC compared with the control acquisition (dotted circle). These are observed with BLS and PLD amounts of 0.05 (P = .045), 0.1 (P = .01), and 0.25 (P = .35) mmol/kg, with incubation times of 3, 6, and 15 minutes, respectively.

Graph shows the effects of PLD amount and the presence of BLS correction on DSC test accuracy (represented by ROC AUC). Asterisks (with P values) denote test conditions that demonstrate a statistically significant increase in rCBV ROC AUC compared with the control acquisition (red circle).
Percentage of tumor and PTRE specimens that were correctly diagnosed by rCBV thresholds measured under various DSC conditions
Discussion
In this study, we measured rCBV under varying acquisition and postprocessing conditions and correlated localized values with image-guided tissue histopathology to specifically answer the following questions: Does leakage correction improve DSC accuracy to distinguish subregions of PTRE from tumor recurrence, and does this correction depend on PLD amount? To our knowledge, this issue has not been previously addressed in a direct manner. Our data suggest that the test accuracy is approximately 81% without correction but increases to >95% following specific correction methods. These differences in rCBV accuracy can also be observed qualitatively (Fig 6). This underscores the clinical importance of optimizing the acquisition and postprocessing parameters for DSC. On the basis of these findings, our recommendations for maximizing rCBV accuracy in differentiating PTRE and tumor regions at 3T field strength are as follows:
-
Combining T1 leakage and T2/T2*WI residual correction is necessary to maximize test accuracy.
-
The PLD amount of 0.1 mmol/kg should be administered 6 minutes before the DSC acquisition injection to minimize T1 leakage effects.
-
BLS integration, or some other comparable T2/T2*WI correction, should be performed during postprocessing CBV calculation for T2/T2*WI leakage correction.
-
If time permits, conventional imaging could proceed during the “downtime” of the incubation period to help offset time delays in a busy clinical practice.

Graph shows that representative rCBV color maps are obtained with 2 different DSC protocols and are subsequently masked and overlaid on the same contrast-enhanced MR imaging lesion, with identical color scales that progress from blue (low) to red (high). A, Before leakage correction, the lesion inaccurately demonstrates an even mixture of tumor and PTRE voxels based on uncorrected rCBV. B, Following PLD-BLS (0.1 mmol/kg) correction, rCBV increase demonstrates a greater abundance of tumor voxels.
Previous studies have discussed how both T1 and T2/T2*WI leakage effects can confound accurate DSC measurements.3,5 T1-weighted leakage effects increase signal intensity and compete with susceptibility-induced signal-intensity decreases, resulting in an underestimation of rCBV;4–6,13 T2/T2*WI residual effects magnify signal-intensity decreases and overestimate rCBV.3,5 In reality, both effects are variably present during rCBV measurement, though technical and physiologic factors influence which effect predominates.3,5 A variety of possible correction algorithms have been proposed; however, we chose the PLD and BLS methods because they are each robust and technically facile, increasing the likelihood that a broad range of institutions and clinical practices could implement these optimization techniques.
Multiple factors can influence the adequacy of PLD correction of T1-weighted leakage effects. Previous studies have proposed PLD dose-dependence;5,13 however, even if the PLD amount is maximized, the incubation time that allows the preinjected contrast agent to diffuse into the extravascular-extracellular-space tissue plays as important a role in adequate correction as the amount itself. Boxerman et al4 administered 0.1-mmol/kg PLD immediately before the DSC injection for rCBV measurement but reported insufficient correction. Conversely, Kassner et al5 reported sufficient correction with the equivalent PLD amount by waiting an incubation time of 6–10 minutes before the DSC injection for rCBV measurement. Their study at 1.5T is in agreement with our current results and the previously reported protocol at 3T.2 We administered the total PLD amount of 0.1 mmol/kg via 2 separate injections. We suspect that administering the total dose via a single injection 6 minutes before the DSC acquisition would yield comparable results. Nonetheless, current ongoing studies at our institution will help confirm this through clinical validation.
The type of contrast agent can also affect the degree of observed T1-weighted effects, as well as the efficacy of correction methods. Although this study evaluated gadodiamide, the contrast agent gadobenate dimeglumine (Multihance; Bracco, Milan, Italy) demonstrates approximately twice the in vivo T1 relaxivity as gadodiamide at equivalent doses, which suggests that there would be a greater T1 leakage effect with gadobenate. However, at the same time, the preloading dose of gadobenate may be more effective as well.13 This relationship may be confounded by gadobenate protein binding, which can offset the degree of extravascular contrast extravasation. Preliminary studies at our institution suggest that both contrast agents demonstrate approximately equal T2/T2*WI effects at equivalent doses. Regardless, further study is needed to help resolve these issues, particularly at high field strengths.
The optimal PLD and incubation time also depend on specific DSC pulse-sequence parameters that influence DSC T1-weighted sensitivity. Smaller FA sizes can reduce T1 leakage−effect sensitivity; however, this method does not completely eliminate these effects, and additional correction methods may still be necessary.5,7
There are also compromises to low FA, which include lower signal intensity–to-noise ratio and an increased magnitude of T2/T2*WI leakage effects.3,5 Use of short TRs can significantly increase T1-weighted sensitivity, negate any benefit of small FA techniques, and necessitate additional correction with PLD.5,17
There are several possible limitations to our study. The minimum PLD and incubation time to achieve adequate T1-weighted leakage correction may vary within different lesion subregions or from patient to patient due to a number of physiologic factors, including different degrees of BBB disruption and local contrast diffusion rates.5 Differences in steroids and chemotherapies may further exacerbate this heterogeneity. Nonetheless, our correction methods significantly improved test accuracy in our population, suggesting the clinical robustness of this technique. Addressing the above-mentioned heterogeneities by using other techniques that specifically evaluate vascular permeability, including dual-echo dynamic contrast-enhanced MR imaging and mathematic modeling, may further improve test accuracy in some cases.3,4,18,19 Formal studies comparing PLD and BLS methods with the aforementioned techniques would be beneficial.
Although our 3T study used a smaller contrast dosage for each bolus injection compared with that in most reports at 1.5T, DSC imaging at a 3T field strength has been shown to provide similar data quality with a lower necessary dosage compared with 1.5T.20 We confirmed this in our study because we observed sufficient quality of contrast response to generate highly accurate rCBV measurements. In fact, the possibility of lowering the total contrast load may be viewed as a potential advantage to DSC imaging at higher field strengths.
We also recognize possible limitations regarding our subject population and tissue specimens. Our relatively small sample size relates, in part, to the expected inherent obstacles in prospective recruitment of patients with recurrent glioma undergoing surgical resection. Also, we excluded a portion of our subject population and tissue samples due to inadequate image quality from motion artifacts. In this study, we assumed that each of the tissue specimens and their respective rCBV values represented independent measures, despite the fact that patients often provided multiple specimens. In all cases, tissue specimens were taken from distinct and spatially isolated locations within the periphery of large enhancing lesions. Similarly, the regions of interest for rCBV calculation for corresponding specimens were also spatially distinct, without voxel overlap. We realize that certain intrasubject physiologic factors may influence DSC measurements for multiple specimens similarly within a particular subject. For instance, each subject’s cardiovascular and renal status may influence the shape and quality of the contrast bolus arterial input and/or the contrast agent clearance from the blood pool and extravascular extracellular space. Our secondary analysis addressed these issues of covariance grouping effects, at least in part, by limiting analysis to single randomly selected specimens from each subject. This analysis showed trends that were similar to those in our primary analysis of the complete dataset and suggest the absence of large intrasubject covariance.
BLS effectively corrects T2/T2*WI residual effects, which are often prominent following PLD administration.3,5 In our study, BLS proved necessary to achieve the highest degree of rCBV accuracy following PLD administration of 0.1 mmol/kg and an incubation time of 6 minutes. rCBV accuracy slightly diminished following PLD amounts exceeding 0.1 mmol/kg, both in the presence and absence of BLS correction. It was not until PLDs and incubation times reached 0.25 mmol/kg and 15 minutes, respectively, that accuracy increased again. There is evidence that T2/T2*WI leakage effects may be dose-dependent.5 One hypothesis to explain our results is that high PLD amounts (>0.1 mmol/kg) may lead to contrast agent accumulation in the extravascular extracellular space or vascular blood pool, magnifying T2/T2*WI residual effects. It is possible that longer incubation times (≥15 minutes) may allow enough fractional clearance of the contrast agent from the blood pool or extravascular extracellular space to diminish these effects.21 Wedeking et al21 reported an 80% decrease in the gadopentetate dimeglumine plasma concentration by 15 minutes following injection in animal models.
Given our results, it is also possible that BLS may not fully correct T2/T2*WI effects at very high PLD amounts (>0.1 mmol/kg) unless longer incubation times are used to allow adequate contrast agent clearance. Nonetheless, exceeding the 0.1-mmol/kg PLD amount is unlikely to be clinically necessary or feasible, given our excellent accuracy with our single-dose PLD protocol as well as recent safety concerns regarding nephrogenic systemic fibrosis. In the future, it may be useful to explore the possible added benefit of other T2/T2*WI leakage-correction methods, such as mathematic modeling or dual-echo techniques.3–5,7,18
Inaccuracies regarding the coregistration of DSC data with stereotactic biopsy locations during surgical resection may be another possible limitation to our study. Advantages of image-guided tissue analysis by using stereotactic surgical resection as opposed to stereotactic needle biopsy were discussed previously.2 In brief, small craniotomy sizes minimized brain shift. Craniotomies also allowed the neurosurgeon to visually validate stereotactic image location with intracranial neuroanatomic landmarks (ie, adjacent vascular structures, ventricle margins) to help correct for random brain shifts from opening the dura. For most cases, a neuroradiologist was present at surgery, and when necessary, the tissue-sample location was determined by consensus between the neuroradiologist and the neurosurgeon, though neither had knowledge of DSC−MR imaging measurements at the time of tissue collection. The neurosurgeon also avoided sampling from central necrotic fluid regions that would complicate accurate stereotactic localization. We also recognize that image distortion can reduce coregistration accuracy.22 To help reduce geometric distortions, we coregistered stereotactic and DSC datasets by using a rigid-body algorithm. Taking all of these issues into account, our experience suggests that the misregistration error is similar to that in methods using stereotactic needle biopsy (∼1–2 mm).23 We also recognize limitations due to susceptibility effects, particularly at high field strengths and at the skull base, which would prevent analysis of specific regions due to poor image quality.2
The entity “pseudoprogression” has been introduced in recent literature and describes how posttreatment reactive changes, typically resulting from a combination of radiation therapy and temozolomide, can mimic tumor recurrence primarily radiographically and clinically within months following treatment.24 Histopathologic diagnosis remains the criterion standard in these patients, though accurate diagnosis can be difficult in some cases.24 Specific histopathologic diagnostic criteria that can help improve accuracy were used in this study.24,25 Nonetheless, we recognize that diagnostic criterion standards are not completely accurate and thus present a possible limitation to this study.
Conclusions
rCBV accuracy in posttreatment gliomas depends on PLD amount and incubation time to minimize T1-weighted leakage effects as well as the presence of BLS correction to overcome T2/T2*WI residual effects. Combining the 2 methods significantly improves rCBV correlation with histopathology and enables highly accurate differentiation of PTRE and tumor growth.
Acknowledgments
We thank Mary Harrigan, Scott Beeman, Mike Purcell, and Brian Lenoski for their assistance. We also thank Zerrin Yetkin, MD, for her guidance and thoughtful discussions regarding this topic. We also appreciate the support of the Barrow Neurological Institute (BNI) Tumor Board, BNI patients, and their family members.
Footnotes
-
This work was supported in part by the Barrow Neurological Foundation, Phoenix, Arizona, Bruce T. Halle Family Foundation, and Arizona Biomedical Research Commission.
-
Paper previously presented in part at: 16th Scientific Meeting and Exhibition of the International Society for Magnetic Resonance in Medicine, May 3–9, 2009; Toronto, Ontario, Canada.
References
- Received May 6, 2009.
- Accepted after revision June 10, 2009.
- Copyright © American Society of Neuroradiology
In this issue


Jump to section
Related Articles
Cited By...
- Identification of a Single-Dose, Low-Flip-Angle-Based CBV Threshold for Fractional Tumor Burden Mapping in Recurrent Glioblastoma
- Arterial Spin-Labeling and DSC Perfusion Metrics Improve Agreement in Neuroradiologists Clinical Interpretations of Posttreatment High-Grade Glioma Surveillance MR Imaging--An Institutional Experience
- Presurgical Identification of Primary Central Nervous System Lymphoma with Normalized Time-Intensity Curve: A Pilot Study of a New Method to Analyze DSC-PWI
- Performance of Standardized Relative CBV for Quantifying Regional Histologic Tumor Burden in Recurrent High-Grade Glioma: Comparison against Normalized Relative CBV Using Image-Localized Stereotactic Biopsies
- Perfusion MRI-Based Fractional Tumor Burden Differentiates between Tumor and Treatment Effect in Recurrent Glioblastomas and Informs Clinical Decision-Making
- Moving Toward a Consensus DSC-MRI Protocol: Validation of a Low-Flip Angle Single-Dose Option as a Reference Standard for Brain Tumors
- Optimization of Acquisition and Analysis Methods for Clinical Dynamic Susceptibility Contrast MRI Using a Population-Based Digital Reference Object
- Effects of MRI Protocol Parameters, Preload Injection Dose, Fractionation Strategies, and Leakage Correction Algorithms on the Fidelity of Dynamic-Susceptibility Contrast MRI Estimates of Relative Cerebral Blood Volume in Gliomas
- MRI Evaluation of Non-Necrotic T2-Hyperintense Foci in Pediatric Diffuse Intrinsic Pontine Glioma
- Contrast Leakage Patterns from Dynamic Susceptibility Contrast Perfusion MRI in the Grading of Primary Pediatric Brain Tumors
- Comparison of the Effect of Vessel Size Imaging and Cerebral Blood Volume Derived from Perfusion MR Imaging on Glioma Grading
- The Added Prognostic Value of Preoperative Dynamic Contrast-Enhanced MRI Histogram Analysis in Patients with Glioblastoma: Analysis of Overall and Progression-Free Survival
- Impact of Software Modeling on the Accuracy of Perfusion MRI in Glioma
- Repeatability of Standardized and Normalized Relative CBV in Patients with Newly Diagnosed Glioblastoma
- ASFNR Recommendations for Clinical Performance of MR Dynamic Susceptibility Contrast Perfusion Imaging of the Brain
- Bayesian Estimation of Cerebral Perfusion Using Reduced-Contrast-Dose Dynamic Susceptibility Contrast Perfusion at 3T
- Comparison of 18F-FET PET and Perfusion-Weighted MR Imaging: A PET/MR Imaging Hybrid Study in Patients with Brain Tumors
- Arterial Spin-Labeling Assessment of Normalized Vascular Intratumoral Signal Intensity as a Predictor of Histologic Grade of Astrocytic Neoplasms
- Diagnostic Accuracy of Dynamic Contrast-Enhanced MR Imaging Using a Phase-Derived Vascular Input Function in the Preoperative Grading of Gliomas
- The Role of Preload and Leakage Correction in Gadolinium-Based Cerebral Blood Volume Estimation Determined by Comparison with MION as a Criterion Standard
- Correlations between Perfusion MR Imaging Cerebral Blood Volume, Microvessel Quantification, and Clinical Outcome Using Stereotactic Analysis in Recurrent High-Grade Glioma
- Multimodality Assessment of Brain Tumors and Tumor Recurrence