
Abstract
BACKGROUND AND PURPOSE: The accurate delineation of tumor recurrence presents a significant problem in neuro-oncology. Our aim was to improve the identification of brain tumor recurrence from chemoradiation injury by using CE-SWI, a technique that provides improved visualization of the heterogeneous patterns of brain tumor pathology, to guide the analysis of ADC measures within the peritumoral territory.
MATERIALS AND METHODS: Seventeen patients who were being treated for high-grade glial neoplasms took part in the study. All patients presented with new enhancing lesions on follow-up CE-T1. Recurrence or chemoradiation injury was confirmed from either histologic analysis or extensive clinical follow-up. Regions of enhancement on registered CE-SWI and CE-T1 images were extracted in a semiautomated fashion and transferred to coregistered ADC maps. Significant differences in ADC measures defined within the enhancement volumes on serial MR images were analyzed by using a nonparametric Kolmogorov-Smirnov approach and correlated with clinical follow-up diagnoses.
RESULTS: Analysis of the serial data revealed that patients with a diagnosis of tumor recurrence had significantly reduced ADC measures within the enhancement volume delineated on CE-SWI. In contrast, patients with SD had significantly elevated ADC within the CE-SWI enhancement volume.
CONCLUSIONS: The findings of an increase in enhancement volume delineated on serial CE-SWI maps, along with a concomitant reduction in ADC within this volume for patients with recurrent tumor, provide support for such an approach to be used to assist in follow-up patient management strategies.
Abbreviations
- ADC
- apparent diffusion coefficient
- BBB
- blood-brain barrier
- CE-SWI
- contrast-enhanced susceptibility-weighted imaging
- CE-T1
- contrast-enhanced T1-weighted imaging
- FMRIB
- Functional Magnetic Resonance Imaging of the Brain
- GBM
- glioblastoma multiforme
- MRI
- MR imaging
- No E
- no constant enhancement
- Pseudo
- evidence of a secondary pseudoprogressive lesion
- RT
- recurrent tumor
- SD
- stable disease
- SWI
- susceptibility-weighted imaging
- Vol
- volume
- WHO
- World Health Organization
Advances in understanding cancer cell proliferation, combined with the introduction of new drugs, improvement in the delivery of radiation therapy, and neurosurgical techniques, now make it possible for primary brain tumors to be treated more rationally. Despite these advances, the 1-year mortality rate for high-grade tumors is approximately 80%. A factor contributing to poor outcomes is the limitation of current neuroimaging strategies to reliably identify tumor recurrence from chemoradiation therapy−induced injury. This problem is further exacerbated by the introduction of adjuvant temozolomide radiation therapy, the new standard of care for patients with glioblastoma multiforme, which can result in formation of asymptomatic pseudoprogressive lesions and increased necrosis within the peritumoral territory.1 Such treatment-related pathologic changes impede accurate identification of potential tumor recurrence, hindering optimized planning of appropriately targeted primary or salvage therapies.
Diffusion–weighted MR imaging by using quantitative summary measures such as the ADC, which probes altered water mobility in brain tissue, has shown potential for distinguishing tumor regrowth from radiation injury.2–4 Although there is overlap in the reported findings regarding reduced ADC measures associated with increased cellularity and recurrent tumor,2,3 overall these studies highlight the fundamental complexity of attempting to relate a single ADC measure to the dynamically evolving pathologic processes present at various stages after treatment. Furthermore, the evaluation of ADC values is dependent on the sampling method—for example, whether vascular components and regions of necrosis are included or excluded from the analysis of the peritumoral territory.5 This is a confounding factor because ADC measures are often evaluated from regions of enhancement present on post-CE-T1, which has a poor specificity for distinguishing such pathologic features.
Recently, SWI has enabled visualization of the heterogeneous patterns of tissue pathology present within brain tumors, which is not possible by using conventional CE-T1.6–8 Moreover, CE-SWI has shown improved conspicuity of susceptibility effects, providing clinically useful information about altered tumor microvascularity, the degree of intratumoral necrosis, and the presence of subtle defects of the BBB within the surrounding parenchymal tissue.9,10 The inherent ability of CE-SWI to distinguish such pathologic features provides a novel mechanism for evaluating ADC measures within parenchymal tissue with abnormal BBB function. Such regions are of considerable interest because recurrent tumor often occurs within this peritumoral territory.
In this study, we investigated whether serial ADC measures from such regions would provide more accurate identification of the evolutionary pathologic processes associated with recurrent tumor or chemoradiation injury. To explore this hypothesis, we measured ADC profiles within the enhancing regions delineated on both CE-T1 and CE-SWI maps acquired from patients who were being treated for high-grade primary brain tumors, by using a semiautomated segmentation strategy. We targeted patients who presented with new enhancing lesions as part of their continued assessment. The accuracy of CE-SWI−guided ADC measures for detecting recurrent tumor was validated with either open biopsy or follow-up imaging and clinical assessment.
Materials and Methods
Patients
Seventeen patients (8 men, 9 women) who were being treated for high-grade (WHO grade III or IV) glial neoplasms took part in the study. The institutional review board approved the study, and informed consent was obtained from each participant. All patients had previously undergone surgical resection with chemoradiotherapy and had presented with new enhancing lesions on follow-up CE-T1. When possible, tumor recurrence was confirmed from histologic analysis (n = 5, with 1 patient deceased). Where biopsy was not possible, tumor recurrence was defined as a steady increase in CE-T1 enhancement and mass effect despite steroid therapy, in combination with deteriorating neurologic symptoms. Nonrecurrence was defined on imaging as stable or resolving regions of enhancement for at least 6 months, accompanied by neurologic improvement during the follow-up period.2,3 Because we cannot absolutely confirm nonrecurrence without histologic findings, in this study, we use the terminology SD for these patients. Patients in the RT group were receiving adjuvant temozolomide therapy before the acquisition of the imaging data. One patient (patient 9) received antiangiogenic treatment with bevacizumab. The time duration between completion of therapy and data acquisition is given in Table 1. Biopsy samples were obtained after the acquisition of imaging data to assist in new treatment-planning strategies for these patients.
Patient demographics, diagnosis, and clinical course
MR Imaging
All MR imaging examinations were performed by using either a 1.5T Avanto or 3T Magnetom Trio scanner (Siemens, Erlangen, Germany), with a 12-channel-array head coil. In most cases, patients underwent their serial scanning with the same imaging platform. Along with a number of conventional sequences, T1-weighted images were acquired before and after intravenous administration of gadopentetate dimeglumine (Magnevist, Schering, Berlin, Germany) by using the following parameters: TR/TE, 500/11 and 600/7.4 ms for 1.5 and 3T, respectively, with an image resolution of 0.45 × 0.45 × 5 mm. The SWI data were acquired by using a 3D fully velocity-compensated (gradient moment nulling in all 3 orthogonal directions) gradient-echo sequence with the following sequence parameters: TR/TE, 49/40 and 27/20 ms for 1.5 and 3T scanners, respectively. The image resolution was 1.1 × 0.9 × 2 mm. Diffusion-weighted images were acquired in the axial plane by using a spin-echo echo-planar sequence with diffusion gradient encoding in 3 orthogonal directions. The sequence parameters used were the following: TR/TE, 3900/84 and 4500/91 ms, respectively, for the 1.5 and 3T scanners, with 5 averages and a maximum b-value of 1000 s/mm2. The image resolution was 1.1 × 1.1 × 5 mm. The diffusion scan was acquired before administration of the contrast agent.
Image Processing and Analysis
A number of fully validated image-processing software tools from the University of Oxford FMRIB Centre software library (Version 4.0, http://www.fmrib.ox.ac.uk/10years/brochure/page-4) were used in this study. To enable measurement of ADC values from hyperintense regions present on CE-T1 and CE-SWI maps, we first registered all serial images to the same image space. This registration was achieved by using the Linear Image Registration Tool11 by applying an affine transformation to ensure that all images (CE-T1 and ADC) were registered into the same image space and resolution as the CE-SWI map. To aid automated segmentation of the enhancement volume, we then removed the skull by using the FMRIB Brain-Extraction Tool.12 Extraction of the enhancement CE-T1 and CE-SWI volumes was achieved by using the Automated Segmentation Tool in FMRIB with a 3-class segmentation model. Any extracted enhancement regions on the CE-T1 and CE-SWI maps that were found to anatomically lie outside of the boundary of the hyperintense region visible on the corresponding fluid-attenuated inversion recovery images were manually edited. This procedure enabled generation of CE-T1 and CE-SWI enhancement masks, which more accurately represented tissue with perturbed BBB within the peritumoral territory. For each mask, possible exclusion of regions corresponding to paradoxical signal-intensity loss due to T2* effects that can result after administration of contrast agent was carefully assessed by the visual inspection of the CE phase maps.6
Hyperintense regions present on precontrast T1 images were manually removed from the extracted CE-T1 enhancement masks. The segmented masks that best fitted the hyperintense regions present on CE-T1 and CE-SWI maps were then directly transformed onto coregistered ADC images for evaluation, to enable statistical analysis of ADC values for all pixels within these enhancement masks with time. Because the ADC measures were not normally distributed within the enhancement masks, we used a nonparametric analytic approach with a Kolmogorov-Smirnov test to determine whether there was any significant difference in ADC measures contained within the enhancement masks between each serial imaging time point for each participant. For purposes of data tabulation, median ADC values were calculated for each enhancement mask. The difference between the CE-T1 and CE-SWI enhancement volumes was assessed by using a paired t test.
Results
Patient demographics and information describing initial diagnosis and clinical course are given in Table 1. Enhancement volumes derived from CE-T1 and CE-SWI maps, in addition to ADC summary measures, are presented in Table 2. When comparing the enhancement volumes, we found a significant reduction in the volume of the CE-SWI−derived mask compared with the CE-T1 mask for both time points (P = .002 and P = .004, respectively). Despite a difference in enhancement volume, compared for all patients, there was no significant difference in the median ADC values between the CE-T1 or CE-SWI enhancement masks. Representative images for a patient with recurrent tumor, showing a reduction in volume of the CE-SWI mask compared with the CE-T1 enhancement region, are given in Fig 1. In this example, hypointense regions visible on the CE-SWI map that reflect areas of necrosis and vascular structures10 anatomically correlate with hyperintense areas observed on the corresponding CE-T1. Measurement of ADC values from within the CE-T1 enhancement mask in this case would be elevated due to the presence of necrosis that would possibly mask subtle changes in ADC reflecting tumor regrowth or radiation injury.

A−C, Representative images from a patient with recurrent GBM: CE-T1 (A), CE-SWI (B), and ADC maps (C). D−F, Automatically defined enhancement masks are overlaid on the corresponding maps seen in the top row. Note the regions of nonspecific BBB leakage within the CE-T1 mask, which correlate to areas of necrosis and vascular structures on the SWI maps (arrow).
Lesion volumes and ADC measuresa
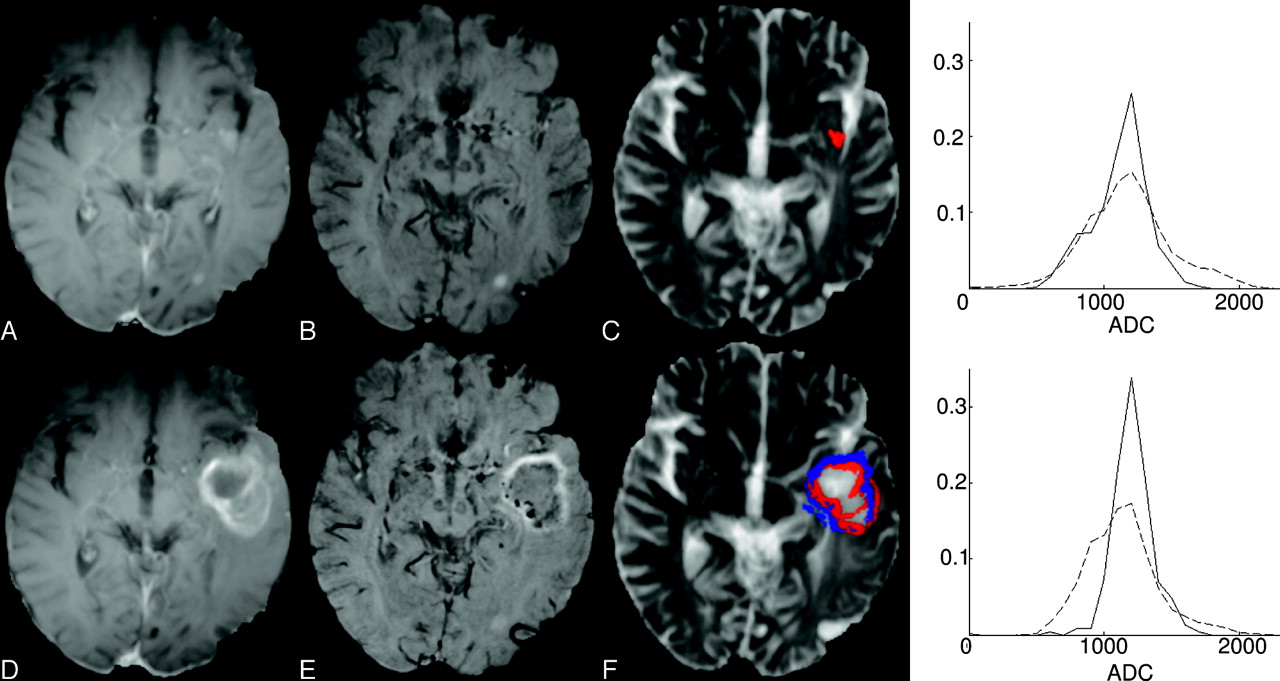
Of the 11 participants with clinical features associated with tumor recurrence, 10/11 had significantly reduced ADC measures within the CE-SWI enhancement mask. Five of 11 had biopsy-confirmed tumor regrowth. In comparison with the CE-SWI findings, 3/11 patients had significantly reduced ADC measures and 4/11 patients had significantly increased ADC within their respective CE-T1 enhancement masks. Figure 2 shows imaging data for a patient with recurrent tumor. There is a significant increase in enhancement volume depicted on the follow-up scans for both the CE-T1 and CE-SWI maps. The frequency plot derived from the CE-SWI enhancement mask shows a shift toward a reduction in ADC values with evolution of recurrent tumor pathology. In contrast, the CE-T1−derived frequency plot reveals a significant increase in ADC measures. Of the 10 tumor-recurrent patients with significantly reduced ADC measures, 7/10 patients had a significant increase in enhancement volumes of follow-up CE-T1 and CE-SWI scans.

Representative CE-T1 (A and D), CE-SWI (B and E), ADC maps (C and F), and ADC frequency plots for patient 14, with a biopsy-defined recurrent anaplastic oligoastrocytoma. The top frequency plot presents ADC values found within the CE-T1 enhancement mask (red), while the bottom plot shows ADC values contained within the CE-SWI mask (blue). Images on the top row correspond to the initial time point, while those on the bottom row show the follow-up scans. For the ADC frequency plots, the continuous line corresponds to data acquired at the initial time point, while the dashed line is from the follow-up data. These combined data highlight the correlation between an increase in enhancement volume (for both T1 and SWI) with a significant reduction in ADC value within the CE-SWI enhancement mask for recurrent tumor. Most interesting, there is an apparent increase in ADC within the CE-T1 enhancement mask, possibly reflecting the inclusion of necrosis within the ADC analysis.
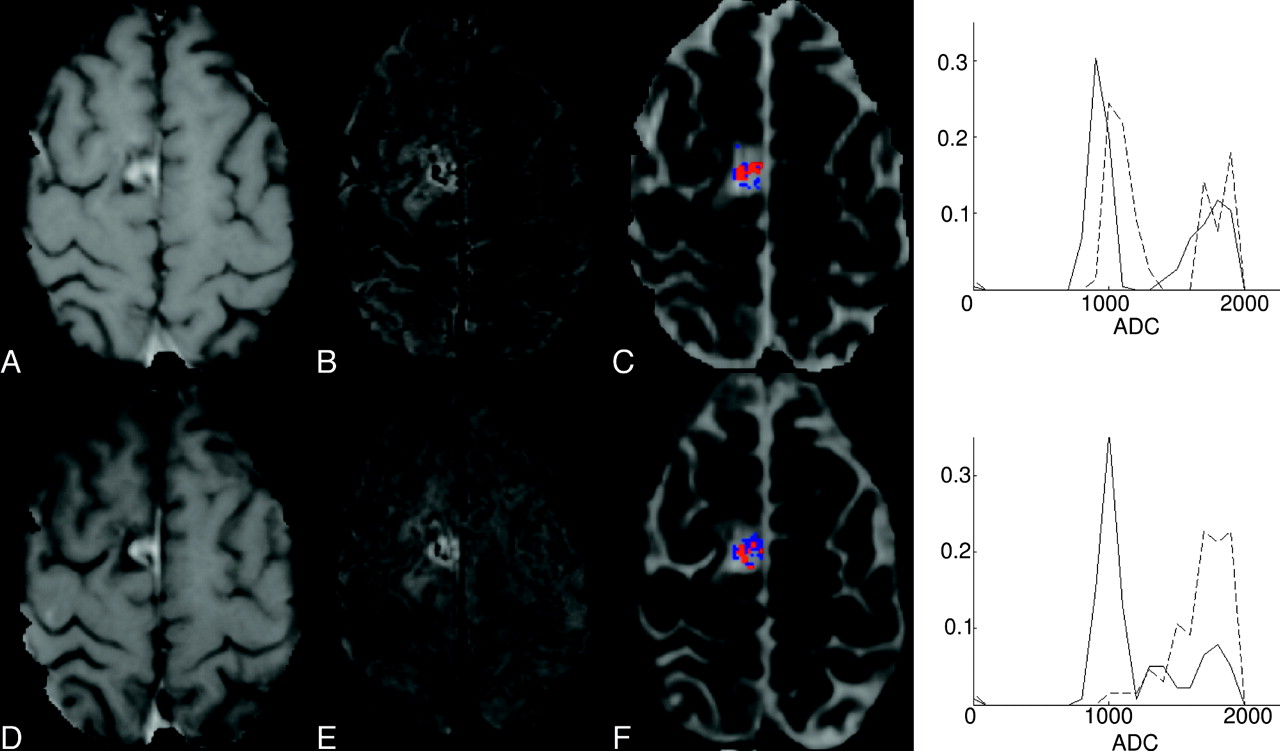
Of the 6 patients with clinical features most likely associated with chemoradiation injury (SD), 5/6 had significantly elevated ADC measures within the CE-SWI−enhancement mask. Two of these patients had an increase in the CE-SWI−derived enhancement region. In contrast, 4 patients presented with significantly increased ADC values within the CE-T1−defined enhancement mask. Frequency plots along with representative images for a patient with SD are shown in Fig 3. The CE-SWI-enhancement−derived frequency plot highlights a significant increase in the ADC measure after treatment for this patient compared with the CE-T1 enhancement region. Only 1 patient presented with a pattern of signal-intensity enhancement on CE-T1 with no detectable enhancement visible on the corresponding CE-SWI map at either of the follow-up time points.

Representative CE-T1 (A and D), CE-SWI (B and E), ADC maps (C and F), and ADC frequency graphs for patient 10 with SD most likely associated with radiation-chemotherapy−induced changes. The top frequency plot presents ADC values found within the CE-T1 enhancement mask (red), while the bottom plot shows ADC values contained within the CE-SWI mask (blue). Images on the top row correspond to the initial time point, while those on the bottom row show the follow-up scans. For the ADC frequency plots, the continuous line corresponds to data acquired at the initial time point, while the dashed line is from the follow-up data. For this patient, there is little change in enhancement volume between time points, but a significant increase in ADC values within the CE-SWI enhancement mask. Follow-up scans revealed no further increase in enhancement volume (data not shown). This pattern of change may represent radiation injury within the perilesional boundary.
Discussion
In this preliminary study, we report, for the first time, the use of CE-SWI to guide the assessment of ADC measures. Such a strategy enables evaluation of ADC indices within parenchymal tissue exhibiting enhancement after contrast administration, excluding regions that may anatomically correlate to vascular compartments containing blood products and areas of necrosis. In patients with high-grade primary brain tumors that present with new enhancing lesions, we found that an increase in CE-SWI enhancement volume along with a concomitant reduction in ADC within this region is a marker of tumor recurrence. This finding was consistent in 10 of 11 patients with either biopsy or clinical-imaging follow-up diagnosis of recurrent tumor. In contrast, all 6 patients with SD, most likely associated with a diagnosis of chemoradiation injury, had significantly elevated ADC measures with enhancing lesions on CE-SWI. CE-SWI maps were not used to stratify patients into recurrent or SD subgroups. This was achieved by using conventional MR imaging and clinical work-up procedures.
The finding of a reduction in ADC measures in areas of tumor recurrence corroborates results from previous studies.2,3 Furthermore, a number of preclinical and clinical studies have reported a significant inverse correlation between ADC measures and tumor cellularity.13–16 Although a recent study found no relationship between ADC measures and cell attenuation on stereotactic biopsies, a significant correlation was found for microvessel attenuation, a surrogate marker for proliferating cellular activity.17 The study published by Sundgren et al4 reported an increase in ADC measures associated with tumor recurrence. This discrepancy may be explained by the longer follow-up period between identification of new enhancing lesions and the acquisition of imaging data (average of >20 months). At this duration, posttreatment enhancing lesions observed on CE-T1 MR imaging may contain regions of additional necrosis, which would elevate ADC measures. The use of a CE-SWI−guided ADC analysis has the potential to circumvent this confounding problem. However, 1 patient in our study (patient 9) who had biopsy-confirmed tumor recurrence had significantly increased ADC measures within the CE-SWI enhancement mask. The histology report for this patient revealed the presence of significant micronecrosis albeit with some infiltrating tumor cells. The finding of extensive micronecrosis may help explain the elevated ADC measures, but at this stage, we cannot speculate whether the ADC value would decrease on subsequent MR imaging.
This finding also highlights the problem of dichotomizing patients into either RT or SD. In many cases, the peritumoral territory will contain mixed pathology (ie, both chemoradiation injury and possible recurrent tumor). However, in this preliminary study, with any evidence of infiltrating tumor cells within the histology sample, the patient was classified as having recurrent tumor. At this stage, we have not correlated ADC measures with the extent or number of proliferating tumor cells within the biopsied tissue.
A wide range of ADC values was measured within the CE-SWI−derived enhancement mask that corresponded to tumor regrowth (960–1560 s/mm2). Such a finding is not surprising given the heterogeneous pathology associated with the various primary brain tumors included in this study and, most important, the variation in the scanning follow-up period between identification of a new enhancing lesion and data acquisition. For these reasons, including dichotomizing patients into either RT or SD, we think that a single threshold ADC value that can accurately distinguish recurrent tumor from radiation injury is unlikely and that more clinically useful information regarding treatment progression and outcome can be gained from serial MR imaging evaluations. We observed significant changes in CE-SWI−guided ADC measures within a 2-month monitoring period. Such a timeframe fits well with current practice regarding 2–3 monthly follow-up imagings posttreatment.
There are a number of limitations associated with this study. The precise histologic correlate of increased signal intensity detected on postcontrast SWI is not yet well-defined. However, a number of preliminary studies with histologic reference by using SWI without contrast have reported the improved delineation of the tumor margins and detection of intratumoral venous vasculature and hemorrhage.6–10 Most important, a recent study reported improved conspicuity of susceptibility effects and image quality within the peritumoral territory by using CE-SWI, highlighting the clinical utility of this method for measuring contrast enhancement (ie, BBB leakage) and intralesional susceptibility effects (ie, necrosis) in the 1 imaging sequence.9 Such findings give support for the concept of measuring ADC values within enhancement regions on CE-SWI maps for monitoring pathologic changes within this territory.
One patient with SD in our study (patient 7) presented with signal-intensity enhancement on CE-T1 MR imaging, without any regions of hyperintensity detectable on CE-SWI maps. Investigation of the corresponding phase image revealed no aliasing artifacts.6 On the CE-T1, the enhancement was constrained to the rim of the site of the initial tumor resection and was most likely associated with surgical injury to the endothelium of vessels within this region. Although the clinical manifestation of the CE-SWI finding is unclear, further work is required to fully understand the relationship between histology and signal-intensity enhancement on CE-SWI. We have used CE-SWI maps to identify regions of necrosis and parenchymal tissue with compromised BBB function. Regions of necrosis would elevate ADC measures and potentially mask pathologic changes associated with tumor regrowth. Using enhancement masks derived from CE-SWI maps may include some vascular regions also exhibiting signal-intensity enhancement. Currently, our approach does not differentiate this possibility. However, careful analysis of pre- and postcontrast SWI data would provide more accurate parenchymal masks.
Other limitations are the small number of patients in this study, the difficulty of obtaining histologic confirmation of pathology for every case, and the difference in duration between diagnosis and time of follow-up imaging between the RT and SD patient groups. Patients with a potential diagnosis of chemoradiation injury do not routinely have follow-up biopsy procedures. Likewise, patients with possible recurrent tumor may have follow-up surgery; however, histologic results are not anatomically specific because they are often derived from large biopsy tissue samples containing mixed pathology. Clearly, additional studies are needed to confirm the use of CE-SWI−guided ADC measures for detecting recurrence–chemoradition injury, which include detailed stereotactic biopsy analysis.
Conclusions
In this preliminary study, we found evidence of a correlation between increased enhancement volumes on serial CE-SWI maps along with a concomitant reduction in ADC levels within the enhancement mask in patients with tumor recurrence compared with those presenting with SD.
References
- Received September 23, 2009.
- Accepted after revision November 23, 2009.
- Copyright © American Society of Neuroradiology
In this issue


Jump to section
Related Articles
Cited By...
- Utility of Intravoxel Incoherent Motion MR Imaging for Distinguishing Recurrent Metastatic Tumor from Treatment Effect following Gamma Knife Radiosurgery: Initial Experience
- Histogram Analysis of Intravoxel Incoherent Motion for Differentiating Recurrent Tumor from Treatment Effect in Patients with Glioblastoma: Initial Clinical Experience