
Abstract
BACKGROUND AND PURPOSE: Currently it is difficult to predict tumor response to anti-angiogenic therapy in individual patients. Our aim was to determine if ADC histogram analysis can stratify progression-free and overall survival in patients with newly diagnosed GBM treated “up-front” (ie, before tumor recurrence) with bevacizumab.
MATERIALS AND METHODS: Up-front bevacizumab-treated and control patients (n = 59 and 62, respectively) with newly diagnosed GBM were analyzed by using an ADC histogram approach based on enhancing tumor. Progression-free and overall survival was determined by using Cox proportional HRs and the Kaplan-Meier method with logrank and Wilcoxon tests.
RESULTS: For up-front bevacizumab-treated patients, lower ADCL was associated with significantly longer progression-free survival (median, 459 days for ADCL < 1200 versus 315 days for ADCL ≥ 1200 10−6mm2/s; P = .008, logrank test) and trended with longer overall survival (581 versus 429 days, P = .055). ADC values did not stratify progression-free or overall survival for patients in the control group (P = .92 and P = .22, respectively). Tumors with MGMT promoter methylation had lower ADCL values than unmethylated tumors (mean, 1071 versus 1183 10−6mm2/s; P = .01, 2-group t test).
CONCLUSIONS: Pretreatment ADC histogram analysis can stratify progression-free survival in bevacizumab-treated patients with newly diagnosed GBM. Lower ADC is associated with tumor MGMT promoter methylation, which may, in part, account for the favorable outcome associated with low ADCL tumors.
Abbreviations
- ADC
- apparent diffusion coefficient
- ADCL
- mean ADC (10−6mm2/s) of the lower curve from the histogram analysis
- FLAIR
- fluid-attenuated inversion recovery
- G
- gross total resection
- GBM
- glioblastoma
- HR
- hazard ratio
- KPS
- Karnofsky Performance Status
- M
- methylated
- MGMT
- O6-methylguanine-DNA-methyltransferase
- N
- no tissue available
- RPA
- recursive partitioning analysis
- S
- subtotal resection and biopsy
- U
- unmethylated
- VEGF
- vascular endothelial growth factor
GBMs are the most aggressive and lethal primary brain tumors; they secrete high levels of VEGF.1 VEGF increases cerebrovascular permeability and promotes tumor progression.2 VEGF is thought to be key to the “angiogenic switch,” which is hypothesized to promote new blood vessel formation and transform tumors into a more aggressive phenotype.3 Bevacizumab (Avastin) is a nonselective monoclonal antibody to VEGF and, when compared with historical controls, improves survival for patients with recurrent GBM.4,5 Conversely, bevacizumab treatment appears to be ineffective at extending overall survival for patients with GBM when used “up-front,”—that is, before recurrence—though it does extend progression-free survival in this setting as well.6 Treatment with bevacizumab results in diminished enhancement and edema, apparently related to inhibition of vessel permeability by VEGF.7 Reduced enhancement following bevacizumab therapy has been referred to as a “pseudoresponse” because the reduction in enhancement can be secondary to an antipermeability effect rather than a product of diminished tumor bulk.8,9 Conversely, treatment with radiation and temozolomide is associated with increased “pseudoprogression”: increased areas of enhancement that subsequently diminish or resolve spontaneously.10,11 The antipermeability effect of bevacizumab is thought to diminish radiation change10 but also could act to diminish delivery of drugs to tumor tissue, due to recovery of the blood-brain barrier.12
Epigenetic silencing of the DNA repair enzyme MGMT is one of the most important prognostic and predictive biomarkers associated with better outcomes as well as susceptibility to temozolomide therapy.13 MGMT promoter methylation can change following tumor resection and chemotherapy.14 Loss of methylation is associated with resistance to temozolomide therapy.15 Therefore, it would be useful to have a noninvasive surrogate of this marker. Recently, it has been proposed that certain MR imaging features, such as ring enhancement, are associated with MGMT promoter methylation status.16 The relationship between physiologic imaging biomarkers such as diffusion, typically measured in terms of the ADC, and MGMT promoter methylation status has not been reported, to our knowledge. ADC is lowered by increased cell attenuation but increased in association with vasogenic edema and necrosis.17 Edema and necrosis also are associated with higher levels of VEGF.18 ADC histogram analysis has been used to predict response to bevacizumab in patients with recurrent GBM,19 and minimum ADC values have been found to be prognostic of outcomes in gliomas.20,21 In the current work, we assessed the ability of ADC histogram analysis to stratify survival in patients with GBM treated up-front with bevacizumab and investigated whether the prognostic utility of ADC is related to MGMT promoter methylation status.
Materials and Methods
Patients
All patients enrolled in this retrospective study signed institutional review board−approved informed consent agreeing to participate in a study correlating image analysis with clinical outcome. Data acquisition was performed in compliance with all applicable Health Insurance Portability and Accountability Act regulations. Most patients were part of the AVF3770 study,6 and some additional patients were acquired from the neuro-oncology data base of our institution on the basis of the selection criteria below. The study spanned April 2005 to November 2008. We analyzed 2 groups of patients. The first group (n = 59) received external beam regional radiation (6000 ± 200 cGy) started within 3–6 weeks after maximal tumor resection, concurrent with temozolomide and bevacizumab therapy. The second group of patients (control group, n = 62), received the same treatment except that bevacizumab was not given before tumor recurrence. However, on recurrence (n = 55), 34 patients (62%) in the control group were then treated with bevacizumab-containing regimens. Bevacizumab was given 2 weeks per cycle (10 mg/kg body weight). All patients met the following criteria: 1) pathology-confirmed GBM, 2) baseline (presurgical) MR imaging scan that included diffusion-weighted images, 3) minimum 1-year clinical follow-up, 4) age ≥18 years, and 5) KPS ≥ 60. Follow-up scans were obtained at approximately 4- to 6-week intervals. Steroid doses for patients at the time of initial scanning were not available in most cases. At the time of last assessment (January 2010), 112 of the 121 patients (93%) had progressed and 85 of 121 patients (70%) had died (38/59, 64%, for the up-front bevacizumab group and 47/62, 76%, for the control cohort).
Imaging
MR imaging was performed on a 1.5T scanner and typically included axial T1-weighted (TR, 400 ms; TE, 15 ms; section thickness, 5 mm), T2-weighted fast spin-echo (TR, 4000 ms; TE, 126–130 ms; section thickness, 5 mm), FLAIR (TR, 8802 ms; TE, 122 ms; TI, 2100 ms; section thickness, 3 mm), and diffusion-weighted and gadopentetate dimeglumine−enhanced (Magnevist, Berlex Laboratories, Wayne, New Jersey; 0.1 mmol/kg) axial and coronal T1-weighted images (TR, 400 ms; TE, 15 ms; section thickness, 3 mm) with an FOV of 24 cm and a matrix size of 256 × 256. Postcontrast images were acquired immediately following contrast injection. Diffusion images used a section thickness of 3–5 mm, FOV of 24 cm, and matrix size of 256 × 256 for most patients. Most patients were scanned with a 1.5T Signa Horizon MR imaging unit (GE Healthcare, Milwaukee, Wisconsin) by using the standard diffusion-weighted imaging pulse sequence supplied by the scanner manufacturer. This pulse sequence includes 1 image acquisition at b=0 s/mm2 and 3 diffusion-weighted acquisitions using b=1000 s/mm2.
Volume Acquisition/ADC Histograms
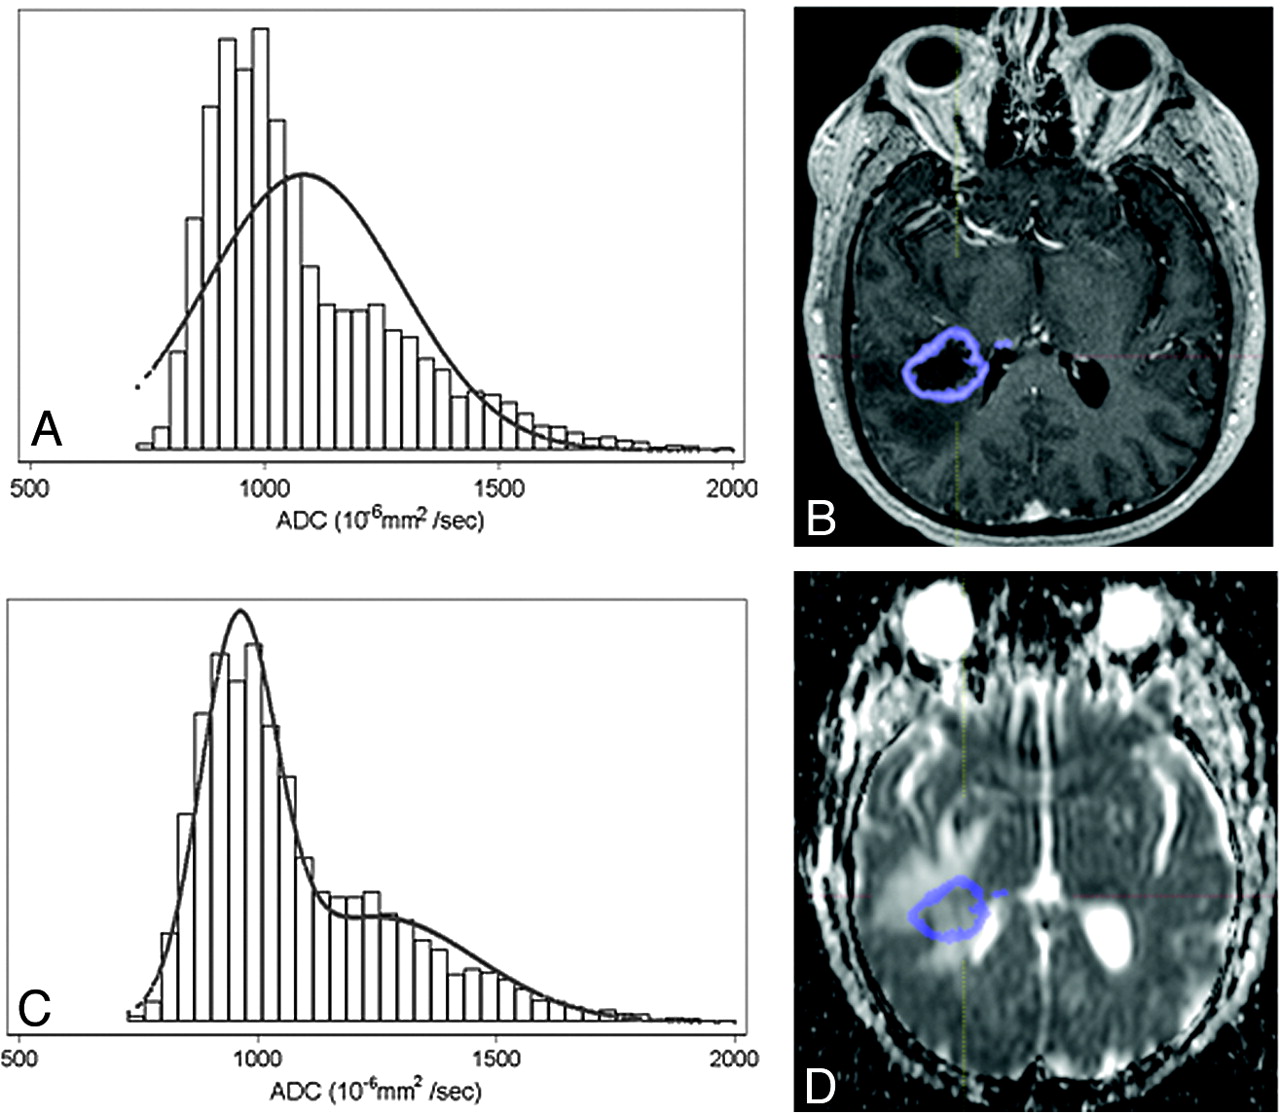
Enhancing tumor volumes were segmented on postcontrast T1-weighted images on presurgical scans by using a semiautomated adaptive thresholding technique so that all pixels above the threshold value were selected (Fig 1).22 Therefore, significant regions of macroscopic necrosis that were not enhancing as well as cystic areas were excluded. The resulting regions of interest encompassing the entire enhancing tumor volume were verified by a board-certified neuroradiologist (W.B.P., with 6 years of experience) who was blinded to clinical outcome, and they were mapped to the ADC images. ADC values calculated on a pixel-by-pixel basis for the entire enhancing volume were used for histogram analysis and expressed in units of 10−6mm2/s. ADC histograms were processed by using a 2-mixture normal distribution to provide optimal curve-fitting as previously described.19 Mean values for the lower peak (ADCL) were then generated, and tumors were dichotomized by using a cutoff for mean ADCL of 1200 based on prior work.19 Tumors with mean ADCL < 1200 10−6mm2/s are referred to as “low ADC tumors,” whereas tumors with mean ADCL ≥ 1200 10−6mm2/s are referred to as “high ADC tumors” (Fig 2 ).

Example of a semiautomated adaptive thresholding technique to segment enhancing tumor volumes on postcontrast MR imaging of the brain. A, A screenshot shows a line (green), which is manually drawn from inside the tumor (in this case a GBM at initial presentation) to the surrounding area. B, All enhancing voxels are then automatically selected and overlaid in blue. This is the same section as A but magnified for clarity. This single manipulation selects enhancing voxels not only on the current section but also on all sections in which contiguous enhancing tumor is present. C and D, Additional contiguous sections that are automatically contoured at the same time.

ADC histogram and curve-fitting generated from enhancing tumor volume. Unimodal (A) and bimodal (C) normal curve-fitted histograms generated from an MR imaging axial post-contrast image (B) fused to the corresponding ADC map (D) in an untreated patient with GBM. Note improvement in curve-fitting with the bimodal distribution (C) compared with unimodal curve (A).
Methylation Status
Methylation status was available for 89 patients and was determined from formalin-fixed paraffin-embedded tissue samples, as previously described.23
Determination of Tumor Progression
Progression-free survival from the time of tumor resection was determined on the basis of the modified Macdonald criteria, in which nonenhancing tumor growth was also considered evidence of tumor progression as advocated by the Response Assessment in Neuro-Oncology Working Group.8,24 Specifically, to increase sensitivity for nonenhancing tumor progression, 2 reviewers (W.B.P. and A.L.) retrospectively assessed the MR imaging and backdated the time of progression to the earliest convincing worsening of FLAIR signal-intensity change compatible with nonenhancing tumor (this was done after the ADC histograms were generated to prevent unblinding of the reviewers). Discrepancies were resolved by consensus of the 2 readers. The main purpose of this retrospective method was to attempt not to have increased progression-free survival due to failure to recognize progression (particularly nonenhancing progression) in the context of anti-VEGF inhibition. Comparing the investigator-called date of progression with that from the radiographic review, we found only 9 of 59 (15%) patients who had a discrepancy, all of which were called “radiographic progression” before that called by the investigator. Similarly, to decrease the chance that pseudoprogression would be characterized as true tumor growth, we used the first postoperative scan as the baseline, and new areas of progressive contrast enhancement within the radiation field that developed within 3 months of the end of radiation therapy and then spontaneously resolved without change in treatment were assessed as pseudoprogression.
Statistical Methods
A test of the proportional hazards assumption was used after fitting uni- and multivariate Cox models, and 95% confidence intervals were generated. The Kaplan-Meier method with logrank and Wilcoxon tests was used to estimate progression-free survival. For all analyses, a P value < .05 was accepted as significant. Statistical analysis was performed with STATA 10 2008 (StataCorp, College Station, Texas).
Results
Patient Characteristics
The Table shows baseline patient characteristics. There was no significant difference in baseline ADC values or age between the experimental and control groups. As has been shown previously, RPA class was prognostic for survival (Cox model; HR, 1.7; P = .01). Overall mean ADCL was 1158 10−6mm2/s. This compares with a mean of 1201 10−6mm2/s for recurrent GBM in a prior study.19
Baseline patient demographics and responsea
Progression-Free and Overall Survival
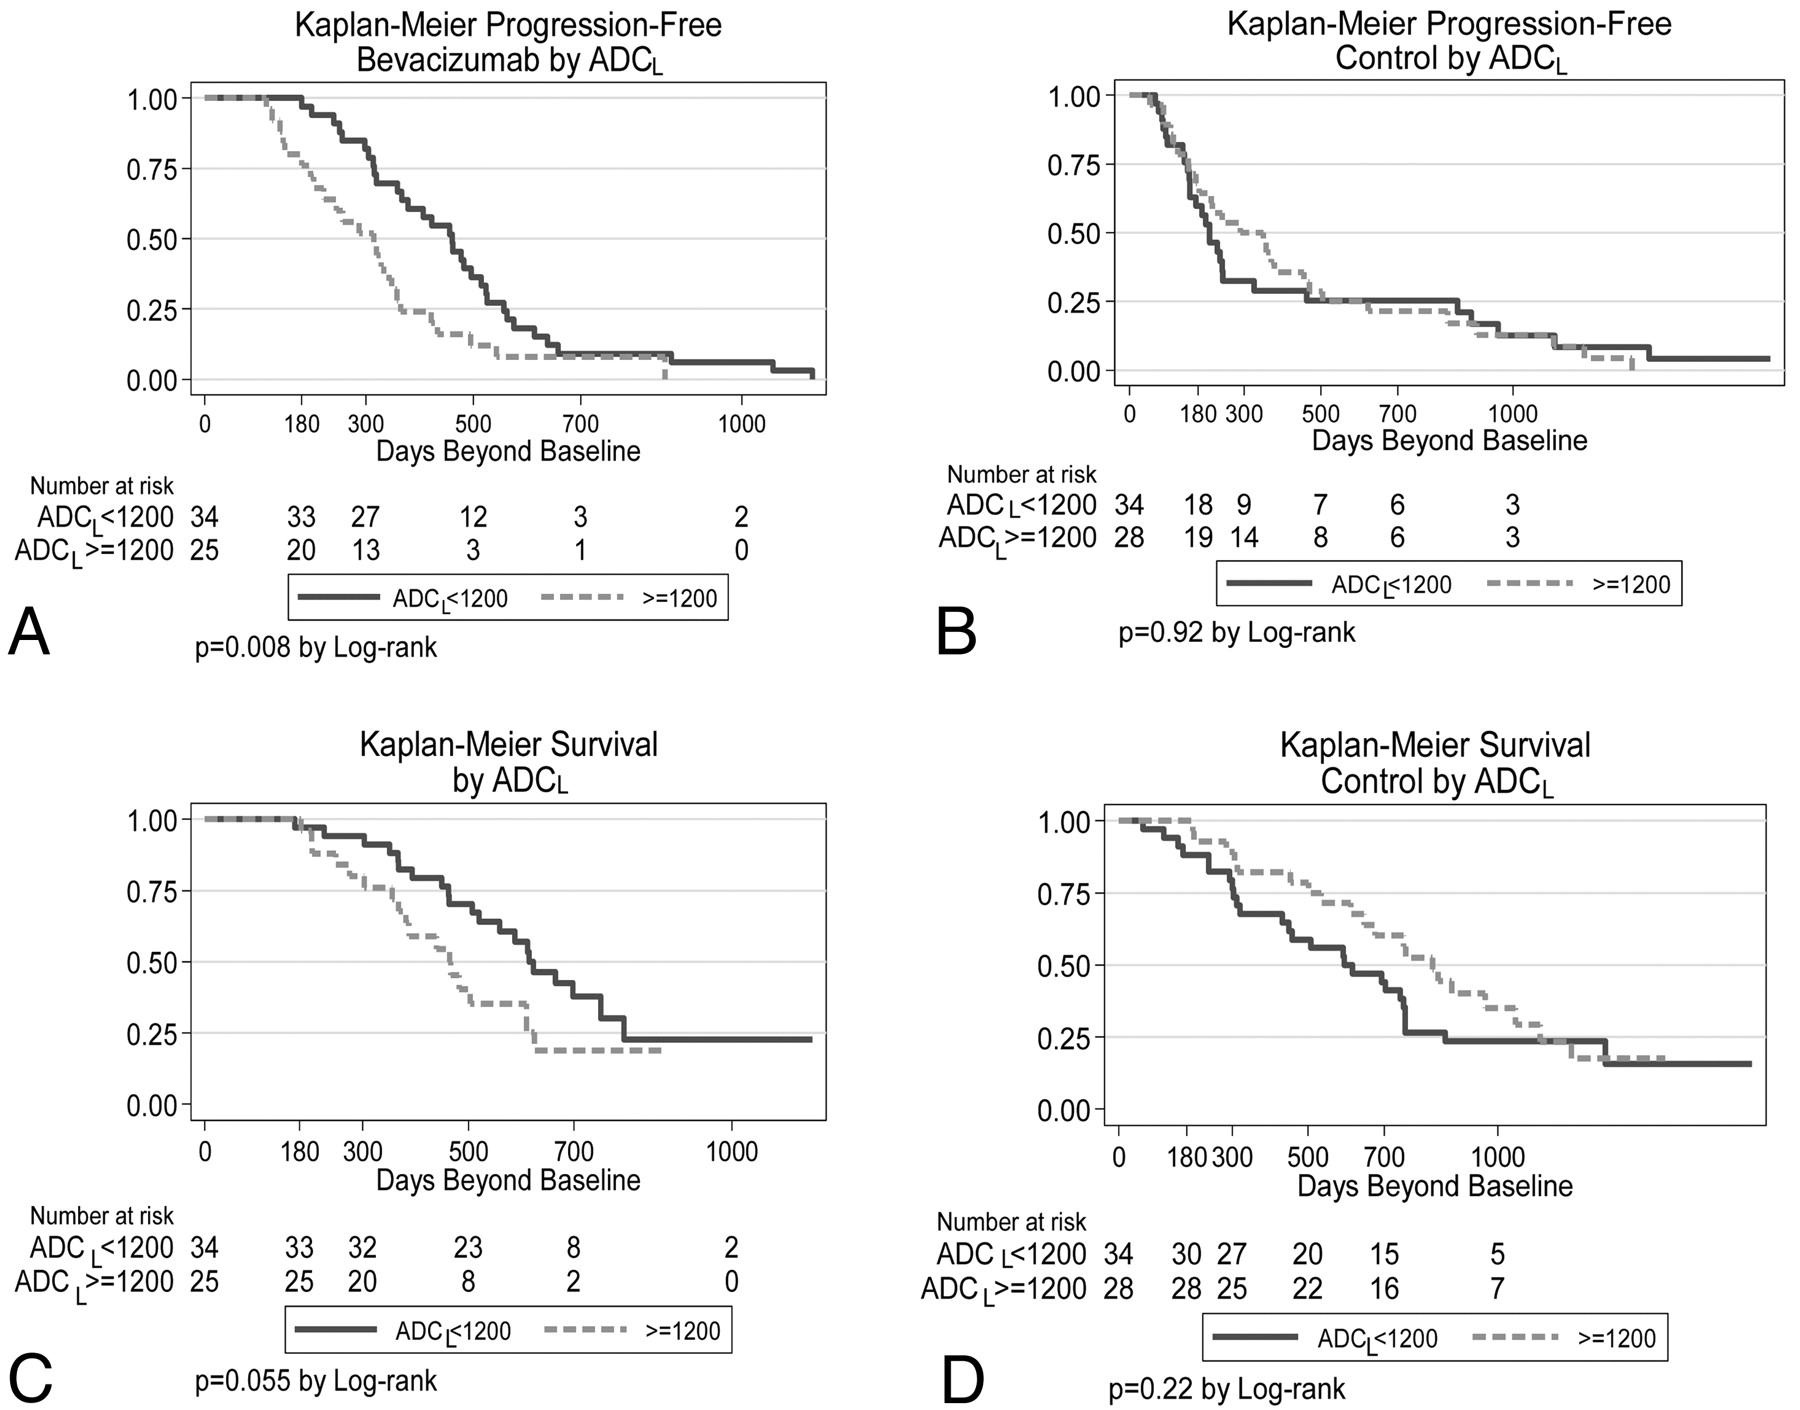
For up-front bevacizumab-treated patients but not the control group, there was a significant difference in progression-free survival between low ADC tumors and high ADC tumors (median, 459 versus 315 days; P = .008, logrank test; Fig 3 A, -B). Patients with low ADC tumors also tended to have better overall survival in the up-front bevacizumab-treated group (Fig 3C), though this was not quite statistically significant (P = .055). ADC values did not stratify overall survival in the control group (Fig 3D, P = .22).

Kaplan-Meier analysis of up-front bevacizumab-treated (A and C) and control (B and D) patients. The upper row represents progression-free survival, whereas the lower row is overall survival. For all graphs, the y-axis represents the percentage surviving.
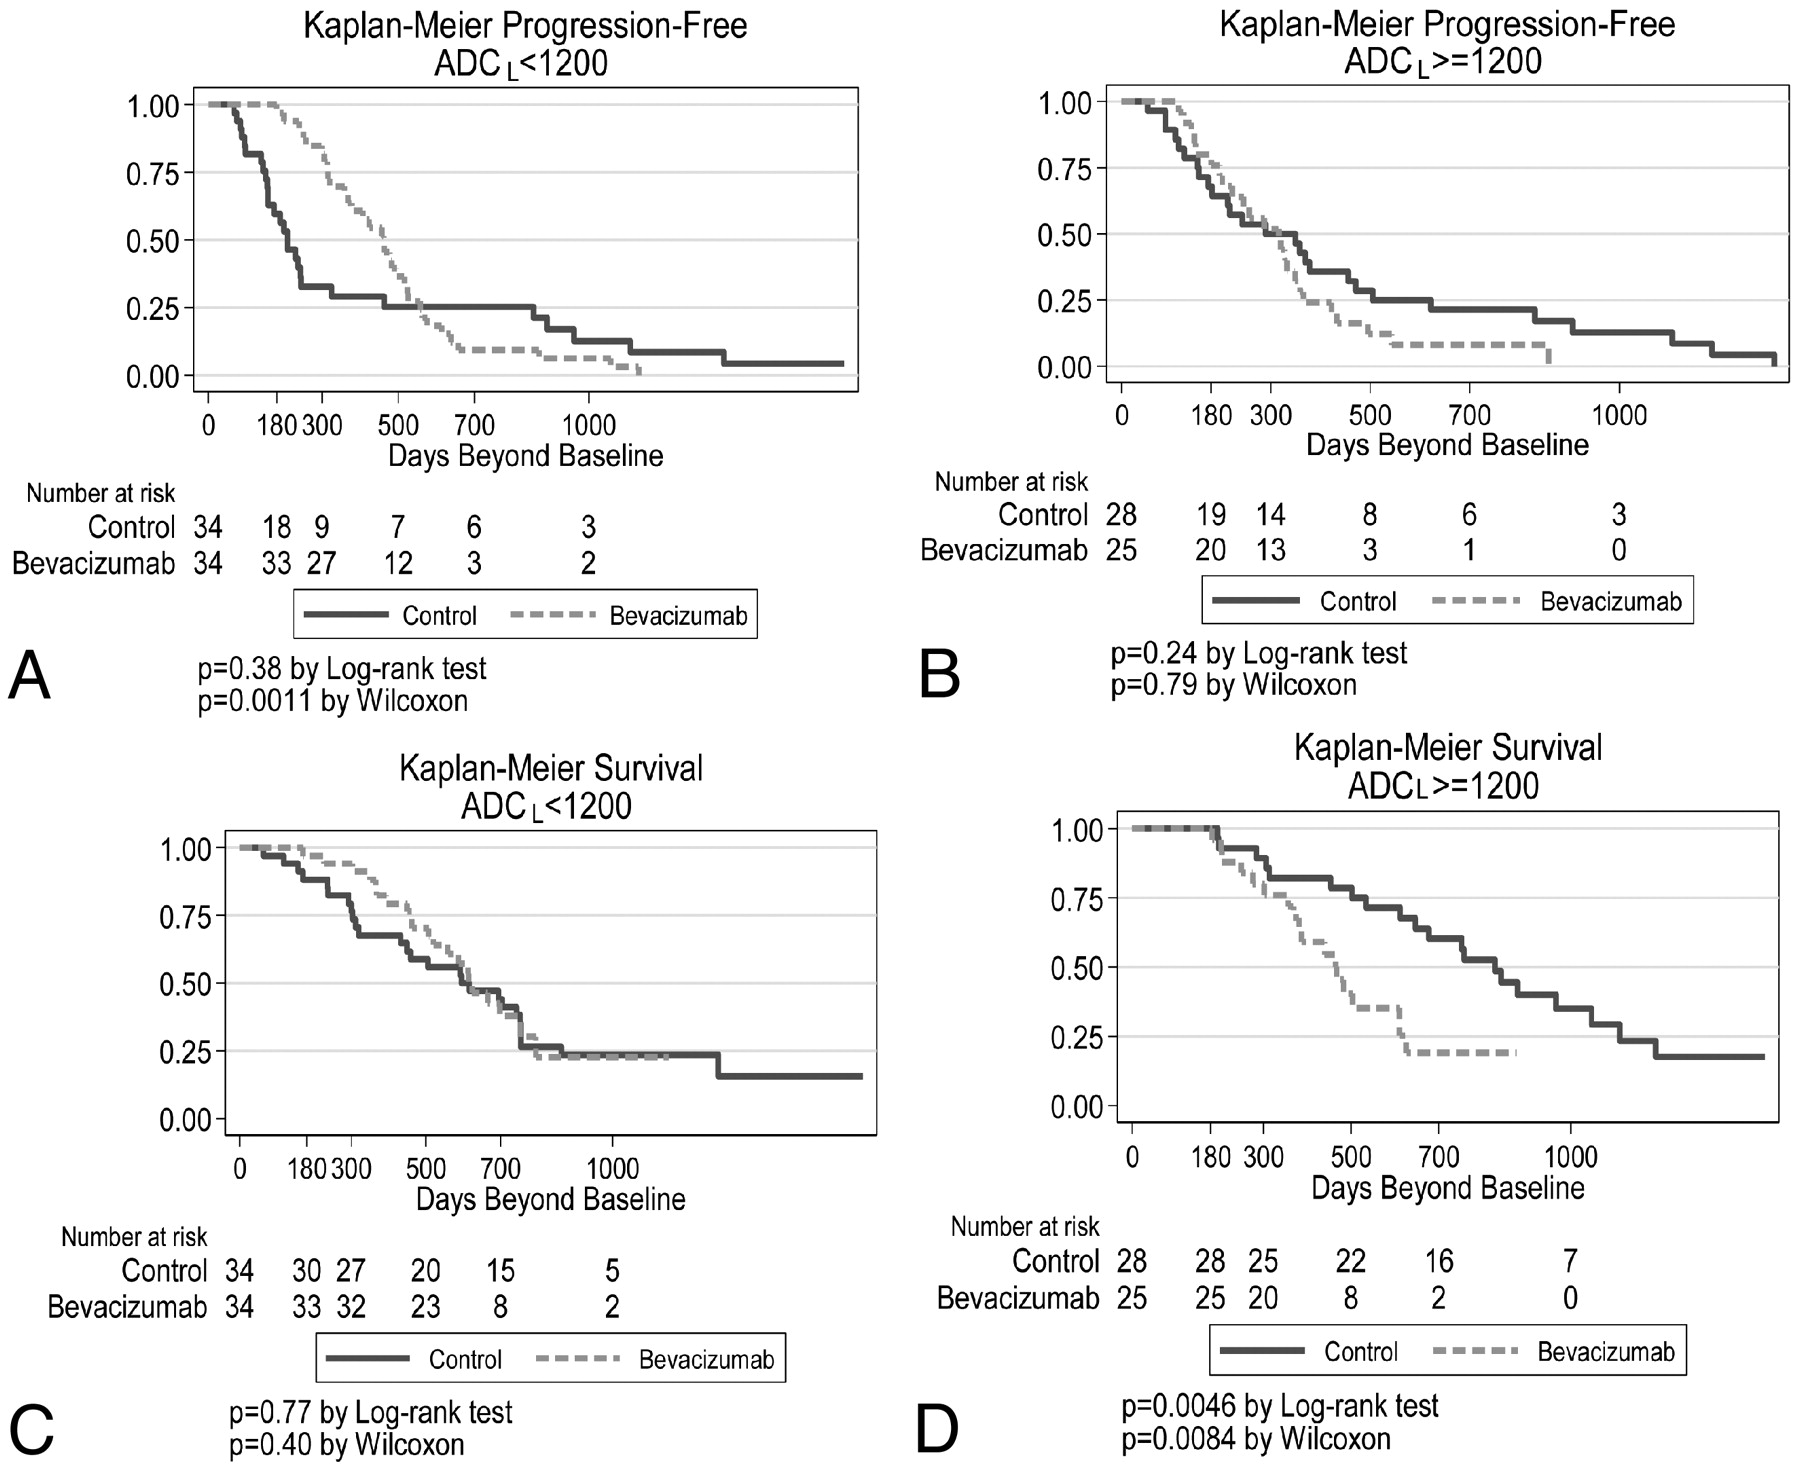
Survival analysis also was performed for all patients as a single cohort, dichotomized by ADCL < versus ≥ 1200 10−6mm2/s. For patients with low ADC tumors, progression-free survival was initially longer in patients treated up-front with bevacizumab (Fig 4 A, P = .001 by the Wilcoxon test); however, the graphs crossed at approximately 550 days, so that there were more long-term (>1000 days) survivors in the control group. For patients with high ADC tumors, there was little difference in progression-free survival curves between up-front bevacizumab-treated and control patients (Fig 4B). Comparing overall survival between bevacizumab-treated and control patients, we found no difference for low ADC tumors (Fig 4C). However, for high ADC tumors, control patients (ie, patients who were not treated with bevacizumab in the up-front setting but 55% [34/62] of whom received bevacizumab at recurrence) had significantly longer survival than those treated up-front with bevacizumab (P = .005, Fig 4D).

Kaplan-Meier analysis of low (A and C) and high (B and D) ADC tumors. The upper row represents progression-free survival, whereas the lower row is overall survival. For all graphs, the y-axis represents the percentage surviving.
Of 62 control patients (no up-front bevacizumab), 55 patients had recurrent disease. Of these, 34 (62%) received bevacizumab at recurrence. Of the 34 control patients who received bevacizumab at recurrence, 50% (17/34) had high ADC tumors. These patients had longer survival than control patients (also treated with bevacizumab) with low ADC tumors (HR, 2.4; P = .02).
A multivariate Cox model using both RPA class and ADC data showed that for patients with up-front bevacizumab treatment, high tumor ADC was associated with an overall survival HR of 2.1 (P = .02), and the HR increased 1.8-fold for each level of RPA class increase (P = .030). Thus, ADC values stratified survival independent of RPA class in the up-front bevacizumab-treated group.
ADC and MGMT Promoter Methylation Status
Methylation status was available for a total of 89 patients from the experimental and control groups. Of these, 36 (40%) had tumors that were determined to be methylated, comparable with rates of MGMT promoter methylation in other studies.25 Tumors with MGMT promoter methylation had lower mean ADCL values compared with unmethylated tumors: 1071 ± 173 versus 1183 ± 215 10−6mm2/s, (P = .01, 2-group t test; Fig 5 ). For patients treated up-front with bevacizumab, a multivariate analysis with both ADCL and methylation status showed that methylation was significantly associated with outcome (HR, 0.26; P < .001 for overall survival; HR, 0.35; P = .001 for progression-free survival), whereas low ADCL was not (HR, 0.90; P = .81 for overall survival; HR, 0.64, P = .13 for progression-free survival). For this cohort of up-front bevacizumab-treated patients, 19/24 (79%) tumors that were MGMT promoter methylated also were low ADC tumors. This association may explain why only methylation status was prognostic in the multivariate analysis. There was no significant relationship between either ADCL or methylation and outcome in the control group, though for the control patients, only 30 had known methylation status, potentially limiting the statistical power of the analysis.

Box-and-whisker plot of ADCL values in MGMT promoter methylated and unmethylated tumors. The cross on the boxplots represents the mean ADCL values. Mean values are significantly different between the 2 groups (P = .01, 2-group t test).
Discussion
In patients with recurrent GBM, bevacizumab-regimen treatment has been shown to improve the response rate, as well as progression-free and overall survival compared with historical controls.4,5 The response to bevacizumab is highly variable, but the mechanisms underlying bevacizumab susceptibly are not well-characterized.7,26 More recently, the effect of bevacizumab therapy has been studied when started within 3–6 weeks after maximal tumor resection, concurrent with radiation and temozolomide therapy (ie, up-front treatment). In this setting, although progression-free survival improved, no benefit to overall survival was found.6 In patients treated with bevacizumab at tumor recurrence, ADC histogram analysis appears to stratify survival.19 Therefore, in the current work, we investigated how ADC-defined subpopulations of GBM respond to up-front bevacizumab therapy, with the underlying goal of optimizing patient treatment regimens.
We found that low tumoral ADC was associated with longer progression-free survival compared with high ADC when patients were treated up-front with bevacizumab. ADC values also appeared to stratify overall (in addition to progression-free) survival in this group, though this did not quite reach statistical significance (P = .055). Conversely, ADC values did not predict progression-free or overall survival in patients who did not receive up-front bevacizumab (P = .92 and P = .22, respectively). Most interesting, for patients in this control cohort, most of whom received bevacizumab at recurrence, high ADC values were associated with significantly longer survival compared with patients who received up-front bevacizumab, whereas those patients with low tumor ADC had identical survival whether they received bevacizumab up-front or not. Potentially in this (the recurrent) setting, greater ADC implies less tumor cell density, which could positively impact outcomes.
One possible explanation for the association of improved progression-free survival in patients treated with bevacizumab is pseudoresponse.9 Pseudoresponse occurs because of the antipermeability effect of bevacizumab on the tumor, which can result in less enhancement, thereby making tumors appear to respond to treatment and also making tumor progression more difficult to detect. To minimize this effect, we retrospectively reviewed the MR imaging studies and backdated the time to progression to the time of earliest evidence of enhancing or nonenhancing tumor growth. For some analyses, all patients received bevacizumab therapy, in which case difficulty in detecting tumor progression would be the same for all tumors and thus would not explain the difference in progression-free survival between high and low ADC GBM. It is possible, nonetheless, that the difference in progression-free survival between bevacizumab-treated and control patients could be partly explained by pseudoresponse. However, as mentioned above, we did consider increased FLAIR signal-intensity change in the diagnosis of progression, and currently no more accurate methods to demonstrate tumor progression are available. Similarly, we took steps to minimize the mischaracterization of pseudoprogression as true progression. Pseudoprogression is likely not common in bevacizumab-treated patients because reduction in permeability diminishes contrast enhancement associated with radiation change.10 However, in the control group, we also analyzed the scans retrospectively to eliminate the miscategorization of tumor progression where enhancing lesions within the radiation field later resolved without change in treatment. While pseudoresponse and pseudoprogression could impact the surrogate end point of progression-free survival, they are not relevant when considering the true end point of overall survival.
Patients with high-ADC tumors who were treated with bevacizumab in the up-front setting had shorter survival than those who never received bevacizumab or who received bevacizumab only at recurrence. Previous studies have shown a survival benefit in patients with recurrent GBM treated with bevacizumab, though those studies did not stratify patients by ADC values.4,5 However, these results, taken together, raise the possibility that up-front bevacizumab treatment is ineffective in patients with high ADC tumors, distinct from the survival benefit achieved when patients are given bevacizumab as salvage treatment. The reason for this result is unknown, though there are several possibilities. For instance, bevacizumab treatment may not be effective immediately after surgery when there is little or no residual tumor on which bevacizumab treatment could act. Another possibility is that bevacizumab treatment restores the blood-brain barrier, thereby affecting the concentration of chemotherapeutics within tumor tissue. Temozolomide, for example, can cross an intact blood-brain barrier, but tumor blood volume and blood-brain barrier permeability (both potentially altered by bevacizumab treatment) are thought to impact intratumoral concentrations of this drug.12,27
Others have shown that lower ADC values in untreated gliomas are associated with shortened time to survival, in contrast to our results.20,21 However, there are several important differences between the ADC analyses. In the current work, we were not using the overall mean ADC or the minimum ADC but rather the ADCL fitted with a binormal distribution. Additionally, we used ADC values from regions of interest corresponding to the entirety of enhancing tumor and not minimum regions of interest or regions of interest generated from areas of nonenhancing T2-weighted signal-intensity change. Furthermore, all of our data are from GBM rather than a mixture of tumor grades, and we studied a much larger cohort of patients. Last, in contrast to the current study, these prior reports were conducted before bevacizumab therapy was widespread. Thus part of this discrepancy may be because bevacizumab therapy could affect survival in an ADC-dependent manner.
Previous work has shown that vasogenic edema and necrosis are associated with high VEGF levels as well as unfavorable outcomes in patients with GBM.18 Radiation injury also is associated with increased VEGF10 as well as increased T2-weighted signal intensity and higher ADC values.28 Because edema and necrosis would tend to increase ADC, diffusion imaging could potentially serve as a biomarker of VEGF expression, a hypothesis yet to be formally tested. One intriguing possibility is that bevacizumab treatment could be more effective at preventing or reversing the angiogenic switch in low-ADC tumors compared with high ADC tumors, the latter having more abundant VEGF production. Clearly the relationship between physiologic imaging biomarkers and molecularly defined phenotypes of GBM merits additional investigation.
One molecularly defined subgroup of GBM with a significantly better prognosis is tumors with methylation of the MGMT promoter.13 We tested the hypothesis that patients with low ADC tumors have longer survival because they are enriched by tumors with MGMT promoter methylation. We did, indeed, find an association between ADC values and methylation status: Methylated tumors had significantly lower ADC values than unmethylated tumors. In a multivariate analysis of up-front bevacizumab-treated patients using both ADCL and methylation status, only methylation was prognostically significant, indicating that the relationship between ADCL and tumor methylation may help explain the prolonged survival of patients with low ADC tumors in the bevacizumab-treated group. Previous work has shown that MR imaging features such as ring enhancement are associated with methylation status,16 but to our knowledge, this is the first work to show a relationship between methylation status and ADC.
There are several caveats to our study. Our methods require coregistration of postcontrast T1-weighted images with the ADC map, which could be a source of error, particularly if section thicknesses between the pulse sequences are not the same. For the control patients, there was some heterogeneity of treatment at recurrence, which could affect survival data. Additionally, a small number of control patients have yet to recur and, therefore, received no further treatment, potentially adding a component of selection bias in the analysis of overall survival. Steroid doses at first imaging were not available for all patients. Steroid doses could affect ADC values, though the effect is probably small, because it has been reported that steroid treatment reduces mean ADC by 7% in brain tumors.29 We analyzed ADC values from areas of enhancing tumor only, on the basis of previously established methods.19 We thought that this was more reproducible than including areas of nonenhancing tumor which can be ill-defined or obscured by edema, but potentially this choice could affect the analysis. As discussed above, accurate determination of tumor progression could be adversely affected by pseudoresponse and pseudoprogression. Additionally, for subgroup analyses, there were few patients. Therefore, these results need to be confirmed in a prospective study with a larger cohort of patients.
Conclusions
We showed the potential utility of enhancing-tumor ADC histogram analysis in stratifying response to up-front bevacizumab treatment, as well as an association between low ADC tumors and MGMT promoter methylation. The latter finding suggests that ADC-based metrics may merit further development as a noninvasive biomarker potentially useful in predicting sensitivity and emerging resistance to temozolomide treatment.
Footnotes
-
This work was supported by a Brain Tumor Funders' Collaborative grant to Whitney B. Pope.
References
- Received July 15, 2010.
- Accepted after revision September 9, 2010.
- Copyright © American Society of Neuroradiology
In this issue


Jump to section
Related Articles
Cited By...
- Advanced Distance-Resolved Evaluation of the Perienhancing Tumor Areas with FLAIR Hyperintensity Indicates Different ADC Profiles by MGMT Promoter Methylation Status in Glioblastoma
- Pretreatment ADC Histogram Analysis as a Prognostic Imaging Biomarker for Patients with Recurrent Glioblastoma Treated with Bevacizumab: A Systematic Review and Meta-analysis
- Diffusion Characteristics of Pediatric Diffuse Midline Gliomas with Histone H3-K27M Mutation Using Apparent Diffusion Coefficient Histogram Analysis
- Prognostic Implications of Gadolinium Enhancement of Skull Base Chordomas
- Correlation of 18F-FDG PET and MRI Apparent Diffusion Coefficient Histogram Metrics with Survival in Diffuse Intrinsic Pontine Glioma: A Report from the Pediatric Brain Tumor Consortium
- ACRIN 6684: Assessment of Tumor Hypoxia in Newly Diagnosed Glioblastoma Using 18F-FMISO PET and MRI
- Differentiating Tumor Progression from Pseudoprogression in Patients with Glioblastomas Using Diffusion Tensor Imaging and Dynamic Susceptibility Contrast MRI
- The Added Prognostic Value of Preoperative Dynamic Contrast-Enhanced MRI Histogram Analysis in Patients with Glioblastoma: Analysis of Overall and Progression-Free Survival
- Lessons From Anti-Vascular Endothelial Growth Factor and Anti-Vascular Endothelial Growth Factor Receptor Trials in Patients With Glioblastoma
- Phase II Study of Bevacizumab, Temozolomide, and Hypofractionated Stereotactic Radiotherapy for Newly Diagnosed Glioblastoma
- Diffusion-Weighted Imaging in Cancer: Physical Foundations and Applications of Restriction Spectrum Imaging
- A Prognostic Model Based on Preoperative MRI Predicts Overall Survival in Patients with Diffuse Gliomas
- Pretreatment ADC Histogram Analysis Is a Predictive Imaging Biomarker for Bevacizumab Treatment but Not Chemotherapy in Recurrent Glioblastoma
- Diffusion-Weighted MR Imaging and MGMT Methylation Status in Glioblastoma: A Reappraisal of the Role of Preoperative Quantitative ADC Measurements
- Do Imaging Biomarkers Relate to Outcome in Patients Treated with VEGF Inhibitors?