
Abstract
BACKGROUND AND PURPOSE: KD, also known as histiocytic necrotizing lymphadenitis, is often mimicked by TL, especially when KD is accompanied by gross necrosis on CT. We analyzed the nodal necrosis patterns on CT in patients with KD and TL to identify the predictive features that differentiate these 2 entities.
MATERIALS AND METHODS: We included 24 patients with KD (14 females, 10 males; mean age, 25.1 years) and 45 with TL (36 women, 9 men; mean age, 39.9 years) having nodal necrosis on CT. The extent, number, location, and margins of nodal necrosis; the presence of perinodal infiltration; and nodal calcification were analyzed. Two attenuation indices for nodal necrosis were derived: CTN and CTN/M. The CT features of the 2 diseases were compared, and multivariate logistic regression analysis was performed to identify predictive features that would aid in differentiating KD from TL.
RESULTS: Mild or moderate extent of nodal necrosis (P = .000), multiple necrotic foci (P = .002), indistinct margins of necrotic foci (P = .000), CTN of >44.5 (P = .000), CTN/M of >0.7 (P = .000), and absence of nodal calcification (P = .012) were associated with KD. Multivariate logistic regression analysis revealed that indistinct margins of necrotic foci were independent predictors, with 80% accuracy.
CONCLUSIONS: The presence of indistinct margins of necrotic foci was an independent predictor in differentiating KD from TL with high diagnostic accuracy.
ABBREVIATIONS:
- CTN
- CT attenuation of nodal necrosis
- CTN/M
- CT attenuation ratio of the necrotic portion of the lymph node to adjacent muscle
- FNAB
- fine-needle aspiration biopsy
- KD
- Kikuchi disease
- ROC
- receiver operating characteristic analysis
- TL
- tuberculous lymphadenitis
- US
- sonography
KD, also known as histiocytic necrotizing lymphadenitis, is a rare self-limiting cause of cervical lymphadenopathy, predominantly affecting Southeast Asian women younger than 30 years of age. KD is histopathologically characterized by cortical and paracortical necrosis with lymphoreticular infiltration and the absence of granulocytic infiltration.1,2 The disease must be distinguished from a variety of other disorders, including TL, lymphoma, and other benign and/or malignant adenopathy by clinical presentation and laboratory techniques.3
TL frequently mimics KD, especially when KD is accompanied by nodal necrosis on CT. Moreover, TL is common in Southeast Asia.4 However, unlike KD, patients with TL always require antituberculous chemotherapy and sometimes surgical excision.5 Therefore, it is important to differentiate KD and TL to ensure appropriate treatment.6
FNAB has been considered a diagnostic tool for KD and TL, but FNAB may not be the best solution to differentiate these diseases. The diagnostic accuracy of FNAB for KD was reported to be approximately 50%, possibly because of cytologic features overlapping those of TL.7 Therefore, imaging modalities such as US and CT are emphasized to detect and characterize these 2 types of necrotizing lymphadenitis. Although CT poses a radiation hazard, it is superior to US because it is objective and independent of the operator's skill when delineating nodal necrosis. Furthermore, it also can help to determine the exact extent of lymphadenitis.
The CT findings of each disease have been reported previously.1,8–12 The most common CT findings of KD include homogeneous enhancement with or without nodal necrosis and perinodal infiltration on CT, while the typical CT findings of TL include a central low-attenuation necrosis with peripheral rim enhancement with/without calcification. However, differentiating these diseases in daily practice remains difficult because they have overlapping findings on CT. The purpose of our study was to analyze the CT features of nodal necrosis in histologically confirmed cases of KD and TL quantitatively as well as qualitatively and to identify predictive features that might allow differentiating KD from TL.
Materials and Methods
Study Population
This retrospective study was approved by our institutional review board, and the requirement for informed consent was waived. A computerized search of the medical records at our institution from January 2005 to March 2010 found 38 patients with KD and 62 patients with TL histopathologically proved by excisional biopsy. To develop a study group of suitable cases to compare the patterns of nodal necrosis on CT between the 2 diseases, we used the following inclusion criteria: 1) pathologic diagnosis of KD and TL of cervical lymph nodes, 2) available contrast-enhanced neck CT image, and 3) the presence of nodal necrosis at the largest lymph nodes analyzed on CT. “Nodal necrosis” on CT was defined as focal areas of low attenuation.13
Of the 100 patients with the diseases, 10 with KD and 17 with TL were excluded, including those who had not undergone neck CT images and those whose disease did not involve cervical lymph nodes. Furthermore, 4 patients with KD were excluded because they did not show nodal necrosis on CT on the basis of the largest lymph node.
Finally, 24 patients diagnosed with KD (14 females, 10 males; mean age, 25.1 ± 12.03) and 45 patients diagnosed with TL (36 women, 9 men; mean age, 39.9 ± 15.51) showing nodal necrosis on CT were included in our study (Fig 1).

KD in an 8-year-old girl. Transverse CT image shows a lymph node (arrow) containing multiple necrotic foci in the peripheral portion of the node. The necrotic foci have indistinct margins, and the extent of nodal necrosis accounts for <30% (mild degree) of the lymph node. The obliteration of the fat plane surrounding the node is seen (arrowhead). The CTN and CTN/M were calculated as 79 HU and 1.0, respectively.
The mean time intervals between neck CT and excisional biopsy in patients with KD and TL were 8.2 days and 7.4 days, respectively.
Level II was the most frequently analyzed site in KD, identified in 16 (66.7%) of 24 patients with KD, followed by level V in 4 (16.6%), according to the imaging-based nodal classification reported by Som et al.14 The most analyzed lymph nodes in TL were at levels II (20/45, 44.4%) and V (16/45, 35.6%).
The mean maximal diameters of the analyzed lymph nodes of KD and TL were 2.0 and 2.5 cm, respectively. The characteristics of the study population are shown in Table 1.
Characteristics of the study populationa
Image Protocol
A neck CT (Somatom 16CT or 64CT scanner; Siemens Medical Systems, Malvern, Pennsylvania) was performed in the axial planes from the skull base to the upper mediastinum. Sections were 3 mm thick and contiguous. Images were obtained after intravenous administration of 80 mL of nonionic contrast medium (Ultravist [iopromide]; Schering, Berlin, Germany) based on the patient's weight, with a 40-second delay before scanning was started.
Imaging Assessment
Qualitative Analysis.
Two radiologists (S.L. and J.H.Y.), who were unaware of the pathologic results, reviewed the CT images, and a consensus was reached by the 2 observers. The largest affected lymph nodes with nodal necrosis on CT that matched the excision biopsy site as closely as possible were analyzed. The patterns of nodal necrosis were evaluated on the basis of the extent, number, location, and margins. The presence of perinodal infiltration and nodal calcification was also assessed.
The extent of necrotic foci was categorized into 3 groups: mild (<30% of an affected lymph node), moderate (30%–70%), and severe (>70%). The number of necrotic foci was divided into single and multiple (>2 necrotic foci). The location of necrotic foci was classified as the central or peripheral (eccentric or scattered) portion within the node. The margins of necrotic foci were classified as indistinct, relatively well-defined, or well-defined. Perinodal infiltration was regarded as present if the adjacent fat plane was obscured. The presence (absence) of calcification within the node was also assessed and was encoded as a binary variable.
Quantitative Analysis.
CTN/M was measured in Hounsfield units by using manually defined circular or oval regions of interest (approximately 5 mm2) on the postconstrast CT images. At least 3 regions of interest were placed on the necrotic portion, excluding hilar vessels and the parenchyma of the lymph node and adjacent muscle, such as the sternocleidomastoid and trapezius muscles, devoid of beam-hardening artifacts. The region-of-interest values were then averaged.
Two attenuation indices for nodal necrosis, CTN and CTN/M, were then derived.
Statistical Analysis
To evaluate the differences in demographic features between KD and TL, we used the Mann-Whitney U test and the χ2 test. The χ2 test was used to compare the categoric variables, including the extent, number, location, and margins of necrotic foci; perinodal infiltration; and nodal calcification. We used the Mann-Whitney U test to compare CTN and CTN/M in KD and TL.
ROC was used to determine optimal cutoff values for CTN and CTN/M to differentiate KD from TL. The area under the ROC curve provided a measurement of the global performance of the attenuation indices for nodal necrosis as effective indicators for discrimination of the 2 diseases. The optimal cutoff values were defined as the value at which the sum of the sensitivity and specificity was maximized.
Multivariate analysis was performed by using the multiple logistic regression method. The model involves the use of backward stepwise elimination, with variables eliminated at P < .1, to determine whether these CT findings were useful independently of one another in distinguishing KD from TL. Statistical significance was defined at P < .05. All statistical analyses were performed by using the Statistical Package for the Social Sciences software, Version 18.0 (SPSS, Chicago, Illinois).
Results
There was no significant difference in sex distribution between KD (female/male, 14:10) and TL (women/men, 36:9). However, there was a significant difference in age distribution between KD (mean age, 24.5 ± 11.22 years) and TL (mean age, 39.9 ± 15.52 years; P < .05, Mann-Whitney U test).
Qualitative Analysis of CT Images in KD and TL
The patterns of nodal necrosis on CT in KD and TL are summarized in Table 2. The extent of nodal necrosis was mild or moderate in 21 (87.5%) of 24 patients with KD and severe in 28 (62.2%) of 45 patients with TL (P = .000). The extent of nodal necrosis was significantly different between KD and TL, regardless of whether it was considered a ternary (P = .000) or binary variable (Table 2). Representative images are presented in Figs 1–3. Twenty-two (91.6%) of 24 patients with KD had multiple necrotic foci within the largest node (Fig 2), whereas 20 (44.4%) of 45 patients with TL had a single necrotic focus within the largest node (P = .003) (Fig 4). There were no significant differences in the location of necrotic foci within the largest node between the 2 diseases (P = .339). In both diseases, necrotic foci were frequently located in the peripheral portion within the node (Figs 2 and 5). The margins of necrotic foci were indistinct in 19 (79.2%) of 24 patients with KD (Figs 1–3) and relatively well-defined or well-defined in 36 (80.0%) of 45 patients with TL (Fig 4–6). Significant differences between the 2 diseases were observed in the margins of necrotic foci, considered a ternary (P = .000) as well as binary variable (Table 2). There was no significant difference in perinodal infiltration between KD and TL (P = .192) (Fig 6). Calcification within nodes was observed in 11 of 45 patients with TL (P = .012) (Fig 5).
Comparison of patterns of nodal necrosis on CT in KD and TLa

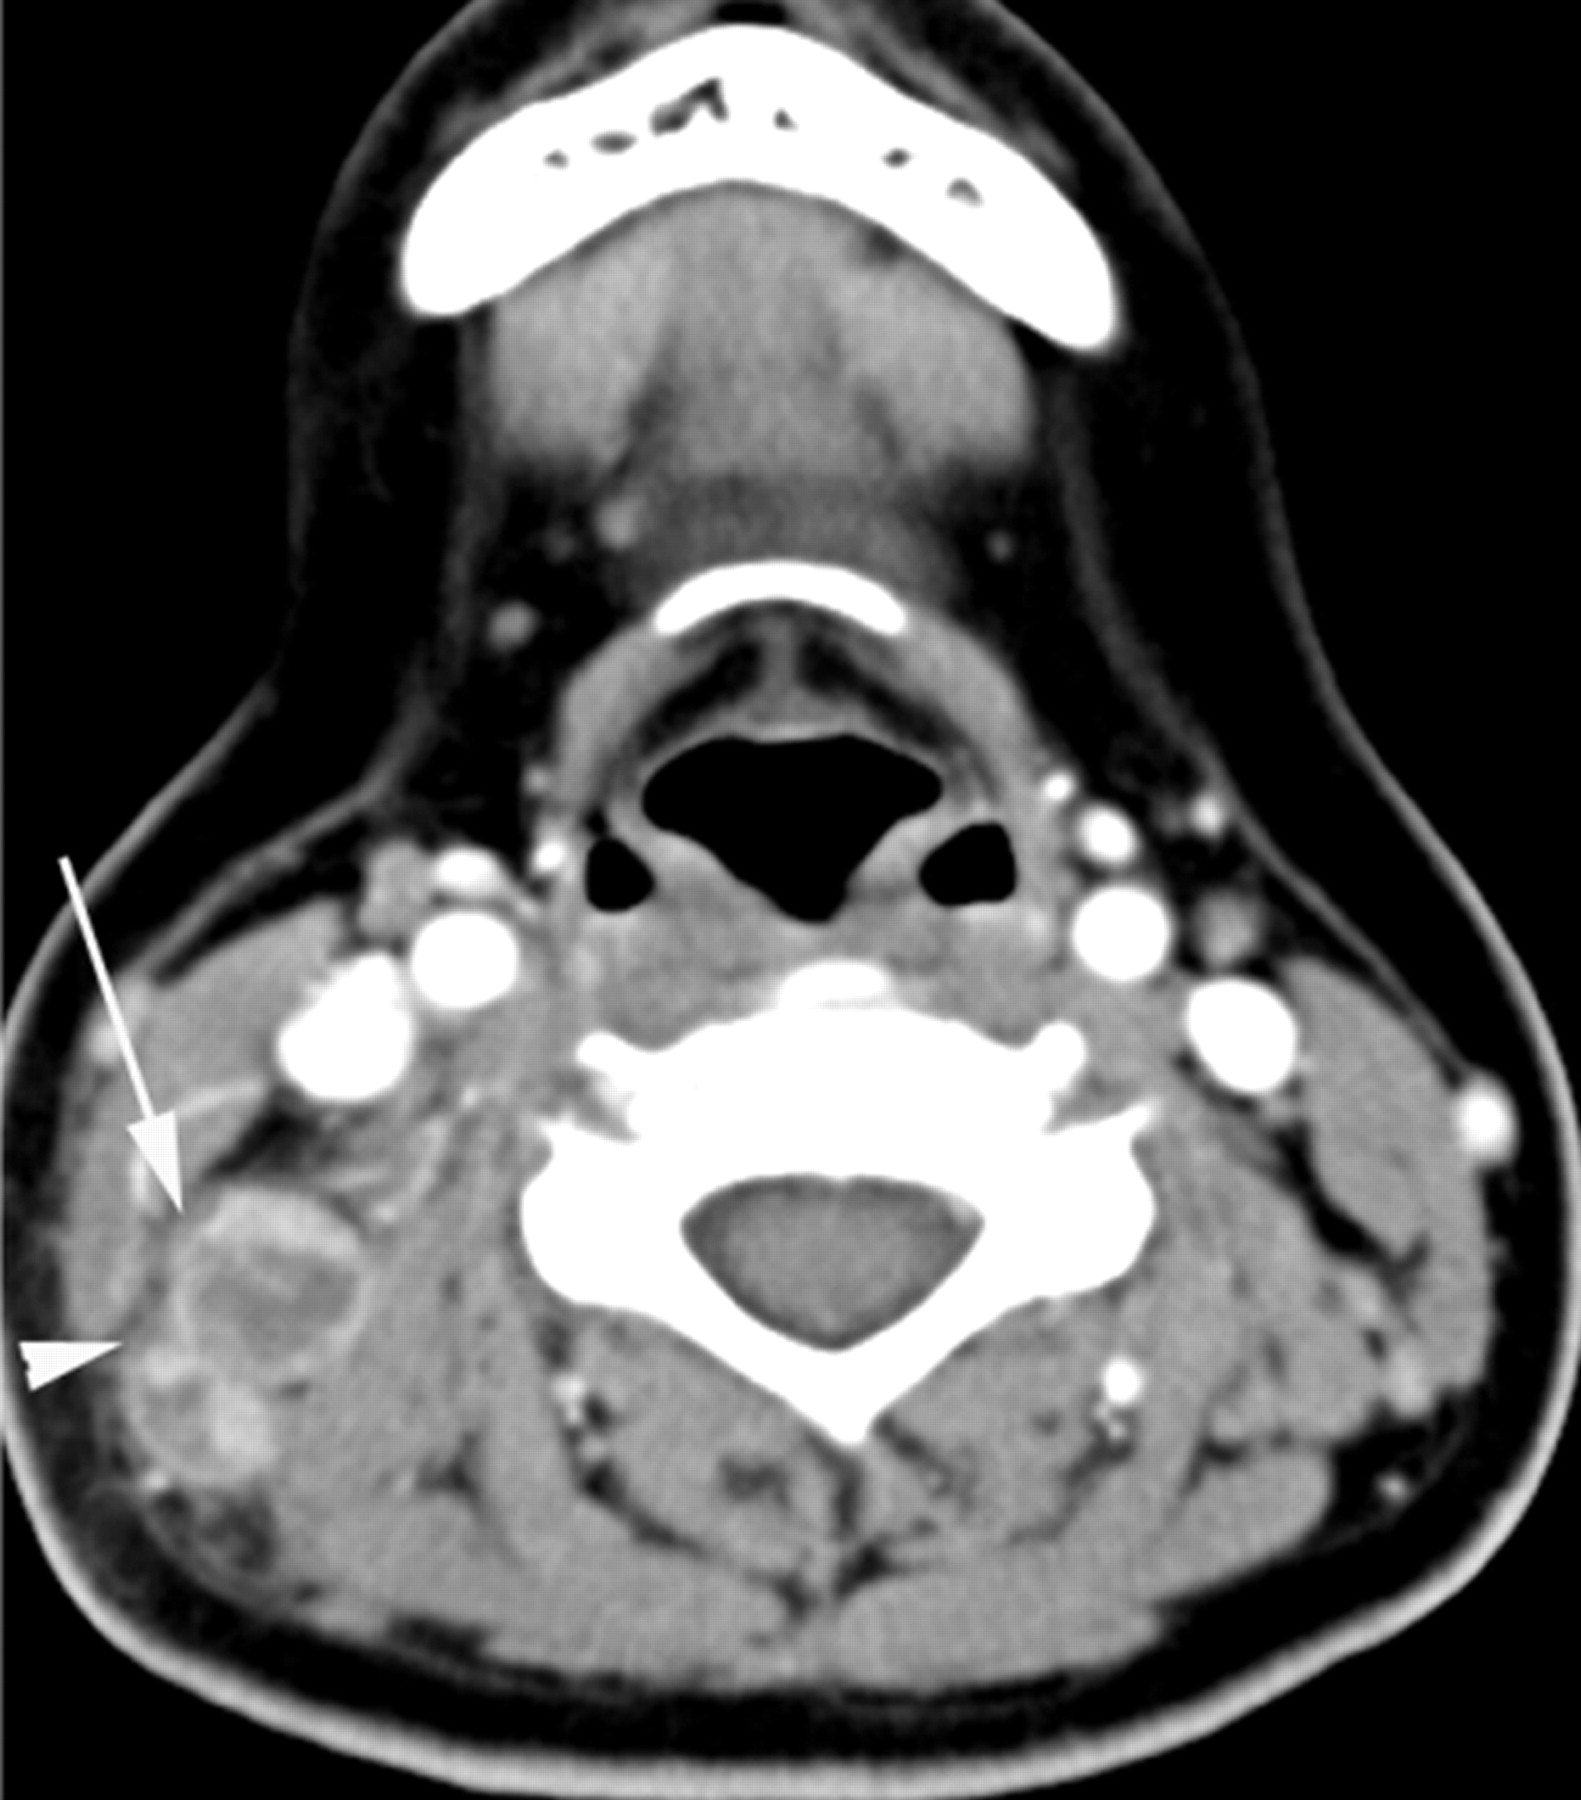
KD in a 13-year-old boy. Transverse CT image shows a lymph node (arrow) containing multiple necrotic foci in the peripheral portion of the node. The necrotic foci have indistinct margins, and the extent of nodal necrosis accounts for approximately 30%–70% (moderate degree) of the lymph node. The CTN and CTN/M were calculated as 65 HU and 0.9, respectively.

KD in a 31-year-old woman. Transverse CT scan shows 2 lymph nodes with necrotic foci. The larger one (arrow) has a single necrotic focus with a relatively indistinct margin, and the extent accounts for >70% (severe degree) of the lymph node. Perinodal infiltration is seen (arrowhead). The CTN and CTN/M were 43 HU and 0.7, respectively.

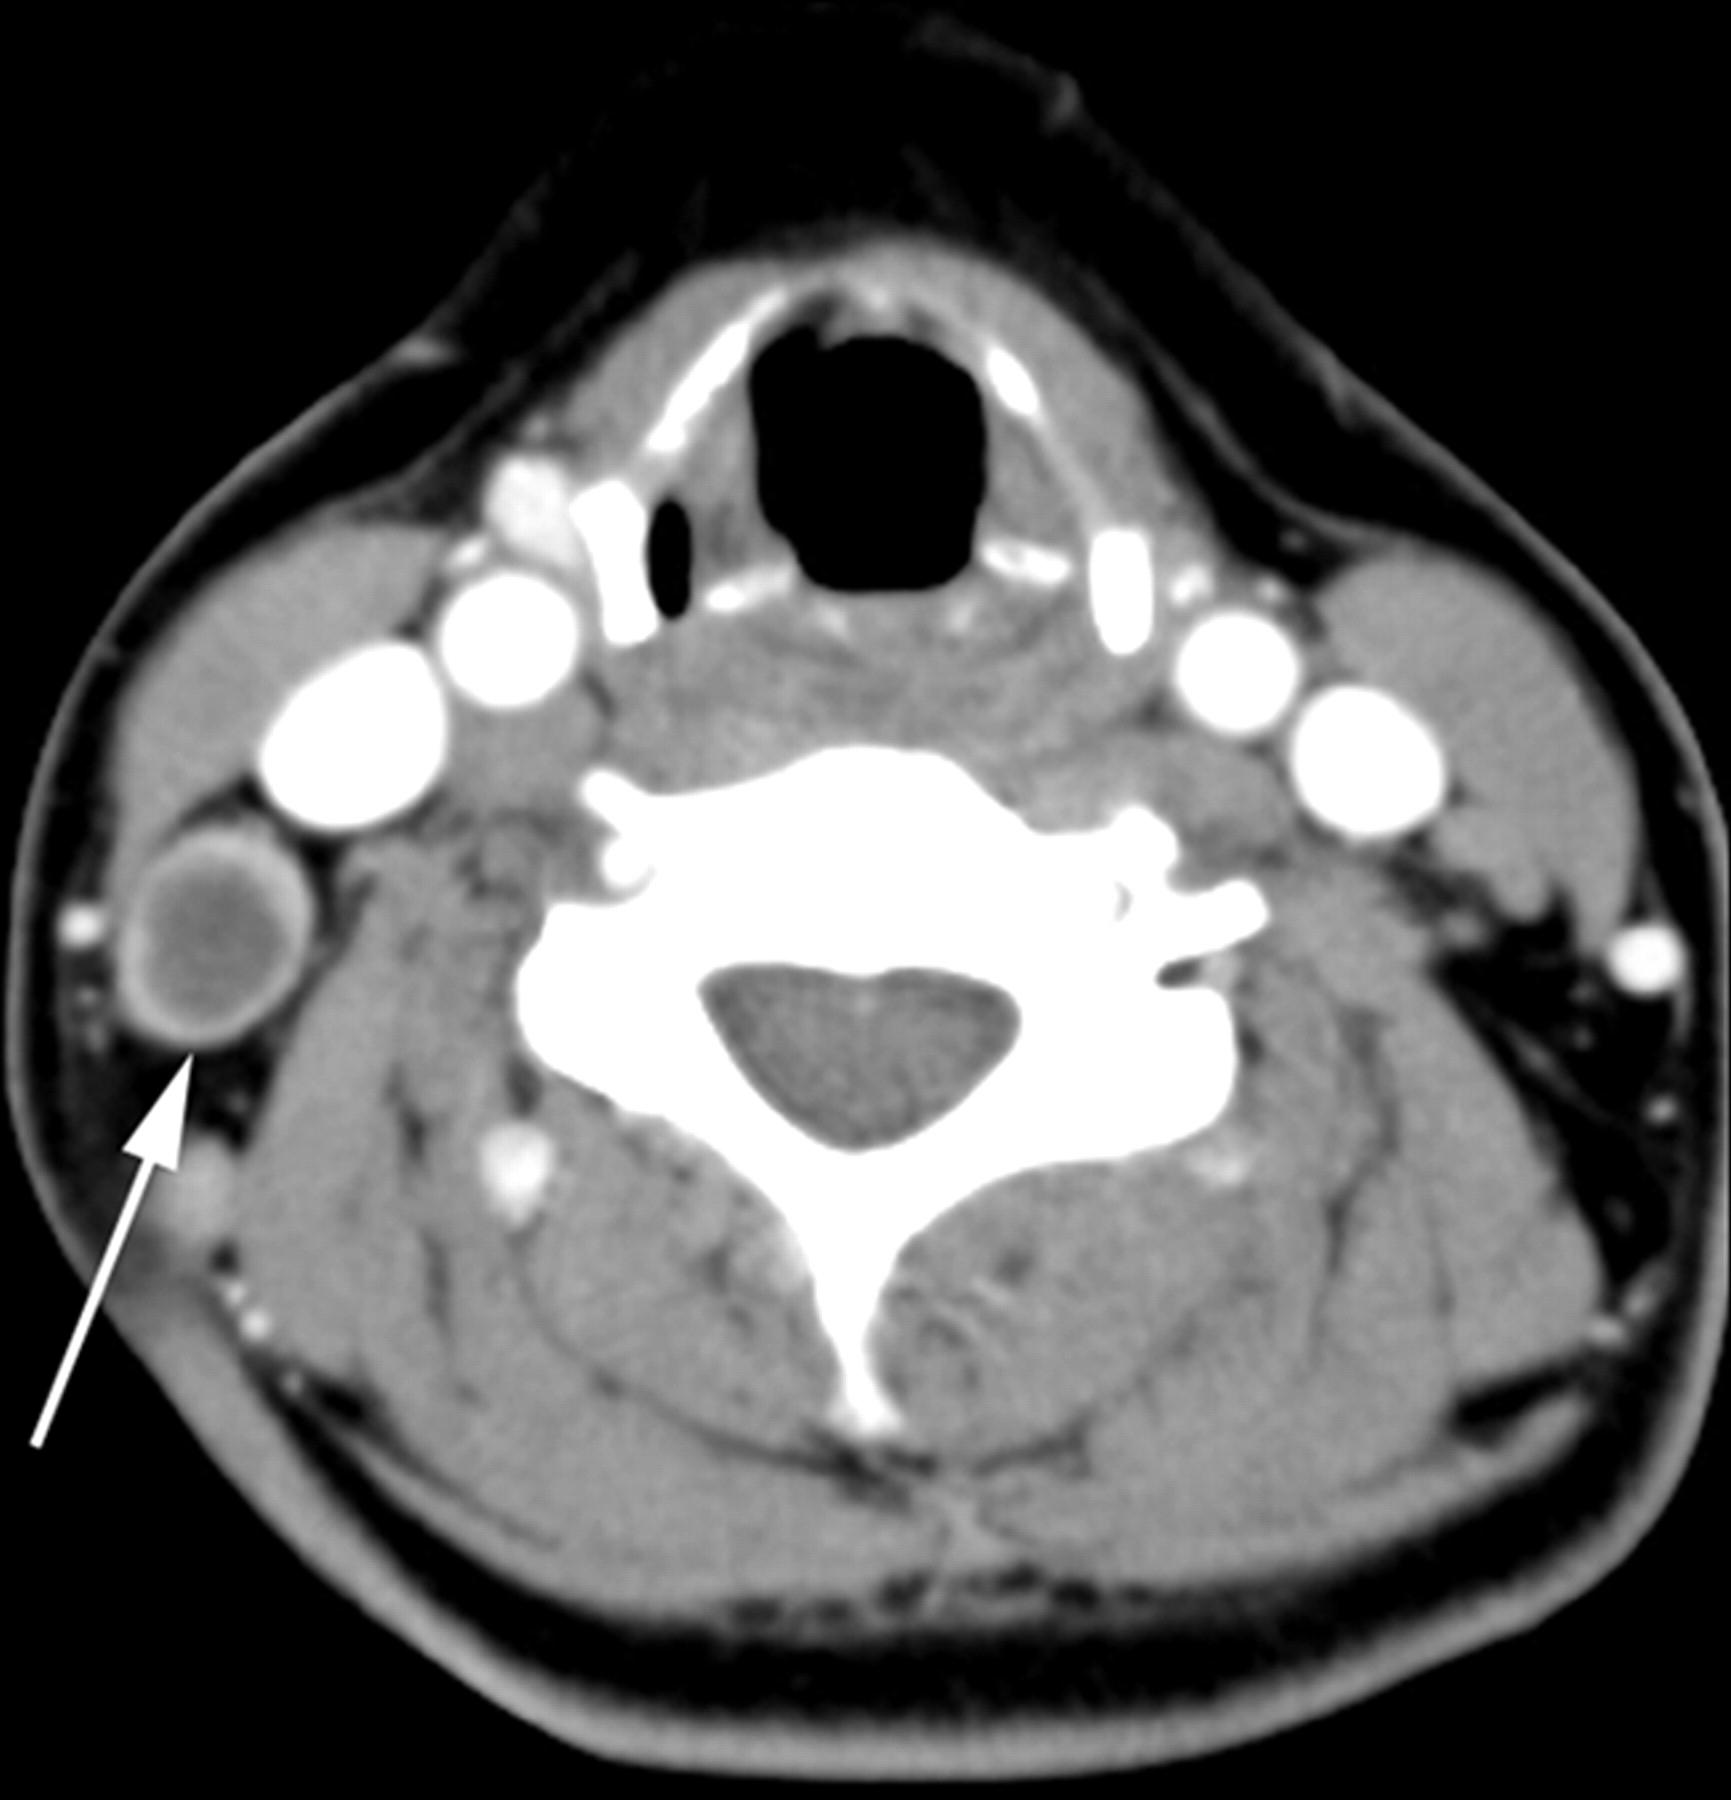
TL in a 38-year-old woman. Transverse CT scan demonstrates a necrotic lymph node. The lymph node (arrow) has a single necrotic focus with a well-defined margin, and the extent of nodal necrosis accounts for >70% (severe degree) of the lymph node. The CTN and CTN/M were 29 HU and 0.4, respectively.

TL in a 35-year-old woman. Transverse image shows a lymph node (arrow) having multiple necrotic foci with relatively well-defined margins and a moderate extent of nodal necrosis. Note calcification (arrowhead) within the node. CTN and CTN/M were 38 HU and 0.6, respectively.

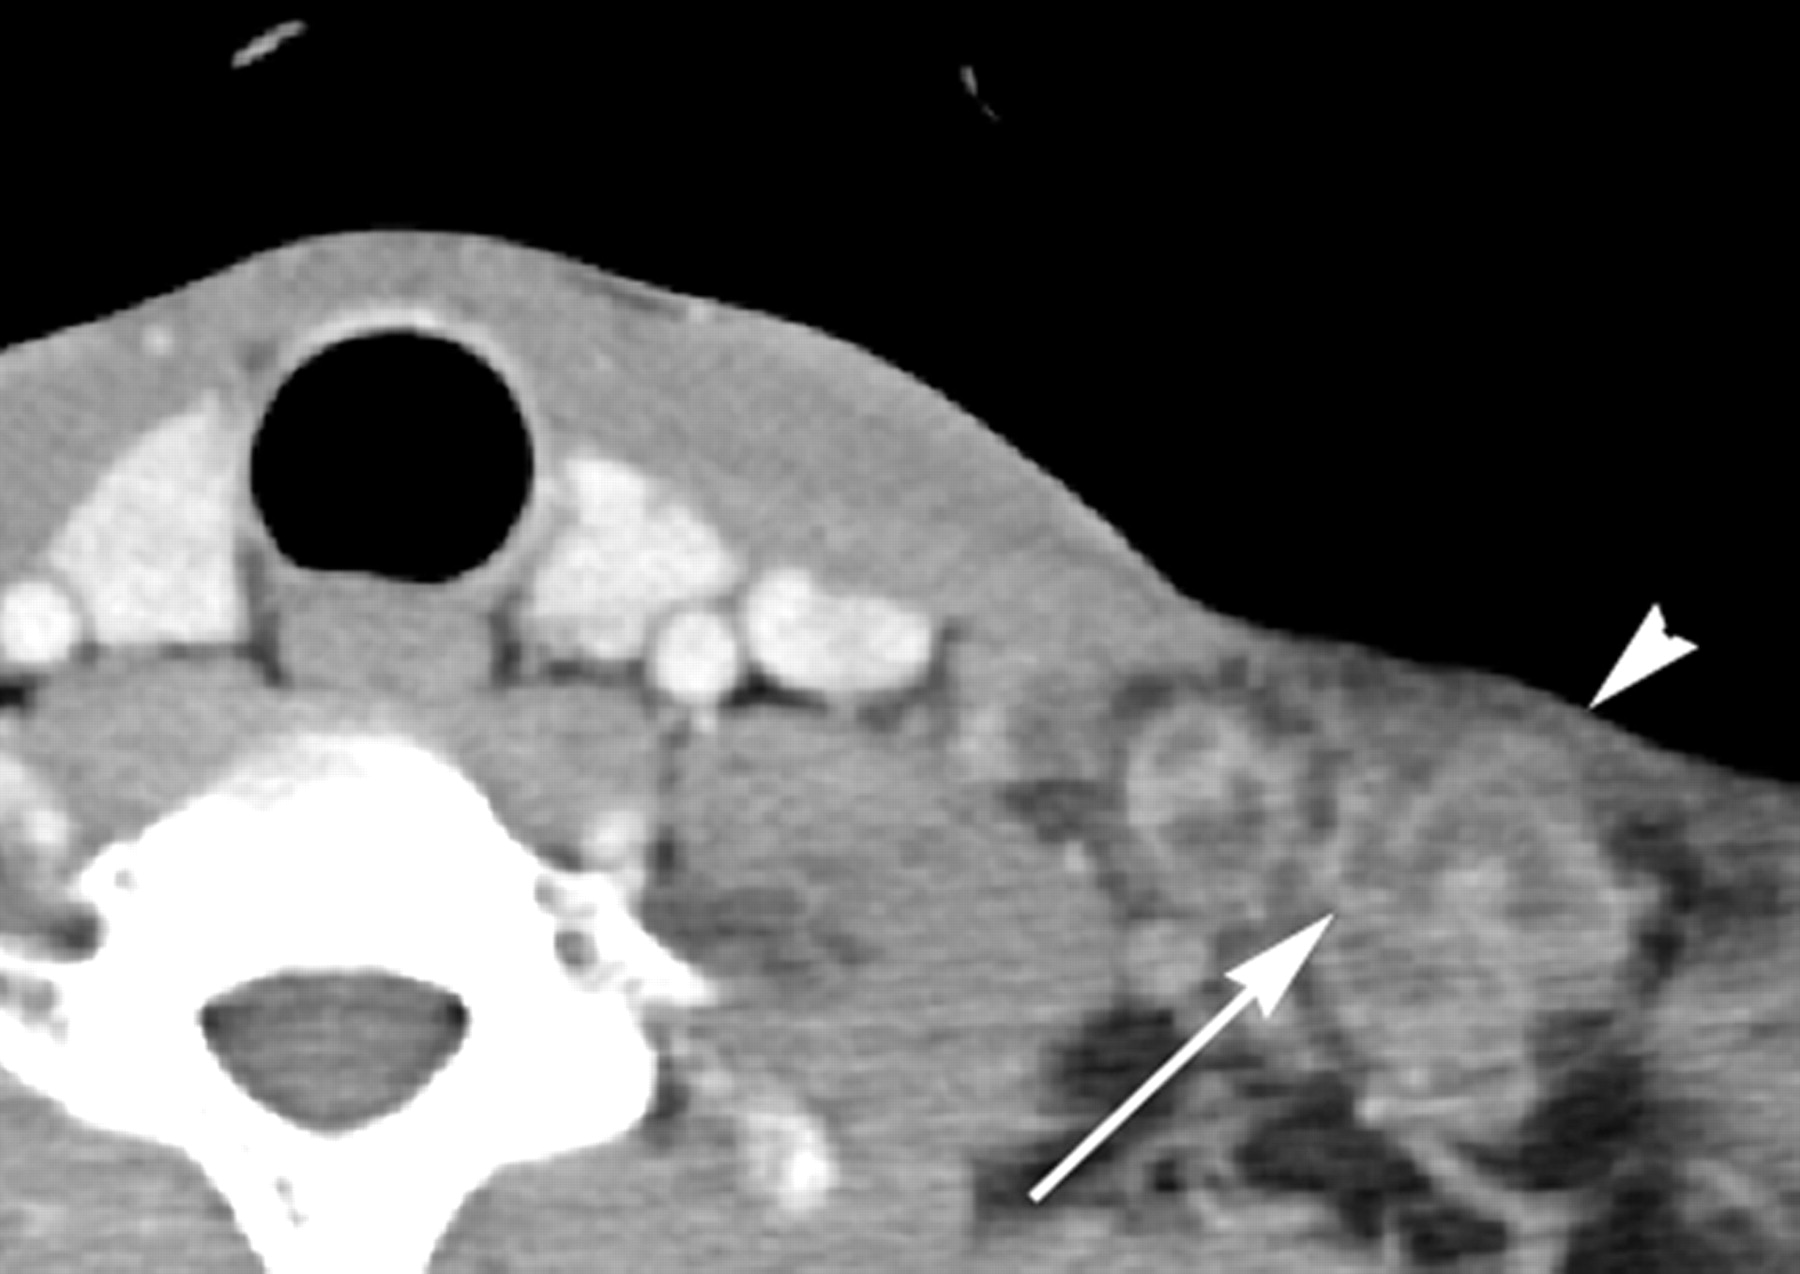
TL in a 37-year-old man. Transverse CT scan shows several lymph nodes with necrotic foci. The larger one (arrow) has multiple necrotic foci (not shown in this figure) with well-defined margins and a severe extent of nodal necrosis. Note the obliteration of perinodal fat around the lymph node (arrowhead). The CTN and CTN/M were 22 HU and 0.4, respectively.
Quantitative Analysis of CT Images in KD and TL
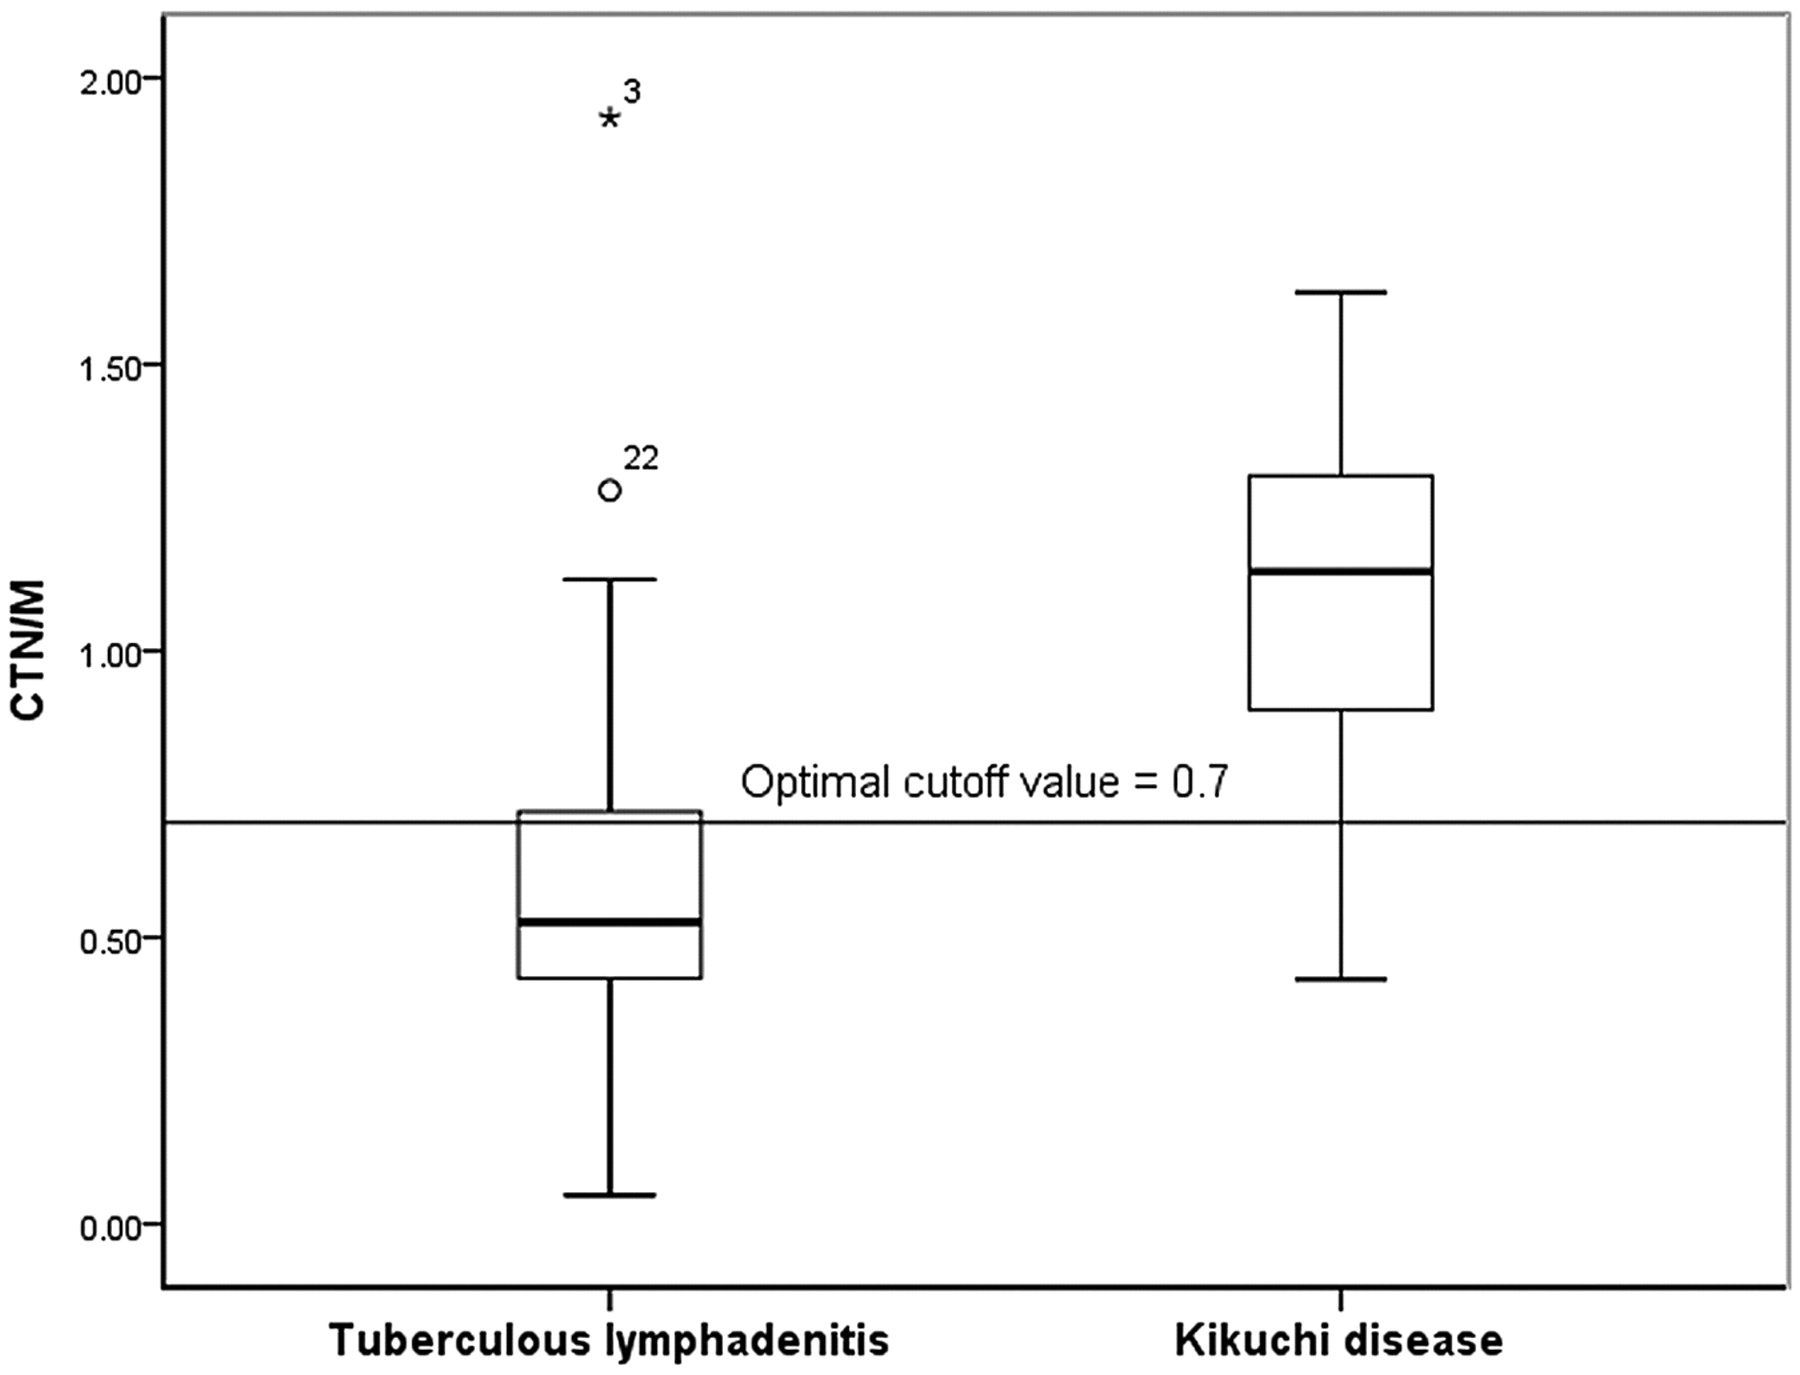
The mean CTN of KD (70.3 ± 18.01) was significantly higher than that of TL (37.4 ± 20.00, P = .000) (Fig 7). The mean CTN/M of KD and TL was 1.1 ± 0.27 and 0.6 ± 0.31, respectively; the value for KD was significantly higher than that for TL (P = 000) (Fig 8).

Graph of CTN of TL and KD. The mean CTN of KD (70.3 ± 18.01) is significantly higher than that of TL (37.4 ± 20.00). When 44.5 was used as the cutoff value for the CTN, a sensitivity of 89.5% and a specificity of 86.0% were achieved for differentiating KD from TL.

Graph of CTN/M of TL and KD. The mean CTN/M of KD (1.1 ± 0.27) is significantly higher than that of TL (0.6 ± 0.31). When 0.7 was used as the cutoff value for the CTN, a sensitivity of 94.7% and a specificity of 76.7% were achieved for differentiating KD from TL.
In ROC curve, we used cutoff values of 44.5 and 0.7 for CTN and CTN/M, respectively, for differentiation of KD from TL, yielding sensitivities of 89.5%, and 94.7% and specificities of 86.0% and 76.7%, respectively (Figs 7 and 8). The areas under the ROC curves of CTN and CTN/M were 0.917 and 0.854, respectively.
CTN and CTN/M were dichotomized as thresholds of cutoff values through ROC. Significant differences between the 2 diseases were observed in CTN and CTN/M, irrespective of whether they were considered continuous or binary variables (Table 2).
Diagnostic Accuracy of Independent Predictors
Multivariate logistic regression analysis was performed to determine independent predictors of each feature that were statistically discriminative between KD and TL in univariate analysis. The results identified the margins of necrotic foci as an independent predictor for differentiation of KD from TL (odds ratio, 44.46; P = .003).
Using the indistinct margins of necrotic foci to differentiate KD from TL, we found the sensitivity, specificity, accuracy, and positive and negative predictive values to be 79.2%, 80.0%, 79.7%, 67.9%, and 87.8%, respectively.
Discussion
Although they are uncommon in Western countries, KD and TL are prevalent in Asian countries. Because these diseases have quite different treatment regimens and clinical courses, it is important to differentiate them.6 To our knowledge, this is the first study in which patterns of nodal necrosis on CT of KD and TL were analyzed objectively and quantitatively. Our results indicate that mild-to-moderate multiple necrotic foci with indistinct margins and higher necrosis attenuation indices (CTN and CTN/M) without calcification were statistically significant parameters in the differentiation of KD from TL. In addition, multivariate logistic regression analysis revealed indistinct margins of necrotic foci as an independent predictor for differentiating KD from TL.
Many previous studies indicated that most cases of TL showed nodal necrosis on CT images.10–12 However, few studies indicated that CT images revealed nodal necrosis as an unusual feature of KD.1,9 Kwon et al1 reported that 16 (16.7%) of 96 patients with KD had nodal necrosis. In our study, 24 (94.5%) of 28 patients with KD showed nodal necrosis on CT images, which is more frequent than that observed in previous studies. Because KD is also called histiocytic or subacute necrotizing lymphadenitis due to its histopathologic features,15,16 patients with KD frequently have nodal necrosis on CT. Different CT scanners and imaging-acquisition parameters (ie, section thickness, tube voltage, and current) may contribute to differences in the frequency of nodal necrosis on CT.
In our study, the presence of indistinct margins of necrotic foci was an independent predictor for differentiating KD from TL. This may be explained by the pathologic features of KD and TL. KD is characterized by coagulation necrosis, accompanied by apoptosis, which includes various cells such as eosinophilic fibrinoid deposits and karyorrhectic debris, with proliferation of histiocytes and immunoblasts surrounding the area of necrosis,2,15,16 whereas TL is characterized by caseation necrosis surrounded by granulation tissue.17
Our data showed that necrosis attenuation for KD was significantly higher than that for TL. The CTN/M showed similar results. Because it was obtained avoiding bias due to enhancement differences among CT scans, the results supported the suggestion that the necrosis attenuation for KD was higher than that for TL. Coexisting brightly eosinophilic fibrinoid deposits in nodal necrosis may have explained the higher necrosis attenuation of KD.
In our study, KD showed larger numbers of necrotic foci within nodes that were less extensive than those in TL. There are several possible explanations for this finding. First, KD and TL have different pathologic features. Second, whereas TL is painless, KD is painful and accompanied by systemic symptoms, which may lead patients with KD to undergo CT earlier than those with TL.
In our study, 22 (91%) of 24 patients with KD showed perinodal infiltration, which is a characteristic feature of KD.1 However, we also observed perinodal infiltration frequently in TL (34/45, 76%). This was consistent with the results of a previous study10 in which 75% of TL studies showed obliteration of the surrounding fat plane. This is possible because destruction of the lymph node capsule causes periadenitis beyond stage 3, when active TL is divided into 4 stages pathologically, depending on the duration of the disease.17,18
In our study, calcification within the nodes was observed only in TL. Fibrocalcification of nodes is one of the patterns of TL.10,17,19 Therefore, it was suggested that calcification within lymph nodes is a characteristic feature of TL, aiding in the differentiation of this disease from other diseases including KD. In this regard, CT had advantages over MR imaging in differentiating KD and TL because MR imaging has only a limited ability to depict nodal calcification.20
There were some limitations to this study. First, imaging analysis was based only on the largest lymph node containing necrotic foci, though multiple lymph nodes per patient were affected; these missing data may have biased our results. The second limitation of our study was the relatively small sample size of patients with KD and TL for demonstrating differences between the 2 diseases. This may have led to limits in obtaining exact predictive values. The small sample size of the 2 diseases included in this study was because patients with TL and KD are not always diagnosed surgically, and even within groups of patients with KD, a large number of patients with KD have self-limited disease before diagnostic tools are applied. As a result, there may have been selection bias. Third, technical limitations may have affected our results. The small size of regions of interest for the necrotic portions measured in the present study may have explained a larger variability in measurements. Finally, CT scanners of 2 different resolutions (16- and 64-detector CT) were used.
Conclusions
The characteristic patterns of nodal necrosis on CT of KD were mild-to-moderate multiple necrotic foci with indistinct margins and higher necrosis attenuation indices (CTN and CTN/M) without calcification within the nodes. Furthermore, the presence of indistinct margins of necrotic foci was an independent predictor for differentiation of KD from TL, yielding 79.2% sensitivity, 80.0% specificity, and 79.7% accuracy.
Footnotes
-
Paper previously presented at: Annual Meeting of the Radiologic Society of North America, November 28–December 3, 2010; Chicago, Illinois.
References
- Received February 17, 2011.
- Accepted after revision April 30, 2011.
- © 2012 by American Journal of Neuroradiology
In this issue


Jump to section
Related Articles
Cited By...
- No citing articles found.