
Abstract
BACKGROUND AND PURPOSE: Recent literature shows an increasing portion of imaging studies being conducted and interpreted by nonradiologists, especially across the modalities with the highest RVUs. We examined the trends in the Medicare technical charges for private office neuroradiology studies submitted by subspecialists to identify utilization trends among MR and CT scanner owners or lessees over the last decade.
MATERIALS AND METHODS: The number of neuroradiology studies performed on MR and CT machines owned or leased in private offices was determined from the CMS PSPSMF for 1998–2008. Studies billed through technical and global charges were aggregated. Utilization rates and utilization rate CAGRs were computed by specialty and by imaging study.
RESULTS: Between 1998 and 2008, MR studies grew by a factor of 2.5 and CT studies grew by 2.1. In 2008, radiologists charged the technical/global fee in 1,386,669 (56.6%), neurologists in 82,360 (3.4%), neurosurgeons in 29,218 (1.2%), multi/IDTF in 617,933 (25.2%), and other specialists in 334,843 (13.7%) of neuroradiology cases. Changes from the 1998 base rate to the 2008 rate per 1000 Medicare beneficiaries were 24.1 to 39.7 for radiologists, 1.03 to 2.4 for neurologists, 0.15 to 0.84 for neurosurgeons, 2.2 to 17.7 for multi/IDTF, and 1.3 to 9.6 for other specialists. All specialties, except for multi/IDTF, showed greater MR utilization increases than CT. Neurology (CAGR of 10.6%), neurosurgery (22.1%), multi/IDTF (23.2%), and other specialists' (24.6%) MR growth outpaced that of radiology's (5.3%).
CONCLUSIONS: All nonradiologists showed greater overall utilization growth in private office neuroradiology than did radiology. Also, nonradiologists generally showed greater utilization increases in MR than CT. Radiologists' private office neuroradiology technical fee share shrank from 83.6% to 56.6% between 1998 and 2008.
Abbreviations:
- ACR
- American College of Radiology
- CAGR
- compound annual growth rate
- CMS
- Centers for Medicare and Medicaid Services
- CPT-4
- Current Procedural Terminology, 4th edition
- DRA
- Deficit Reduction Act
- multi/IDTF
- multidisciplinary and independent diagnostic testing facility
- PSPSMF
- Physician/Supplier Procedural Summary Master File
- RVU
- relative value unit
Numerous publications have explored the use and impact of nonradiologists on imaging services in the United States.1–13 Most of the literature shows an ever-increasing proportion of imaging studies being conducted and interpreted by nonradiologists across modalities with the highest RVUs.5,6,8–11,13,14 Prior analyses have shown that when the imaging studies are owned and/or interpreted by nonradiologists, the rate of growth in utilization far exceeds that of the studies referred to and performed by radiologists.5,6,8–11,13,14 These data raise the issues of vested self-interest and potential overutilization of imaging, leading to escalation of health care costs.
The extent to which neurologist and neurosurgeon MR imaging and CT scanner owners and lessees have penetrated the market for private office cross-sectional neuroradiology is currently unknown. An assessment of the impact of such self-referral on neuroradiology studies, and the potential for overutilization by nonradiologists, has recently been published by neurologists in a self-directed survey.15 However, no one has analyzed the billing records for trends in neuroradiology studies performed in the private office setting by nonradiologists.
In this study, we looked at the trends in utilization of neuroradiologic CT and neuroradiologic MR, including brain/head and neck and spine examinations, among CT and MR scanner owners or lessees within the Medicare patient population seen at private offices over a recent decade (1998–2008). We looked at the overall market trends and utilization patterns for radiologists, neurologists, neurosurgeons, and other specialists for all cross-sectional neuroradiology as well as by imaging type. We hypothesized that nonradiologist equipment owners or lessees—specifically, neurologists and neurosurgeons—have been increasing their market penetration in the private office setting from 1998–2008.
Materials and Methods
Study Population
We utilized the CMS PSPSMFs for 1998–2008. These files are aggregations of the billing-claim records for Medicare Part B for all fee-for-service beneficiaries and are the most recent data available. The PSPSMFs contain data for approximately 85% of the total Medicare population and were used in their entirety in our study. The PSPSMFs are public-use files that do not contain person-specific identifiers and, thus, the secondary analyses of these data are exempt from the institutional review board approval process. The PSPSMFs provide counts of services categorized by procedure code (CPT-4 or Level 3 Healthcare Common Procedure Coding System), procedure modifier, specialty of the provider, and place of service.
Data Selection
MR and CT examinations of the brain, head and neck, and spine performed in the private office setting (including freestanding imaging centers) were investigated by including all of the relevant CPT-4 imaging study codes. Four imaging categories were collated: 1) head CT (comprising CT examinations of the brain, head and neck, and head and neck CT angiograms), 2) spine CT (containing CT studies of all spinal levels), 3) head MR/MRA, and 4) spine MR.
In the private office setting, the owner or lessee of the imaging equipment files a global claim when he or she performs and interprets the study or a technical claim when he or she subcontracts the interpretation of the study to another provider. Because our objective was to look at the patterns of neuroradiology utilization among the CT and MR physician owners or lessees, we aggregated global and technical charges only from the Medicare Part B payment listings for the relevant CPT-4 codes. Professional fees were not included in order to prevent double counting. Thus, this is a study of performance/technical fees, not interpretation/professional fees.
Neuroradiology utilization was examined overall and for 5 physician categories: radiology, neurology, neurosurgery, combined multidisciplinary and independent diagnostic testing facility (multi/IDTF), and other specialists (containing the remaining physician specialties). Multi/IDTF is a separate category because providers in this group cannot be classified as members or nonmembers of the other groups.
Data Analysis
We looked at neuroradiology studies overall, as well as by specialty performed, in 1998 and in 2008 and calculated the relative percentage shares for each imaging category (head CT, spine CT, head MR, and spine MR) for each specialty. We also computed utilization rates and utilization rate CAGRs for 1998–2005, 2005–2008, and 1998–2008 overall and by specialty category. Imaging utilization rates were calculated per 1000 Medicare beneficiaries by dividing the annual examination volume by the number of total beneficiaries during that year. This eliminates year-to-year variation due to changes in the beneficiary population. Finally, we also looked at the annual increases in the utilization rates for each imaging category, again, overall and by specialty.
To evaluate the effects of the 2005 DRA, which reduced reimbursement fees for private office radiology, we compared the 1998–2005 and 2006–2008 neuroradiology utilization rates between radiologists, neurologists, and neurosurgeons.
Confidence intervals were not calculated in our analyses, as the PSPSMF dataset is a complete population count and not a sample.
Results
In 1998, in the private office setting, a total of 929,385 neuroradiology studies were performed for Medicare patients: 230,975 (24.8%) of those examinations were head CT; 55,694 (6.0%) were spine CT; 303,266 (32.6%) were head MR; and 339,450 (36.5%) were spine MR. Radiologist owners/lessees carried out 777,349 (83.6%) of the neuroradiology studies; neurologists, 33,336 (3.6%); neurosurgeons, 4,730 (0.5%); combined multi/IDTF, 70,927 (7.6%); and other specialists, 43,043 (4.6%).
In 2008, 2,451,023 total neuroradiology studies were done: 569,481 (23.2%) were head CT; 126,603 (5.2%) were spine CT; 696,608 (28.4%) were head MR; and 1,058,331 (43.2%) were spine MR. Radiologists billed the global/technical fees for 1,386,669 (56.6%) studies: neurologists, 82,360 (3.4%); neurosurgeons, 29,218 (1.2%); multi/IDTF, 617,933 (25.2%); and other specialists, 334,843 (13.7%).
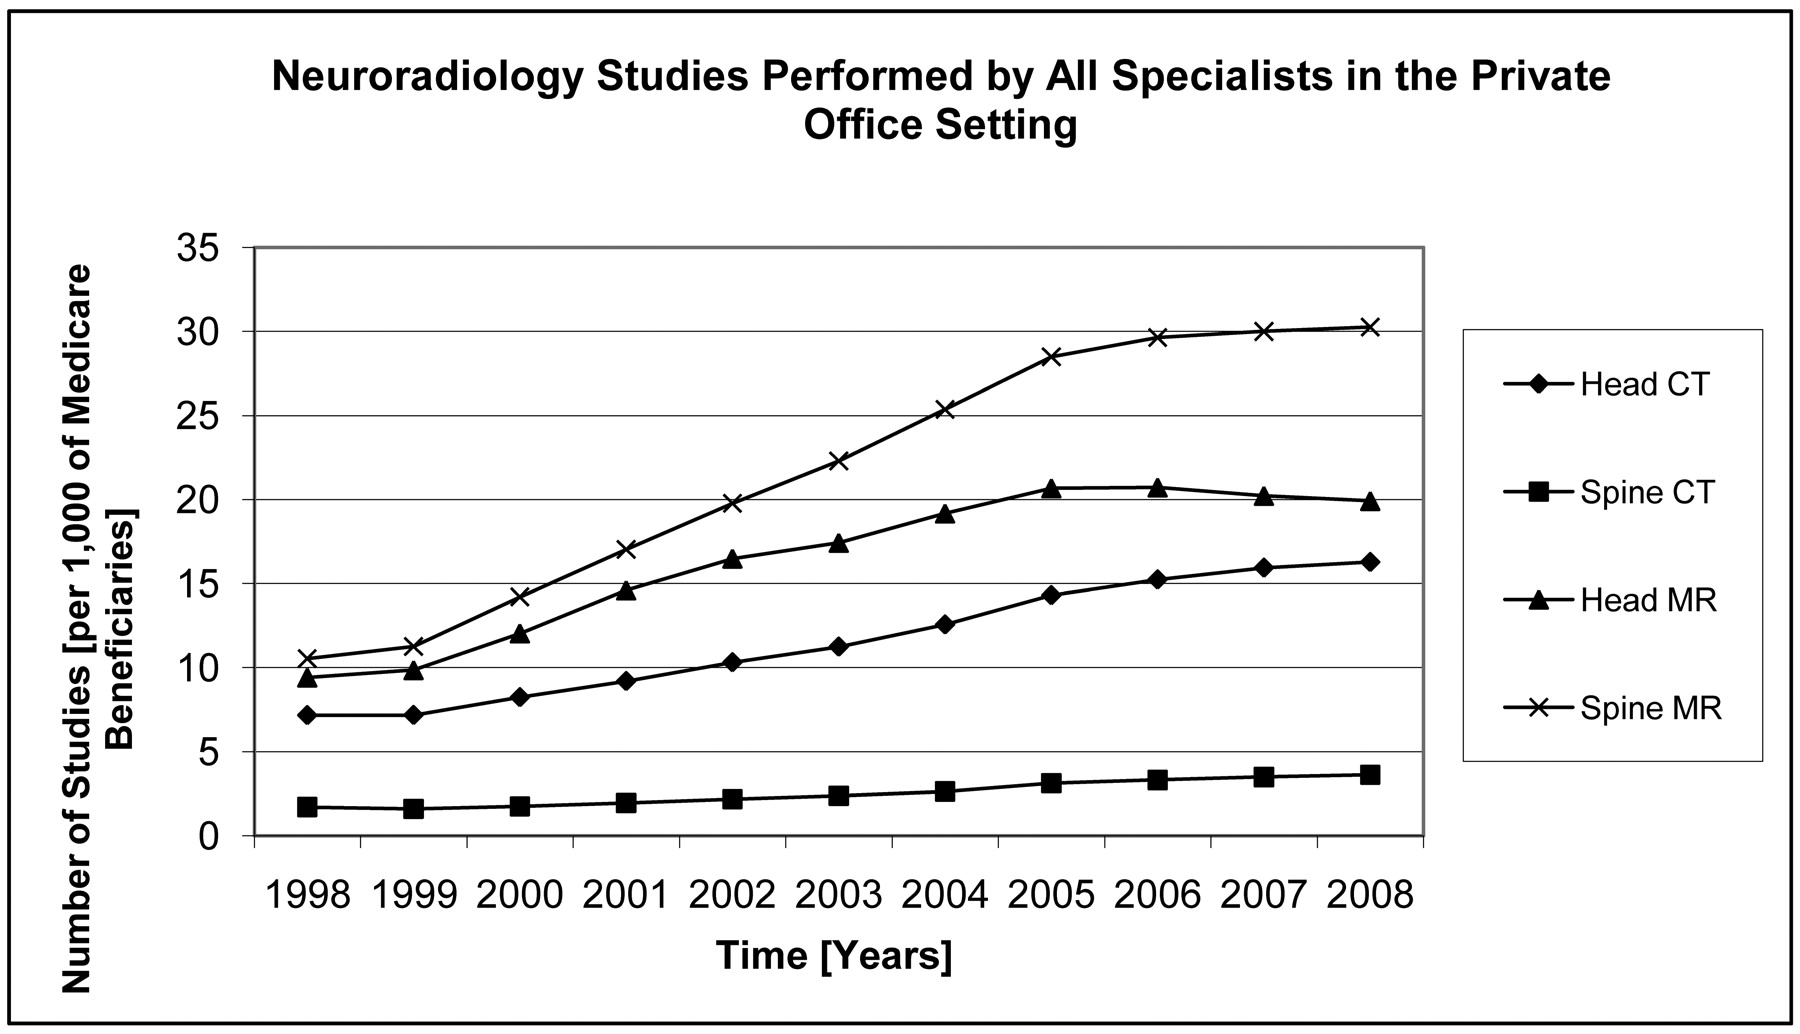
Overall utilization rates over time for head and spine CT and MR studies are depicted in Fig 1, and overall utilization rates and utilization rate CAGRs are shown in Table 1. During 1998–2008, spine MR not only remained the most frequently performed study (followed by head MR) but also represented a greater relative share of the total private office neuroradiology over time. Utilization rates for each neuroradiology study category increased: head CT grew 2.3 times; spine CT, 2.1 times; head MR, 2.1 times; and spine MR, 2.9 times. Most of the growth occurred between 1998 and 2005, with growth leveling off thereafter.

1998–2008 utilization rates for head CT, spine CT, head MR, and spine MR for all specialist equipment owners/lessees in the private office setting.
1998–2008 utilization rates and utilization rate CAGRs for head and spine CT and MR
The 1998–2008 private office utilization rates for all neuroradiology by physician category are shown in Fig 2, and utilization rates for radiologists, neurologists, and neurosurgeons by imaging category are presented in Fig 3, A-C.

1998–2008 utilization rates for all neuroradiology by specialty.
Radiologists saw utilization rate increases in all 4 imaging categories. For radiologists, the greatest utilization rate CAGR was observed in spine MR (9.2% during 1998–2005, but −0.5% during 2005–2008), which resulted in spine MR increasing from 36.6% to 40.6% of total neuroradiology performed by radiologists between 1998 and 2008. Although radiologists' head and spine MR volumes decreased from 2005–2008, overall MR CAGR for 1998–2008 was 5.3%. Radiologists carried out 24.1 neuroradiology studies per 1000 Medicare beneficiaries in 1998 and 39.7/1000 in 2008.

A, 1998–2008 utilization rates for head CT, spine CT, head MR, and spine MR for radiologist equipment owners/lessees in the private office setting. B, 1998–2008 utilization rates for head CT, spine CT, head MR, and spine MR for neurologist equipment owners/lessees in the private office setting. C, 1998–2008 utilization rates for head CT, spine CT, head MR, and spine MR for neurosurgeon equipment owners/lessees in the private office setting.
Neurologists' head CT utilization rate decreased (CAGR of −2.4%, 1998–2008), spine CT utilization remained constant (CAGR of 0%, 1998–2008), and head and spine MR utilization rate increased (head MR > spine MR, CAGRs 11.1% and 9.6%, 1998–2008, respectively). In 1998, head MR comprised 45.9% of neurologists' total neuroradiology, and by 2008, it accounted for 58.8%. Since 2005, however, neurologists saw increases in all 4 imaging categories, with utilization rate CAGRs in the 6%–10% range. Neurologists performed 1.0 neuroradiology studies per 1000 Medicare beneficiaries in 1998 and 2.4/1000 in 2008.
Neurosurgeons saw growth across all 4 imaging categories, more in MR than in CT and more in spine than in head imaging. Compared with neurologists, neurosurgeons were billing the global/technical fees for more spine MR (56.8% of total neuroradiology versus neurologists' 32%) than head MR (22.3% of total neuroradiology versus neurologists' 58.8%). Neurosurgeons' utilization rate CAGRs were in the 10% to 20% range per year; however, they, similarly to neurologists, started with relatively low utilization rates per 1000 Medicare beneficiaries in 1998 and therefore accounted only for a fraction of all neuroradiology performed in 2008. Neurosurgeons billed for the performance of 0.2 neuroradiology studies per 1000 Medicare beneficiaries in 1998 and 0.8/1000 in 2008.
During 1998–2008, multi/IDTFs had total neuroradiology CAGR of 23.2%, and other specialists, 21.7%. Multi/IDTFs billed the global/technical fees for CT and MR at approximately the same rate, but there was more spine growth than head imaging, and other specialists exhibited stronger growth in MR than CT, and in spine than in head imaging. Multi/IDTFs performed 2.2 neuroradiology studies per 1000 Medicare beneficiaries in 1998 and 17.7/1000 in 2008. Other specialists carried out 1.3 neuroradiology studies per 1000 Medicare beneficiaries in 1998 and 9.6/1000 in 2008.
Table 2 depicts the overall neuroradiology utilization CAGRs for radiologists, neurologists, and neurosurgeons for 1998–2005 and 2006–2008, the time intervals before and after the 2005 DRA.
Pre- and post-2005 DRA total neuroradiology CAGRs for radiologists, neurologists, and neurosurgeons
Discussion
In the private office setting, the number of head and spine CT and MR studies performed in the Medicare patient population has more than doubled between 1998 and 2008. However, not all of the studies were growing at the same pace. MR grew faster than CT, and spine MR grew faster than head MR.
During 1998–2008, radiologists, neurosurgeons, multi/IDTFs, and other specialists each saw growth in their total global/technical fees for neuro CT and MR, while neurologists did so only in head and spine MR. Between 1998 and 2008, neurologists' head CT utilization rate decreased and spine CT utilization rate remained unchanged. For radiologists, neurologists, neurosurgeons, and other specialists, MR utilization rate has increased the most; however, neurologists and neurosurgeons saw slightly faster growth in head MR and radiologists and other specialists in spine MR. Despite seeing the greatest growth in head MR, most of the neurosurgeons' private office neuroradiology remains spine MR.
In 1998, radiologists performed 83.6% of total private office neuroradiology, compared with 56.6% in 2008. The lost market share was captured by multi/IDTFs and other specialists, and marginally by neurologists and neurosurgeons.
Our observations suggest that during 1998–2008, nonradiologist equipment owners/lessees have been increasing their market penetration in private office neuroradiology. Furthermore, nonradiologists have been preferentially gaining ground in the highest RVU imaging modalities, growing faster in MR than in CT.
In this study, we analyzed billing records for global and technical charges, and did not look at professional charges, which are reimbursed for interpretation of studies. We did not explore the extent to which nonradiologist equipment owners/lessees entered the neuroradiology interpretation market for professional fees or the extent to which nonradiologists contract radiologists for interpreting the neuroradiology studies for which they charge the technical fees.
As owner/lessees, nonradiologists are able to capture technical fees for performed procedures, which are higher than professional fees reimbursed for the interpretation of studies. Technical fee to professional fee ratios range from 3.95 to 4.21 for neuroradiologic CT and from 4.23 to 5.86 for neuroradiologic MR, according to the Highmark Medicare online fee calculator.16
Our results do not come as a surprise, as there are numerous other reports documenting the recent growth in high RVU imaging utilization in the private office setting among nonradiologists at a pace greater than that of radiologists.5,10,11,13 During 1998–2002, in the private office setting, radiologists saw growth in radionuclide myocardial perfusion imaging utilization of 16%, while cardiologists increased their volumes by 101%.5 Between 2000 and 2005, all of radiologists' private office MR imaging examinations (non-neuroradiology and neuroradiology) increased by 83%, compared with a 254% increase experienced by nonradiologists,10 and during 2001–2006, all of radiologists' private office CT studies (non-neuroradiology and neuroradiology) increased by 85% in contrast to a 263% growth seen among nonradiologists.11 Also, from 2002 through 2007, radiologists saw growth in their private office PET studies by 259%, while, during the same time period, nonradiologists increased their PET business by 737%.13
Between 2000 and 2005, the growth in Medicare MR imaging examinations by nonradiologists was driven by 10 specialties, arranged according to their relative share of the total MR imaging, from greatest to least: orthopedic surgery (volume increase of 408%); neurology (171%); primary care (242%); internal medicine subspecialties, excluding cardiology (1397%); neurosurgery (309%); pathology/rehabilitation medicine (550%); radiation oncology (253%); cardiology (762%); anesthesiology (1972%); and other surgeons (101%).10 Similarly, the 2001–2006 growth in Medicare CT examinations by nonradiologists, again arranged based on their relative share of the total CT imaging, from greatest to least, was as follows: primary care (volume increase of 215%); internal medicine subspecialties, excluding cardiology, medical oncology, and nephrology (395%); urology (1631%); cardiology (2825%); medical oncology (289%); other surgeons (355%); radiation oncology (191%); neurology (55%); nonphysician practitioners (810%); and vascular surgeons (3107%).11 These and other studies6,8 suggest that, in large part, the steep utilization increases seen among nonradiologist imaging equipment owners/lessees are the result of self-referral practices.
The practice of self-referral is a consequence of a conflict of interest that exists when a physician refers a patient for an imaging study that is performed on equipment that the physician has a financial stake in. Federal regulations like Stark laws limit financially motivated imaging but, at the same time, legalize the “in-office ancillary services exemption,” which, presumably for patient convenience and speediness of care, allows physicians to install and own imaging equipment in their offices. However, recent analyses suggest that the in-office ancillary services exemption is a loophole for self-referral, with doubtful benefits to the patients.17–19 Sunshine and Phargavan examined the 2007 Medicare Research Identifiable Files to identify self-referring physicians and found that although 74% of self-referred conventional radiographs were performed on the spot, only 15% of CT and MR were done on the same day.17 Hughes et al compared duration of illness, imaging episode cost, and total episode of care cost between physicians who self-refer for imaging and physicians who refer for imaging to radiology facilities for 10 nonchronic conditions matched with commonly utilized diagnostic imaging studies.18 They found that self-referral was associated with shorter duration of illness in only 3 of 20 condition-diagnostic imaging pairs (radiographs for chest pain, respiratory illness, and sinusitis), and that it was also associated with higher episode imaging cost in 15 of 20, and higher total episode of care cost in 14 of 20, condition-diagnostic imaging pairs.18 Similarly, Baker showed a 2%-per-episode cost increase for orthopedists and a 6% increase for neurologists when they looked at outpatient practice patterns before and after MR imaging equipment was purchased for in-office use.19
For all specialties, most of the growth in neuroradiology utilization rates occurred between 1998 and 2005. Since 2005, the number of performed studies has flattened or even, in some cases, decreased (Figs 1–3). This may in part be due to the 2005 DRA (signed into law in February 2006 and took effect on January 1, 2007), which resulted in reduction of the technical fees for radiographic studies performed in the private office setting.20,21 Our results, similar to prior published data, show that the change in the reimbursement schedule disproportionally affected radiologists compared with nonradiologists.22 While both neurologists and neurosurgeons saw continued growth of neuroradiology, albeit at a slower pace compared with the pre-2006 values (Table 2), radiologists saw a decrease in the number of the total neuroradiology studies performed. There are 2 possible explanations behind this observation: new nonradiologists entered the business of imaging services or existing nonradiologist equipment owners increased their individual volumes through self-referral (an option not available to radiologists who do not have comparable access to patients).22
The purpose behind our paper and presentation of our data is not to sound the alarm that “the sky is falling” but rather to document the extent of nonradiologists' penetration of the private office neuroradiology, as well as to serve as a baseline for comparison of trends over time, given the current climate of cost control, self-referral concerns, and regulatory changes. Starting with the 2005 DRA, radiology became less profitable per case, a trend that will likely continue. Driven by sensitivity to cost, the governments (federal and local) and private insurers are taking steps to scrutinize the appropriateness of imaging examinations and indirectly limit self-referral. For example, the 2010 Affordable Care Act mandated disclosure of physicians' imaging equipment ownership interests.21 On January 21, 2011, Maryland's Court of Appeals upheld the state's 1993 anti-self-referral law that prohibits nonradiologists from referring patients for CT and MR imaging studies within their offices23 (though it is likely that the upheld law will be challenged legislatively). Private insurers started requiring all imaging sites to obtain external accreditation from organizations like the ACR or Intersocietal Accreditation Commission and also started requiring outpatient centers to provide multimodality imaging to qualify for interpretation reimbursements. Therefore, physicians who only have a CT or MR scanner are getting eliminated from potential reimbursement by many of the insurers. This factor is a trend in favor of lessening nonradiology ownership unless nonradiologists are willing to also support mammography, sonography, and plain films—the lower RVU modalities. Finally, major payers deployed radiology benefits management programs, which create “gatekeepers” for imaging studies (typically based on a modified version of the ACR Appropriateness Criteria), leading to limited growth in advanced imaging utilization.24–25
Because our study looks specifically at trends in neuro CT and MR, it can also serve as a baseline reference in future evaluations of the effects of the recently proposed neuroimaging fellowships for neurologists.26,27 As more neurologists complete their neuroimaging fellowships, one could conceive of more neurologists becoming imaging equipment owners/lessees. To date, only cardiologists have offered formal training in performing and interpreting of subspecialty imaging examinations, such as cardiac nuclear imaging, and as a result, at many locales, cardiologists have marginalized radiologists' role.28
Our data, inclusive of 2008, suggest variable effectiveness of the imaging utilization mechanisms described herein; however, at least for the time being, the overall trend appears to be against inappropriate self-referral. Many additional strategies and approaches addressing the challenges related to imaging utilization facing radiology today have been suggested.21,28–30 In our opinion, any proposed solution has to revolve around the principle of performing imaging examinations only for the benefit of the patient rather than financial gain. Referring physicians could be assisted by an objective computerized order-entry support system incorporating evidence-based imaging algorithms.31 The ACR has developed Appropriateness Criteria for imaging; however, not many clinicians are familiar with those,32 and thus an automated, easily accessible system would be helpful. The current laws allowing in-office self-referral imaging are based on the assumption that patient care is made more convenient and prompt. However, given the recent evidence,17,18 restriction of the in-office ancillary services exception to conventional radiography and sonography, and prohibition of CT, MR, and PET, makes sense. Finally, today's outpatient healthcare is largely based on a fee-for-service model, which incentivizes utilization. An alternative approach would involve bundled payments per episode of illness, or per member annual capitation, with quality of care benchmarks to prevent undertreatment.
Our study has a number of limitations. Although our data show an increased number of neuroradiology studies being billed for global/technical fees by nonradiologists, our study design is unable to distinguish between a demand-driven growth in private office neuroradiology (ie natural growth based on clinical need) and a supply-driven growth (ie, overutilization). Further research is needed to clarify whether nonradiologists are simply meeting the demand of markets not well served by radiologists or whether nonradiologists are artificially raising the need for private office neuroradiology by altering their own practice profile. All of our analyses are based on the PSPSMFs, which contain data for the nationwide Part B datasets for beneficiaries in the Medicare fee-for-service program (approximately 85% of the total Medicare population). Although, at many private practices, Medicare constitutes the largest single payer, Medicare reimbursements account for a portion of the total imaging volume, and, additionally, some practices exclude (ie do not accept) any Medicare patients. Therefore, our results may not accurately reflect utilization trends in every practice setting and may have limited generalizability. Also, it is important to note that some of the impressive growth rates that we calculated occurred among provider specialties (or in imaging categories), which had small, absolute volumes or market shares, and should therefore be interpreted with caution (ie addition of each new MR or CT scanner results in lower incremental growth, and, thus, small industry participants can grow at faster rates than large ones).
In our study, we focused on MR and CT imaging of the brain, head and neck, and spine but did not look at any other imaging studies. Given that we were interested in the neuroradiology trends among radiologists, neurologists, and neurosurgeons, we did not fully explore utilization trends within other relevant provider specialties like orthopedic surgery (spine imaging) or primary care (all neuroradiology). In our analyses, we treated the multi/IDTF specialist category as separate from radiology, though some radiologist equipment owners/lessees likely belonged to that category. In so doing, we hoped to present a “cleaner” set of results, acknowledging that we may be underestimating the actual market trends among all radiologists, including IDTF owners. Finally, we had no way to control or account for the effects of the recent changes in the reimbursements rates for outpatient imaging (DRA of 2005), which may explain some of the providers' growth propensity.
Conclusions
Neurosurgeons, multi/IDTFs, and other specialists who own or lease scanners have increased their utilization of private office CT and MR neuroradiology studies at a rate greater than that of radiologists between 1998 and 2008. Neurologists who own or lease scanners have increased their technical/global billings of private office MR neuroradiology studies at a rate greater than that of radiologists. All specialties, except for multi/IDTF, which exhibited equal growth in CT and MR, increased their MR utilization greater than CT; however, the MR growth of neurology, neurosurgery, multi/IDTF, and other specialists was greater than that of radiology. This was more evident in head MR for neurology and neurosurgery, and in spine MR for multi/IDTF and other specialists. Radiologists billed the technical fees for 56.6% of total private office neuroradiology studies in 2008 compared with 83.6% in 1998.
Footnotes
-
Results previously presented at: Annual Meeting of the American Society of Neuroradiology, June 4–9, 2011; Seattle, Washington.
-
Disclosures: David C. Levin—Consultant: HealthHelp, Details: paid as a consultant; Other Financial Relationships: OIA, Details: paid board member.
References
- Received March 21, 2011.
- Accepted after revision May 11, 2011.
- © 2012 by American Journal of Neuroradiology


