
Abstract
BACKGROUND AND PURPOSE: SAP is a rare lesion of the sinonasal cavity, which may be misdiagnosed as a benign or malignant neoplasm. The purpose of our study was to comprehensively evaluate the MR imaging features of SAP.
MATERIALS AND METHODS: Forty patients with SAP confirmed pathologically were retrospectively reviewed. Of the 40 patients undergoing MR imaging, 39 had postcontrast T1WI; 30, DCE MR imaging; and 17, DWI. The image features assessed included the location, shape, margin, size, signal intensity, and enhancement pattern on DCE MR imaging and ADC maps.
RESULTS: All 40 SAPs originated from the maxillary sinus, but the lesions frequently extended into the ipsilateral nasal cavity (38/40), toward the choana (19/40), and into the nasopharynx (8/40). The lesions demonstrated hypointensity on T1WI and heterogenous hyperintensity on T2WI. All 40 lesions showed a peripheral hypointense rim on T2WI. Postcontrast MR imaging revealed marked heterogeneous nodular and patchy enhancement. Progressive enhancement was found on DCE MR imaging in 30 cases. The TIC showed a steady enhancement pattern in 3 cases, a rapidly enhancing and slow washout pattern in 6 cases, and a rapidly enhancing and rapid washout pattern in 21 cases. On DWI, the mean ADC value was (1.40 ± 0.20) × 10−3 mm2/s.
CONCLUSIONS: Distinctive features of SAP on conventional MR imaging include internal heterogeneous hyperintensity and a peripheral hypointense rim on T2WI, as well as strong nodular and patchy enhancement on postcontrast MR images. The progressive enhancement on DCE MR imaging can also suggest the diagnosis.
ABBREVIATIONS:
- DCE
- dynamic contrast-enhanced
- ESS
- endoscopic sinus surgery
- SAP
- sinonasal angiomatous polyp
- TIC
- time-intensity curve
SAP is a relatively rare lesion, only accounting for 4%–5% of inflammatory sinonasal polyps.1 Without knowledge of the typical clinical presentation and the complete study of imaging findings, the entity tends to be clinically and radiologically confused with neoplastic processes and even malignancy.2
This entity has been described in the literature in different terms, including cavernous hemangioma,3⇓⇓⇓–7 organized or organizing hematoma,8⇓⇓–11 hematoma-like mass of the maxillary sinus,12 and SAP.1,2,13,14 This lesion is difficult to remove en bloc and is easily broken during excision, so the sampling inconsistencies related to lesional fragility are likely responsible for the wide variation in pathologic description and terminology.12 In addition, in China this entity is more often called “nasal polyp with hemorrhage and necrosis,” but it shares all the same clinicopathologic and imaging features of the above-mentioned 4 lesions. The generally well-known designation of SAP is used to name this lesion in our study.
The CT features of SAP have been broadly documented in the literature.3,8⇓⇓–11 The conventional MR imaging findings of SAP, however, have been described in only a few articles.2,4,8,13 In addition, its features on DCE MR imaging and DWI have not been systematically reviewed, to our knowledge. The purpose of this study was to describe not only the characteristics of conventional MR imaging but also those of DCE MR imaging and DWI in SAP.
Materials and Methods
The present study was approved by the institutional review board. The MR images of 40 patients with SAP proved by pathology in our hospital between February 2005 and June 2011 were retrospectively reviewed by 2 experienced head and neck radiologists, and findings were reached by consensus. These patients consisted of 21 males and 19 females, ranging in age from 11 to 80 years, with a mean age of 40.4 years. The duration of symptoms before referral to our hospital ranged from 2 weeks to 5 years (mean, 12.5 months). The most common 2 primary symptoms were nasal obstruction in 82.5% (33/40) and epistaxis in 57.5% (23/40). Other clinical manifestations included hyposmia, headache, visual acuity reduction, facial numbness, and epiphora. No patient had a history of craniofacial trauma. All 40 patients underwent surgical excision of the SAP by ESS with histologic examination of resected tissue.
Of the 40 patients undergoing MR imaging, 39 underwent postcontrast T1WI; 30, DCE MR imaging; and 17, DWI.
The MR imaging examinations were performed on a 1.5T MR imaging system (Signa twinspeed 1.5T with excite; Signa; GE Healthcare, Milwaukee, Wisconsin) with a head coil. Fast spin-echo pulse sequences were used in these patients. Conventional MR imaging consisted of axial and coronal T1WI and axial T2WI, as well as postcontrast T1WI in the axial, coronal, and sagittal planes. The imaging parameters were as follows—T1WI: TR, 500–600 ms; TE, 10–15 ms; T2WI: TR, 3000–3500 ms, TE, 120–130 ms, excitations, 2–4, echo-train length, 11–27, matrix, 256 × 256, FOV, 20 × 20 cm, section thickness, 4–5 mm, and interval gap 0.5 mm.
DWI was performed in 17 patients. Axial DWI was performed by using a spin-echo, single-shot echo-planar imaging sequence with a TR/TE of 6000/64–76 ms, a section thickness of 4 mm and intersection gap of 0.5 mm, a matrix of 128 × 128, an excitation of 1, and an FOV of 20 × 20 cm. The diffusion gradients were applied in 3 orthogonal directions (x, y, and z). Frequency-selective fat saturation was added to the DWI sequence to avoid severe chemical-shift artifacts. These images were acquired with b-values of 0 and 1000 s/mm2. The lesions were localized on the DWI and ADC maps on the basis of the conventional images. ROIs were placed on the solid components of the lesions. The ROIs were drawn as large as possible but avoiding significant partial volume effects and artifacts. Postprocessing of the ADC maps was reconstructed on an ADW 4.2 workstation by using FuncTool software (GE Healthcare). The ADC value of every lesion was the mean value of the ROIs acquired on all imaging sections that depicted the lesions.
Contrast-enhanced T1WI with frequency-selective fat saturation was acquired in the optimal plane after DCE MR imaging. A rapid manual bolus intravenous injection (2 mL/s) of 0.1-mmol gadopentetate dimeglumine (Magnevist; Bayer Schering, Berlin, Germany) per kilogram of body weight was followed by a 10-mL flush with normal saline solution. DCE MR imaging was performed by using 3D fast-spoiled gradient-echo before conventional contrast-enhanced T1WI in 30 patients. Imaging parameters were the following: TR, 8.4 ms; TE, 4.0 ms; excitation, 1; matrix, 256 × 160; FOV, 20 × 20 cm; section thickness, 3.2 mm; interval gap, 0 mm. A total of 12 sets of dynamic images were obtained. Each set included 6 images and needed 13 seconds. The interval time was 12 seconds. The whole dynamic series took 5 minutes in all. After the dynamic scan, source images were transferred to the ADW 4.2 workstation for further analysis. In the maximal section of the lesions, the authors manually drew ROIs for the TIC to avoid cystic and necrotic areas. ROIs were approximately 10 mm2. To ensure accuracy, we chose several ROIs on the basis of lesion size. Concurrently, the change in signal intensity of a similar ROI placed on the masseter muscle was used for reference.
The classification of the DCE MR imaging TICs adopted in this study was proposed by Yabuuchi et al15: 1) Type I (steady enhancement pattern) appears as a straight or curved line, enhancement continues over the entire dynamic study; 2) Type II (rapidly enhancing and slow washout pattern) appears as a growing enhancement in the early stages and then has a sharp bend to form a plateau in the middle and later stages; and 3) Type III (rapidly enhancing and rapid washout pattern) appears as a growing enhancement during the early stage and then the signal intensity progressively decreases.
The analysis of MR images included the location, shape, margin, size, signal intensity, and enhancement pattern on DCE MR imaging and ADC maps. The signal intensity of the lesion was compared with that of brain gray matter. We also introduce the concept of the “progressive enhancement,” which means that the initial enhancement starts from 1 or multiple points in the lesion and the enhancing areas enlarge with time.
Results
The imaging features of 40 SAPs on conventional MR imaging, DWI, and DCE MR imaging are presented in the On-line Table. All 40 lesions arose from the maxillary sinus, and 38 also involved the ipsilateral nasal cavity. Sixteen lesions were located on the right side and 24 on the left side. The mean maximum diameter of the lesion was 39 mm, ranging from 10 to 76 mm. The lesion appeared as a lobular shape in 24 cases and an oval shape in 16 cases.
On MR imaging, all 40 lesions had well-circumscribed margins. The adjacent bony walls were thinned, especially the medial wall of the maxillary sinus in all cases. On T1WI, the lesion demonstrated isointense signal intensity in 6 cases and heterogeneous hypointense signal intensity in 34 cases (Fig 1A). On T2WI, the lesion showed high signal intensity surrounded by a peripheral hypointense rim in all 40 cases (Figs 1B, 2A, 3A, and 4A), and linear hypointense septa were also seen in 36 cases. Postcontrast MR images showed homogeneously and strongly enhancing masses with an unenhanced hypointense rim and septa. The enhancing regions were seen as patches in 16 cases (Figs 1C, 2B, and 3B) and multiple nodules in 23 cases, of which 13 produced the confluent lobular appearance (Fig 4B). The lesion extended posteriorly towards the choana in 19 cases, and 8 protruded into the nasopharynx (Fig 2A, -B). The typical inflammatory edematous polyps were present in the ipsilateral nasal cavity in 13 cases (Figs 3A, -B). Obstructive sinusitis, to varying degrees, was observed in all patients.

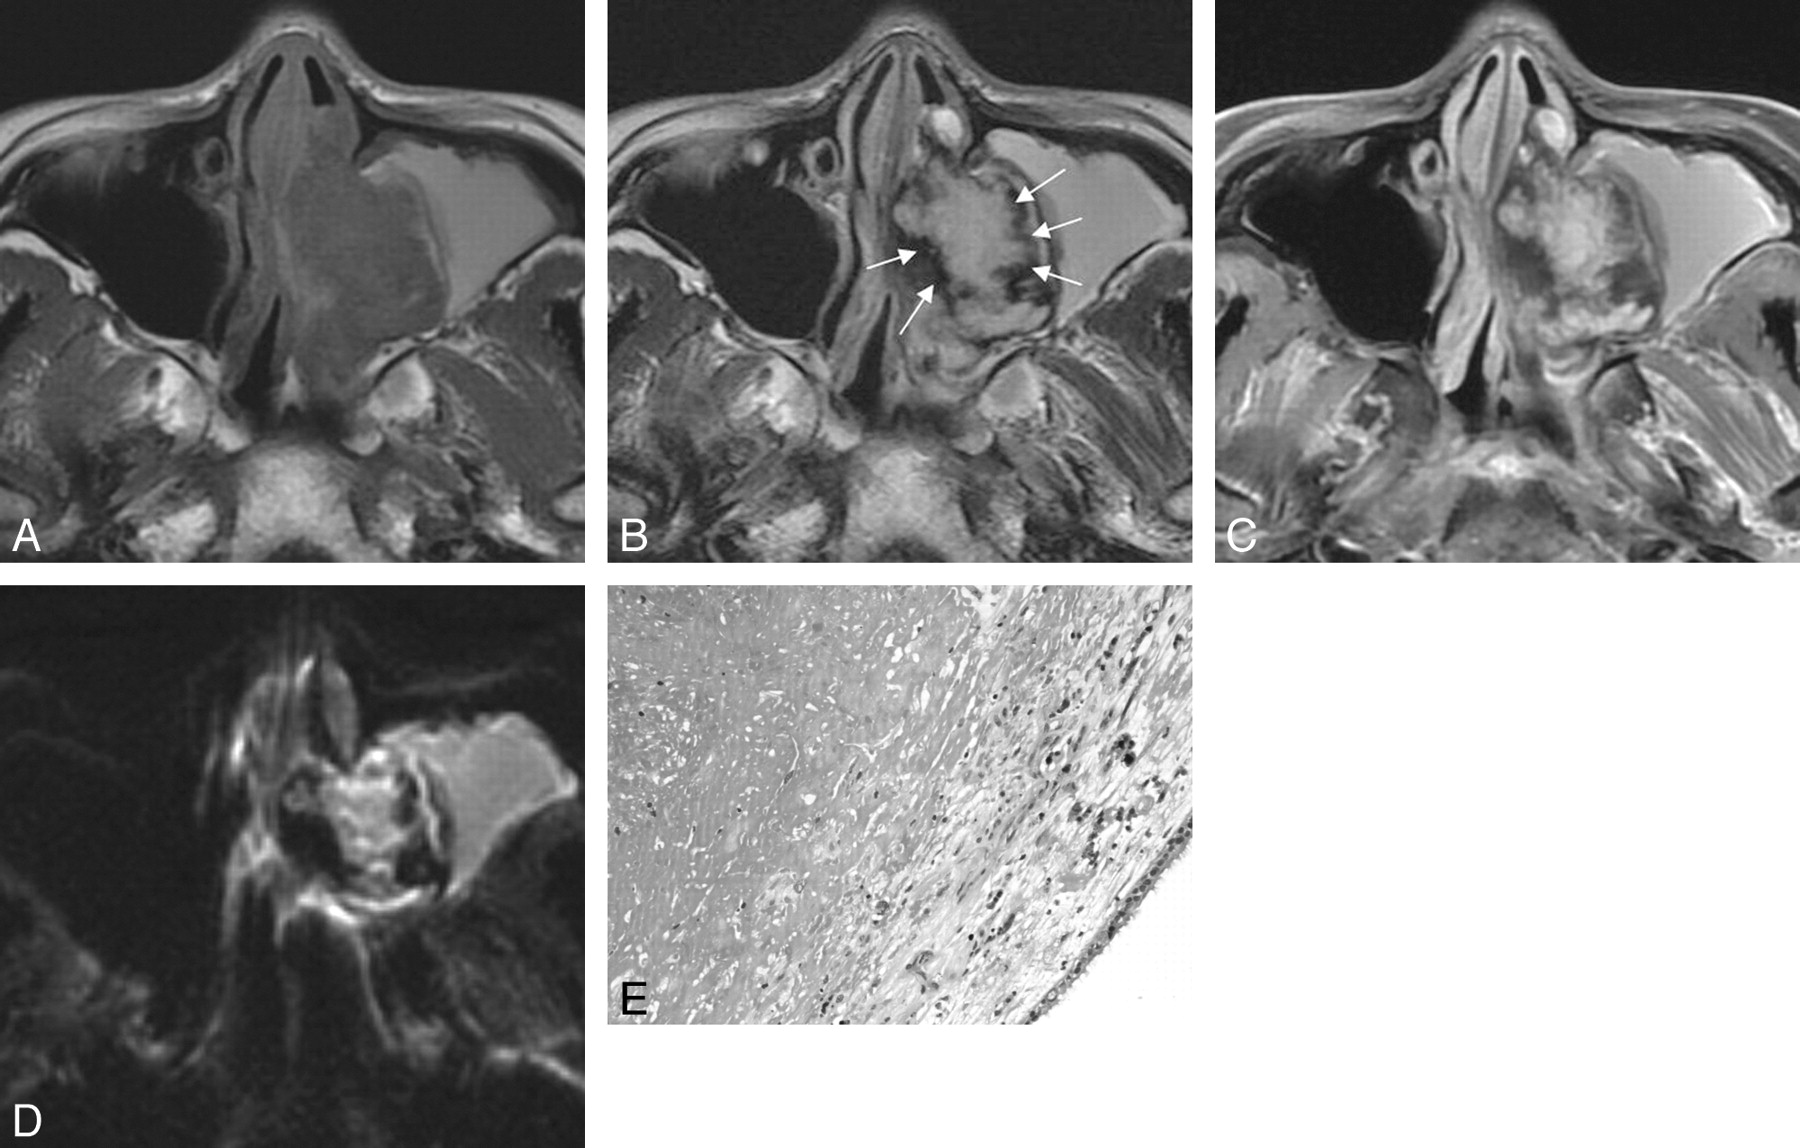
Case 36. Sinonasal angiomatous polyp in a 28-year-old woman. A, Axial T1WI shows a slightly hypointense lesion in left maxillary sinus and nasal cavity. B, Axial T2WI demonstrates a well-defined lesion, which shows hyperintense signal intensity centrally with a peripheral hypointense rim (white arrows). The hyperintense signal intensity in the ipsilateral maxillary sinus indicates obstructive sinusitis. C, Axial fat-suppressed contrast-enhanced T1WI shows the marked patchy enhancement with the nonenhanced hypointense rim. D, Axial DWI shows the mass of slightly high signal intensity with a peripheral low-signal-intensity rim. E, Photomicrograph shows numerous extravasated red blood cells, fibrosis, and thin-walled vessels. Scattered hemosiderin-laden macrophages and inflammatory cells are also seen (hematoxylin-eosin, original magnification ×200).

Case 33. Sinonasal angiomatous polyp in a 29-year-old man. A, Axial T2WI demonstrates a well-defined lobulated mass in the left maxillary sinus and nasopharynx. The lesion displays high signal intensity centrally with a peripheral hypointense rim (white arrows). Obstructive sinusitis in the ipsilateral maxillary sinus is observed as well. B, Axial fat-suppressed contrast-enhanced T1WI shows marked patchy enhancement, with no enhancement of the peripheral hypointense rim.

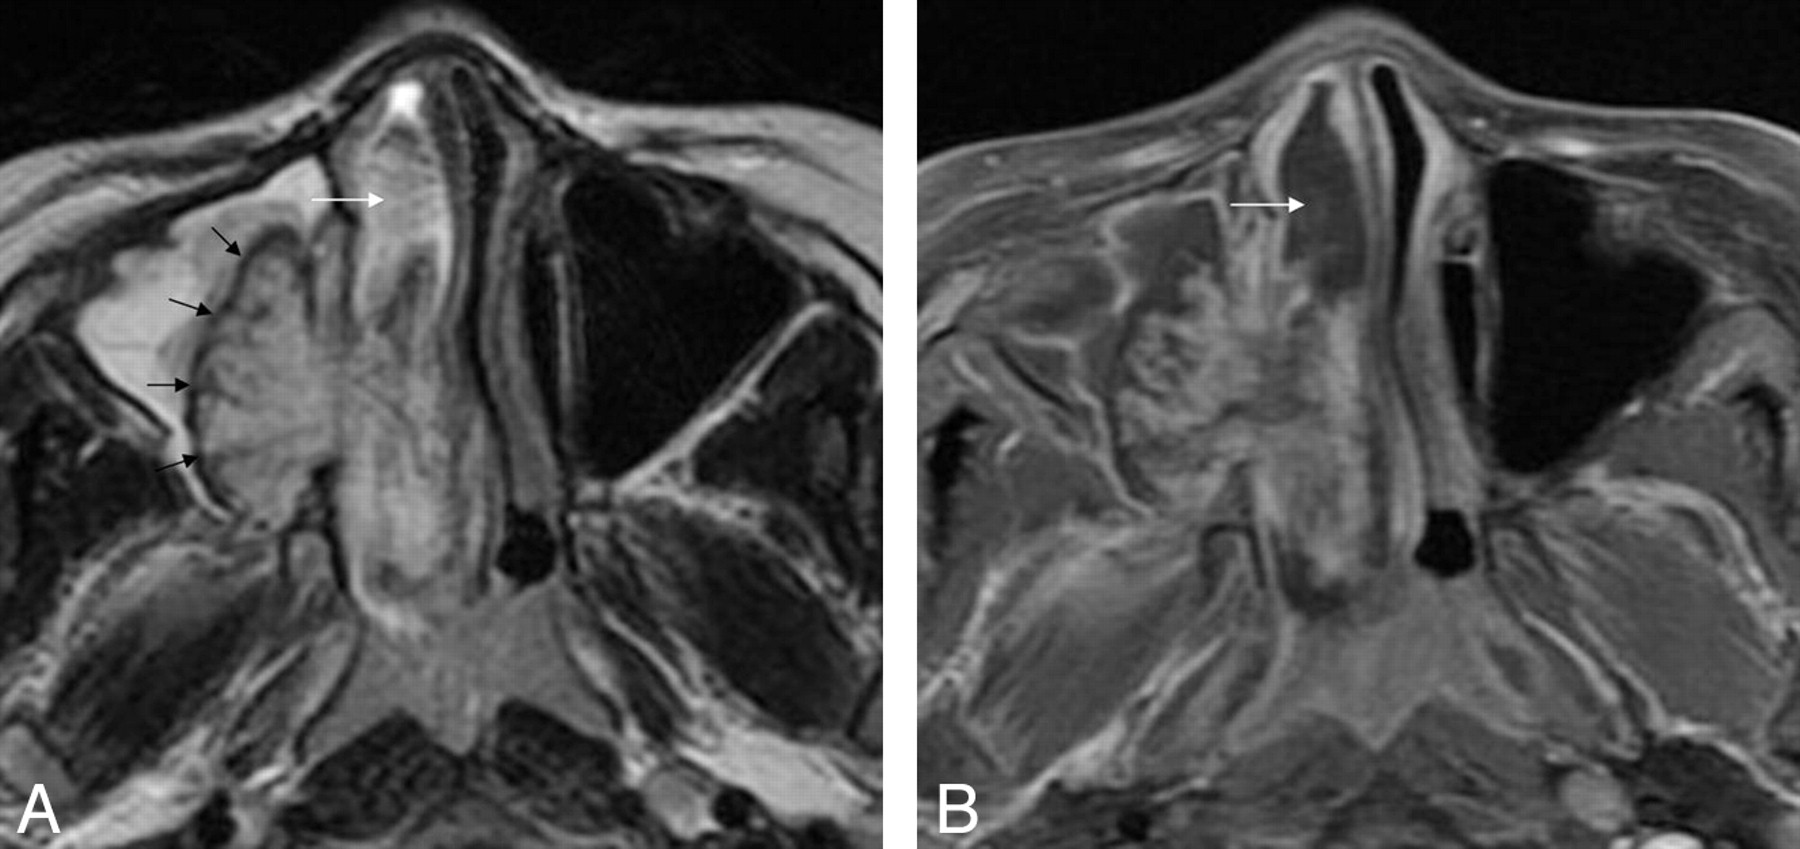
Case 12. Sinonasal angiomatous polyp in an 11-year-old boy. A, Axial T2WI demonstrates a well-defined lesion in right maxillary sinus and nasal cavity. The lesion is seen as high signal intensity with internal hypointense septa and a peripheral hypointense rim (black arrows). Obstructive sinusitis in the ipsilateral maxillary sinus is noted as well. There is an associated inflammatory edematous nasal polyp (white arrow). B, Axial fat-suppressed contrast-enhanced T1WI shows marked patchy enhancement with a peripheral nonenhanced hypointense rim. The inflammatory nasal polyp is unenhanced (white arrow).

Case 16. Sinonasal angiomatous polyp in an 80-year-old man. A, Axial T2WI shows a well-circumscribed lesion in right maxillary sinus and nasal cavity. The lesion reveals heterogeneous signal intensity with a peripheral hypointense rim and internal hypointense septa. B, Axial fat-suppressed contrast-enhanced T1WI shows marked lobular enhancement and confluent lobular appearance. A nonenhanced peripheral hypointense rim is noted. C, Coronal DCE MR image at approximately 50, 150, and 250 seconds of different time phases demonstrates the increasing enlargement of enhancing areas, namely the progressive enhancement pattern. D, The round cursor marks the ROI selected for the description of the TIC on DCE MR imaging. E, The corresponding TIC depicts a rapidly enhancing and rapid washout pattern (type III).
The characteristics of progressive enhancement were found on DCE MR imaging in 30 cases (Fig 4C). According to the classification of the TIC by Yabuuchi et al, 15 the TICs were compatible with type I in 3 patients, type II in 6, and type III in 21 (Fig 4D, -E).
Seventeen patients also underwent axial DWI. The lesions revealed isointense signal intensity in 3 cases and hyperintense signal intensity in 14 cases (Fig 1D). The hypointense signal-intensity rims were still seen in 17 cases (Fig 1D). The mean ADC value of the SAP was (1.40 ± 0.20) × 10−3 mm2/s.
Pathologic sections showed numerous extravasated red cells, fibrosis, and thin-walled blood vessels. Scattered hemosiderin-laden macrophages were seen in the lesions and were associated with recent hemorrhages. Inflammatory cell infiltration was also observed. No tumor cell was found (Fig 1E).
Discussion
Inflammatory sinonasal polyps are classified into 5 types: edematous, glandular, fibrous, cystic, and angiomatous,1 and the SAP is an uncommon subtype of inflammatory sinonasal polyp.
SAP is believed to be a derivative of the antrochoanal polyp.14 An antrochoanal polyp arises from the maxillary sinus and protrudes through the sinus ostium into the nasal cavity. The polyp may then extend posteriorly toward the choana and sometimes into the nasopharynx. Because of the confined anatomic conditions in the sinus ostium, the polyp is vulnerable to vascular compromise: The persistent compression leads to dilation and stasis of feeder vessels in the polyp, edema and infarction ensue, and reactive and reparative changes with neovascularization and fibrosis evolve into the final SAP.
On the basis of our study, it was found that all lesions involved the maxillary sinus. Most lesions also involved the ipsilateral nasal cavity (38/40) and extended toward the choana (19/40) and into the nasopharynx (8/40). Moreover, 13 cases were associated with the inflammatory edematous polyps. The developmental pattern of SAP is consistent with that of an antrochoanal polyp. Therefore, we also supported the viewpoint of Batsakis and Sneige14 about the formation of an SAP.
In our study, the age of patients ranged from 11 to 80 years, with a mean age of 40.4 years, and there was slight male predilection. The duration of symptoms before referral to our hospital ranged from 2 weeks to 5 years (mean, 12.5 months). As in the literature,9⇓⇓⇓–13 the most common symptoms were nasal obstruction and epistaxis. Presently, ESS is a very useful and well-accepted approach for the treatment of sinonasal masses. In our study, all lesions were completely resected by using ESS, and no patient had evidence of recurrence during the follow-up period.
The histopathologic admixture of neovascularization, fibrosis, and hemorrhage accounts for the inhomogeneous signal intensity on MR imaging. During the ESS, the lesion usually had a brownish appearance, which suggested that the surface of the lesion was covered by old hemorrhage. Therefore, the peripheral low-signal-intensity rim on T2WI was presumably the hemosiderin deposit indicative of old microhemorrhage. This signal-intensity feature typical of SAP was seen in all lesions. The neovascularized areas within the lesion demonstrated hyperintensity on T2WI, hypointensity on T1WI, and strong enhancement on postcontrast MR images. The high-signal-intensity area surrounded by peripheral hypointense rim is a characteristic finding of SAP.
DCE MR imaging can provide information related to tumor perfusion, microvascular permeability, and volume of the extracellular space, and such information may help to predict the histology of lesions.16 To the best of our knowledge, there have been no previously documented reports on DCE MR imaging features of SAP. According to our study, SAP was characterized by progressive enhancement on DCE MR imaging, which was seen in all 30 cases. On early imaging after the injection, 1 small point or portion of enhancement is initially noted, and the slow progressive accumulation of contrast medium continues within the dilated vascular spaces during the late venous phase. Subsequently, contrast enhancement persists in the delayed equilibrium phase, and the enhancing areas increasingly enlarge.17 Similar enhancement characteristics are shared by cavernous hemangiomas.18
With regard to the corresponding TIC, an unexpected result was that 70.0% (21/30) of lesions demonstrated the pattern of rapid enhancement and rapid washout (type III) frequently seen in malignancy. This may be because contrast medium fills 1 portion of the lesion during an early phase after administration of contrast medium and diffuses into adjacent spaces through the fibrous interstitium between spaces at a later phase. Thus, it results in a decrease in concentration of contrast media in the portion of the lesion filled by contrast media during the early phase. Additionally, it could also be attributed to the selected ROI in the study, which covered the greatest degree of early enhancement rather than the whole lesion. It was reported in recent studies on DCE MR imaging that this selection of ROI could better reflect the hemodynamic alterations of the lesion.19⇓–21 Hence, the TIC pattern should serve only as a diagnostic clue for reference until further studies of DCE MR imaging in this and other sinonasal masses can be performed.
DWI could be helpful in the differential diagnosis of SAP. Its usefulness in the sinonasal cavity is challenging because of susceptibility artifacts. Thus, there are only a few articles at present evaluating DWI applied to tumors in this region.22⇓–24 Most authors suggest, however, that ADC values may provide quantitative information useful in the differentiation of benign and malignant lesions in this region.22⇓–24 The study of Wang et al22 suggested that an ADC value lower than 1.22 × 10⁻³ mm2/s was used for predicting malignancy at 1.5T, with high sensitivity (84%) and specificity(91%). Srinivasan et al24 proposed that an ADC value less than 1.3 × 10⁻³ mm2/s at 3T suggested malignant head and neck lesions. Until now, there were no previously documented reports of DWI of SAPs in the literature. In the present study, the mean ADC value of the 17 SAPs was (1.40 ± 0.20) × 10−3 mm2/s. According to the 2 ADC threshold values mentioned above, this ADC value corresponds to benign lesion. In the future, the clinical role of DWI in the discrimination of tumors in this region should be explored through more comprehensive studies.
Making correct preoperative diagnosis is the key to formulating the therapeutic plan and avoiding extensive surgical approaches. However, it is somewhat difficult for rhinologists to do that by means of the clinical presentation. Some symptoms such as epistaxis can raise the suspicion clinically for a malignant lesion,12 especially in elderly patients. Radiologic evaluation can provide more valuable anatomic and diagnostic information for clinicians. Due to the high soft-tissue resolution, MR imaging has conspicuous superiority to CT in reflecting the internal structures of SAP and the involved extent.
The differential diagnosis mainly includes other inflammatory nasal polyps, inverted papilloma, lobular capillary hemangioma, mycetoma, or possibly malignant tumors such as squamous cancer, adenoid cystic carcinoma, and melanoma. Inflammatory edematous nasal polyps usually show hypointense signal intensity on T1WI and hyperintense signal intensity on T2WI without internal enhancement following the administration of contrast material. Inverted papilloma often appears lobular, and most lesions reveal a characteristic convoluted cerebriform pattern on both T2WI and contrast-enhanced T1WI.25 Lobular capillary hemangioma is usually located in the nasal cavity and demonstrates low signal intensity on T1WI and high signal intensity with tubular flow voids on T2WI. After the administration of contrast material, a markedly enhancing mass with flow-void signal intensity is seen.26 Mycetoma shows low signal intensity centrally on T2WI and no enhancement on contrast-enhanced T1WI. Malignant tumors demonstrate variable imaging findings on CT and MR imaging and usually result in erosive bony destruction. The TICs of most malignant tumors also show a rapidly enhancing and rapid washout pattern (type III) in most cases. The peripheral low intensity rim of SAP is the most important distinguishing feature from malignant tumors.
Conclusions
The imaging features of SAPs on conventional MR imaging are quite characteristic, including internal heterogeneous hyperintensity with a peripheral hypointense rim on T2WI and strong nodular and patchy enhancement on postcontrast MR images. Moreover, progressive enhancement on DCE MR imaging is a very important diagnostic clue as well. The ADC value of SAP yielded in the study also suggests a benign lesion. A familiarity with these MR imaging characteristics in SAP can significantly heighten the preoperative diagnostic accuracy for this entity.
Footnotes
-
Indicates article with supplemental on-line table.
References
- Received July 1, 2011.
- Accepted after revision July 23, 2011.
- © 2012 by American Journal of Neuroradiology
In this issue


Jump to section
Related Articles
Cited By...
- No citing articles found.