
Abstract
BACKGROUND AND PURPOSE: Because it is a small subcortical structure, the precise measurement of the human LGN is still a technical challenge. In this article, we identify the LGN in vivo, measure its volume based on high-resolution MR imaging, and then relate its volume to subject age to evaluate the potential clinical application.
MATERIALS AND METHODS: A semiautomatic LGN isolation method was developed on scans obtained with 1.5T MR imaging, which involves highlighting the surrounding landmarks, obtaining candidate LGN voxels with a region-growing algorithm, and isolating the LGN from the ventral diencephalon. The method was accessed with a test-retest reliability on the results from 55 healthy subjects at different ages.
RESULTS: This method showed high test-retest within-subject reliability (ICC, 0.950 and 0.948 in left and right hemispheres, respectively) among 3 independent measurements in each subject. The unilateral volume was highly variable, ranging from 52 to 102 mm3 in the left and 66 to 105 mm3 in the right hemisphere, with significantly larger volumes on the right (86 mm3) than on the left (77 mm3). The combined bilateral volumes (controlled for ICV) significantly decreased in size with progressing age from 20 to 65 years (r = −0.512, P = .000). There was no sex difference in bilateral LGN volumes (male/female: 163.1 ± 18.2/162.2 ± 21.4 mm3).
CONCLUSIONS: Using our new technique, we were able to reliably determine the human LGN volume in vivo, which was found to decline with age. The volumes obtained by our method corresponded well with previously reported postmortem values, so our method may be considered to be superior for investigating the pathology of LGN.
ABBREVIATIONS:
- BOLD
- blood oxygenation level dependent
- CH-PC
- chiasmato-commissural
- ICC
- intraclass correlation coefficient
- ICV
- intracranial brain volume
- LGN
- lateral geniculate nucleus
- VDC
- ventral diencephalon
Being a major visual relay station for information that travels from the retina to primary visual cortex, the LGN is the first stage at which cortical top-down feedback signals affect visual processing.1⇓–3 Although there is increasing interest in the morphometry of the LGN,4⇓⇓⇓–8 the current imaging methods of LGN determination are not anatomically specific and the results are also inconsistent. A reliable and practicable method to precisely measure LGN in vivo is still not available.
In contrast to prior morphometric and histologic postmortem studies,9⇓–11 volume determinations need to be easily applied in studying clinical problems such as aging or other degenerative disorders. Additionally, LGN imaging also needs to be a highly sensitive and reliable visualization; enabling direct stereotactic target determination would substantially improve measurement accuracy.
Several technical advances in neuroimaging have emerged and have shed light on the study of subcortical structures in vivo. Horton et al12 provided the first images of the LGN by proton density–weighted imaging on postmortem examinations and in living human subjects. They reported a good correlation of MR images with anatomic sections and concluded that it is possible to unequivocally identify the LGN by using MR imaging; they also provided a suggested range for the human LGN volume. Recently, Gupta et al8 studied patients with glaucoma and reported that the LGN height was significantly decreased; this decrease was also shown by coronal proton density MR imaging. However, there has been a special concern for the lack of sufficient contrast to differentiate thalamic nuclei, which have various relaxation times but few proton attenuations.13
fMRI can also be used to indirectly image the LGN, though activation measurements only reflect the collective responses of neural populations in the LGN, which are associated with visual stimuli. For example, Fujita et al14 reported that the fMRI activation region could be superimposed onto the LGN that was anatomically identified by proton density–weighted images. O'Connor et al4 reported that the locations of the activations were consistent with the anatomic locations of the LGN as determined on high-resolution anatomic MR images. However, LGN functional imaging has been constrained by technical limitations, such as the fact that the activation level is close to noise and that the activation area in the LGN probably depends on the global normalization procedure15 and also on the visual activity status. So the activation of BOLD signal intensity is especially problematic in clinical populations in which changes in the cerebrovascular system can be influenced by age or impaired vision.16⇓–18 Moreover, there is still controversy over the approximated volumes of the LGN and whether the activated volume readings are, in part, influenced by activation from adjacent structures such as the pulvinar during visual stimulation.19,20
A recent study21 introduced a feasible procedure to identify the human LGN primarily by well-known landmarks with 3D T1-weighted images. On the basis of this understanding, we have now developed a semiautomatic method to isolate the LGN on T1-weighted MR images with image enhancement and cortex parcellation mapping. The validity and reliability of this method were documented in 55 healthy controls at different ages. As we now show, LGN volumes obtained with this method agree reasonably with the reported anatomic postmortem volume. In addition, the results also showed for the first time significant LGN volume shrinkage in normal human aging, which suggests that age-related vision loss has a central component.
Materials and Methods
Patients and MR Imaging Acquisition
The 55 healthy controls (29 men, 26 women; ages, 20–67 years, mean, 38.6 ± 14.4 years) were recruited and studied at the Beijing Tongren Hospital, Capital Medical University. All subjects underwent eye examinations and visual field testing by using standard perimetric tests to exclude the possibility of visual system dysfunction. Subjects with a history of ocular or neurologic disease were also excluded. The study was approved by the ethics committee of the Beijing Tongren Hospital. Written informed consent was obtained from each subject according to the provisions of the Declaration of Helsinki.
All measurements were performed on a 1.5T Signa MR imaging scanner (GE Healthcare, Milwaukee, Wisconsin). Each subject was first scanned by using a T2-weighted fluid-attenuated inversion recovery sequence (TR = 9000 ms, TE = 120 ms, TI = 2125 ms, FOV = 240 × 210 mm, matrix size = 256 × 222, thirty-two sections, 4.0-mm section thickness with 0.8-mm intersection gap) to detect any brain abnormalities. A set of high-resolution axial T1-weighted images was acquired with a 3D fast-spoiled gradient sequence by using the following scan parameters: TR = 10 ms, TE = 4.4 ms, TI = 600 ms, FOV = 260 × 260 mm, matrix size = 256 × 256, number of excitations = 1, yielding 152 sections and a voxel dimension of 1 × 1 × 1 mm.
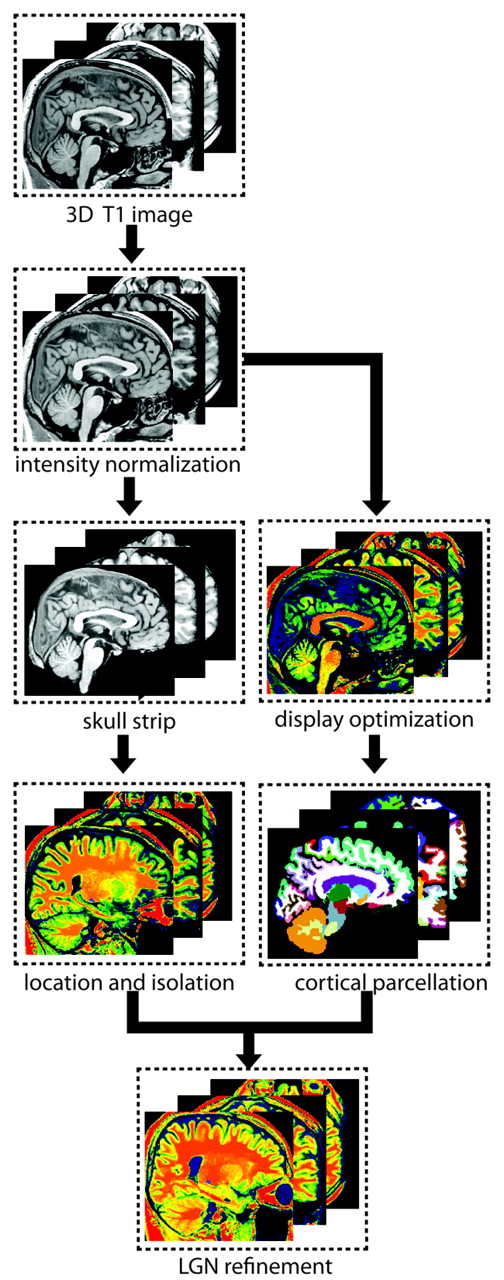
Image enhancement and cortex parcellation techniques were used to isolate the LGN on 3D T1-weighted images. First, nonuniformity correction and gray-level normalization was used to enhance the raw image for visualization. Then anatomic landmarks were highlighted by adjusting image intensity and color mapping. Second, a region-growing algorithm was used to obtain the candidate voxels of LGN. Then a VDC mask was applied to exclude the non-LGN voxels, and subsequently the LGN voxels were obtained as the intersection of candidate voxels and the VDC (Fig 1).

Pipeline of LGN isolation on a 3D T1-weighted image. The procedure mainly included intensity nonuniformity correction, gray-level normalization, color-mapping highlighting, cerebral cortex parcellation, landmark identification, and LGN localization and refinement.
Image Preprocessing
Intensity normalization was performed to remove variations due to magnetic susceptibility artifacts and radio-frequency field inhomogeneities on individual MR imaging volumes by using the N3 algorithm.22 The intensity of in-plane voxels was also normalized and resampled into 8-bit gray levels.
LGN Localization and Measurement
The boundary of the LGN was defined in accordance with an adapted procedure of Korsholm et al21 and entailed the following steps:
1) Setting of the display threshold and color-map scheme
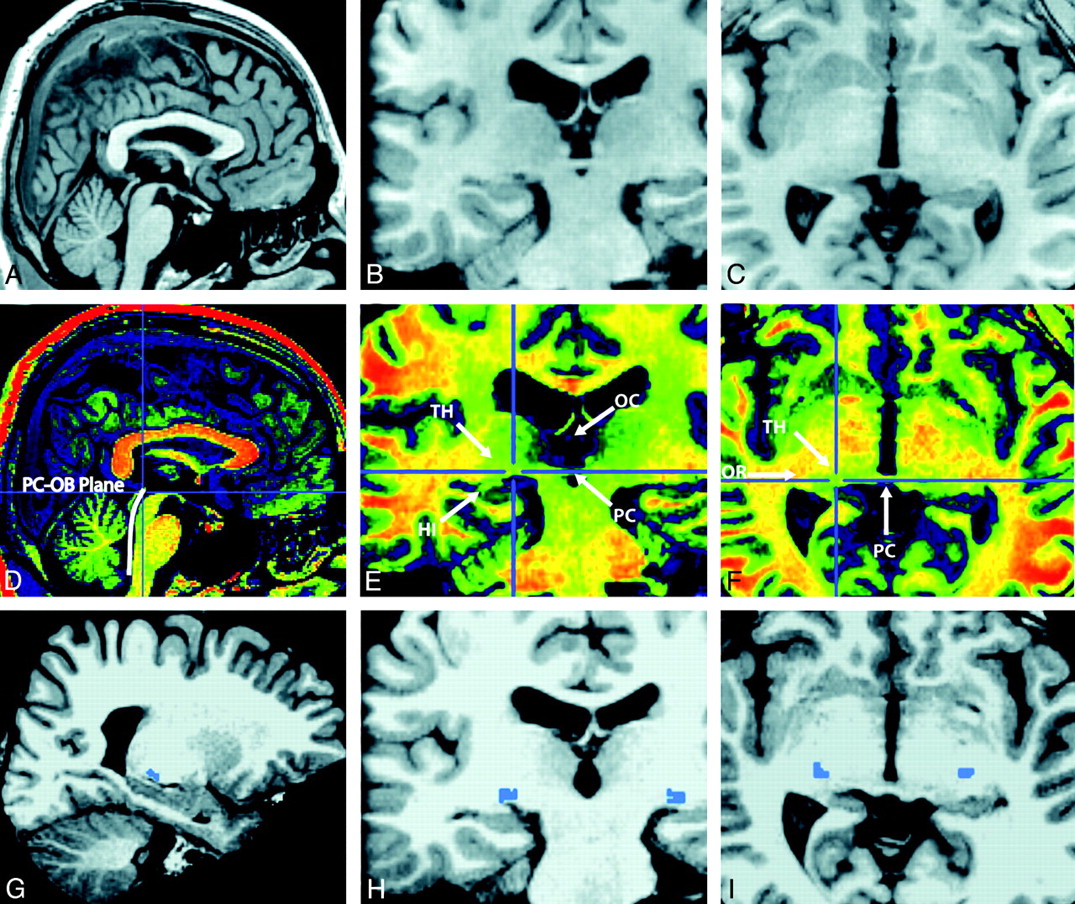
In the aforementioned T1 image (Fig 2A–C), the minimum display threshold was set at 40, and a built-in Adobe color table scheme was chosen within MRIcron software (http://www.cabiatl.com/mricro). As shown in Fig 2D–F, the examined nucleus had a relatively homogeneous structure, and it can be isolated from surrounding matter.

Delineation of the LGN on cross-sectional images. A–F, The images show the cerebral cortex in gray levels (A–C) and pseudocolor enhancement images (D–F). G–I, The cross-sectional images of candidate LGN maps are shown in blue.
2) Identification of assisting anatomic landmarks
After placing the cursor point only in the posterior commissure-obex plane on parasagittal images (Fig 2D), the LGN in both hemispheres was located, with the help of the posterior commissure and hippocampus, on coronal images (Fig 2E), and the CH-PC and optic tract, on the axial view (Fig 2F), as suggested by previous studies.21,23,24 It is quite remarkable that prior enhancement was necessary to achieve the best possible homogeneity to properly examine the nucleus.
3) Delineation of LGN voxels
The boundary of the LGN was delineated on a section that was characterized by having the largest extension of the LGN. A region-growing algorithm was performed to obtain a continuous cluster of voxels starting from a user-defined seed point, which was positioned at the center of the LGN by the operators.
 Here, I represents the intensity of the voxel and the coordinate of the voxel as X. The values of the radius R0 and the difference from the origin I0 were determined on the basis of the experiments reported in the literature8,12,25,26 and our pilot trials (see “Histology study” section in Table 1 to review the radius of LGN, and Fig 2H, -I for the obtained candidate voxel of the LGN).
Overview of LGN volumes from published studies
4) LGN refinement with a VDC mask
Finally, the VDC (Fig 3A, -B) was used to refine the LGN voxels, since the majority of the posterior tissue in VDC is anatomically defined as the LGN.27 The VDC mask was generated from automatic subcortical segmentation and the cortical parcellation in FreeSurfer (http://surfer.nmr.mgh.harvard.edu/) and was used to refine the LGN by intersecting with the candidate voxels of the LGN (RLGN = RVOI ∩ RVDC, Fig 3C, -D). To check and review the boundary of the LGN, we found the CH-PC to be the preferable plane for visualization of the LGN in the axial view.23

Definition of candidate LGN. The left and right VDC was automatically identified by the FreeSurfer on original T1 images. A–D, The LGN is isolated as the intersection area between the outlined VOI (candidate LGN, A, in green) and the VDC mask (in red); it is, RLGN = RVOI ∩ RVDC (D, 3D visualization).
An operator delineated the boundary of the LGN following the above procedure. In this study, the rating was repeated by 2 experienced neuroradiologists and a neurologist who had no knowledge of the subject's identity and other experimental information. The ratings were performed at an interval of 2 weeks, so each study subject's data were the average of 3 independent measurements by independent observers.
Statistical Analysis
All statistical analyses were conducted by using the Statistical Package for the Social Sciences, Version 16.0 (SPSS, Chicago, Illinois). An analysis of the ICC was used to access the test-retest within-subject reliability. A repeated-measures ANOVA was used to compare 3 measurements in each hemisphere. Then the average volume of the 3 measurements was calculated for each LGN.
Paired comparison was performed to access the asymmetry of bilateral LGN volumes in controls. Pearson correlations were used to examine the relationship between bilateral LGN volume and age after adjusting the ICV. In an exploratory manner, the sex difference was also analyzed in our sample. All results were expressed as mean ± SD. For all tests, a P value <.05 was considered significant.
Results
Expert validation confirmed semiautomated LGN detection in all cases. None of the detected 2 × 55 structures had to be excluded according to image inspection as described above.
Test-retest reliability of repeated morphometric measurements of the LGN with/without the VDC mask was investigated in all subjects. Compared with the results without the VDC mask, the results obtained with the VDC mask revealed high test-retest within-subject reliability (without the VDC mask: left LGN, ICC = 0.824; right LGN, ICC = 0.796; with VDC mask: left LGN, ICC = 0.950; right LGN, ICC = 0.948).
The repeated-measures ANOVA was used to calculate possible differences of volume estimates bilaterally across 3 measurements (left LGN, F = 1.906, P = .154; right LGN, F = 0.431, P = .489; Greenhouse-Geisser corrected; Table 2).
Comparison of LGN volumes before versus after applying a VDC mask (n = 55)a
Mean LGN volume of 83 mm3 (left hemisphere, 52–102 mm3; mean, 77 mm3; right hemisphere, 66–105 mm3; mean, 86 mm3) was consistent with that in the postmortem studies of Putnam,9 who reported volumes from 77 to 115 mm3 and Zvorykin,10,11 who reported volumes from 66 to 152 mm3.
Combined bilateral LGN volumes were found to decrease with age (r = −0.512, P = .000, Fig 4) after regressing out brain sizes as ICV. We found no sex difference in LGN volumes by a 2-sided t test (male, 163.114 ± 18.230 mm3; female, 162.2179 ± 21.439 mm3; t = 0.168, P = .867).

Relationship between bilateral LGN volume and age in all subjects (n = 55). Bilateral LGN volume significantly decreases with the age of the subjects (correlation of r = −0.512, P = .000; volume-controlled for intracranial volume).
On an exploratory level, LGN sizes were compared bilaterally and left-right correspondence was explored. The average LGN volume of the group was significantly larger on the right than on the left side (left, 76.478 ± 14.310 mm3; right, 86.212 ± 11.096 mm3, difference = 9.733; t = 4.389, P = .000). However, no correlations were found between the LGN volumes in both hemispheres (r = 0.181, P = .186).
Discussion
We have developed, for the first time, a semiautomatic method to isolate the LGN, which is capable of estimating the volume on the basis of high-resolution MR structural images. The robustness of this method was validated by 55 healthy controls ranging in age from 20 to 67 years. The main findings were that LGN volumes range from 52 to 102 mm3 (mean, 77 mm3) in the right and 66–105 mm3 (mean, 86 mm3) in the left hemisphere. These values agree reasonably well with the reported volumes in postmortem studies.9,11 Thus, MR structural imaging is a valid and reliable method to evaluate LGN volume in vivo, when used in combination with our semiautomatic analysis method. In addition, we demonstrated LGN volume shrinkage in normal aging (see below).
The LGN is a major relay station of the retinofugal pathway, modulating the transmission of visual information that travels to the visual cortex. The characterization of the normal LGN and possible degenerative changes after nervous system damage are still a matter of debate, from a clinical as well as a methodologic point of view (Table 1). However, the precise determination of LGN in vivo is technically challenging due to its relatively small size and subcortical location.
In our study, LGN volumes were found to be comparable with volumes obtained by other postmortem studies. For example: Zvorykin11 reported a 2- to 3-fold volume range (66–152 mm3) among 17 individuals. Putnam9 reported volumes of 77–115 mm3 but only studied 3 individuals. Andrews et al28 studied 15 specimens and determined the volume in the right (91.1–154 mm3; mean, 121 mm3) and left hemispheres (91.9–157 mm3; mean, 115 mm3). They also reported a 2- to 3-fold variation in the size of LGN between subjects.
Rather than using postmortem tissue, we developed a more reliable method to measure the LGN, which enables direct stereotactic target determination. Measurements done in vivo would substantially improve accuracy and aid in observing pathologic changes. The results obtained in our study are consistent with the postmortem results,9,11 showing comparable estimates of the average LGN volume and a high degree of variability (approximately 2-fold) with good test-retest reliability and consistency (Table 2).
Other studies have used proton density–weighted images12 and fMRI to determine LGN volume in vivo.8,16,28 The proton density images were found to be susceptible to changes in water content and generally provided good visualization of white matter but poor visualization of gray matter. However, differences in relaxation times and too low proton density among thalamic nuclei caused low contrast and quantitative uncertainties.13 The activation of neuronal populations in the LGN associated with visual stimuli is an alternative method to estimate LGN volume in fMRI studies, but fMRI experiments are much more involved, hence less practical, for routine clinical application.
There is considerable controversy about the precise relationship of the presumed LGN activated area and the actual volumes (Table 1). Due to the partial volume effects and the activation from adjacent structures such as the pulvinar,20 BOLD-based activation of the LGN inevitably introduces bias to measurements. In addition, the activation scope of the LGN is close to noise level and most likely depends on the global normalization procedure.15 In extreme clinical cases, where permanent visual impairment or even blindness occurs, with fMRI methods, it is very difficult to acquire reliable data. Such issues have harmed the consensus of fMRI results and ultimately more widespread application in visual system research with human subjects.
Manual delineation of the LGN might produce more accurate results. However, this would be extremely time-consuming, and it is potentially prone to subjective bias, especially when the native image itself is of low-quality resolution or contrast. Our semiautomatic method improves the precision and speed of a prior region-of-interest-based method of Korsholm et al21 by using the FreeSurfer subcortical pipeline.29,30 This pipeline is fully automated and user-independent because it uses a neighborhood function to encode spatial information, a forward model of the MR scanner parameters to improve sequence independence, and a nonlinear function to account for morphologic differences between the atlas and the individual brain. With the help of the obtained VDC mask in FreeSurfer, it is possible to easily exclude non-LGN voxels, which originate mainly from the hippocampus, white matter, or CSF.
Kastner et al20 approximated the LGN as a cube with a mean side length at 4.89 ± 0.27 mm, which is consistent with the results by Chen et al.31 In addition, this closely matches the observations of Gupta et al,8 who estimated the side length at 4.74 ± 0.54 and 4.83 ± 0.95 mm for the right and left LGN, respectively. Therefore, a sphere VOI with a 3-mm radius was used as a mask to extract the LGN after the region-growing algorithm in this study. Moreover, we also noted that the posterior commissure usually appeared in the same section together with the LGN. By following the optic tract, it was also possible to trace of the LGN in the coronal plane.
With this new LGN imaging method, our study investigated the effects of aging on LGN volumes to test the value of our procedure in a medical context. Because each LGN represents only one-half of the visual fields, we summed up and compared the bilateral LGN volumes, accounting for visual input from each eye. The bilateral LGN volumes in our samples decreased with age (r = −0.512, P = .000) after regressing out ICV. This is an important observation because it might indicate that the loss of vision with progressing age may also have a brain-based component. However, further study of age-related changes is needed to demonstrate that our method is sufficiently sensitive to monitor longitudinal changes such as degeneration in the LGN. In fact, this semiautomatic method may lay the basis for further studies of the diagnosis and treatment of neurologic and ophthalmologic diseases and may also very well be useful for neurosurgical intervention.
With regard to the clinical observation of LGN volume changes with age, our general finding is consistent with those of animal studies, which have already reported LGN degeneration in normal aging.32⇓–34 Diaz et al32 compared the volume change of the dorsal LGN as a function of age and found significant decreases of neuronal volume attenuation and numeric attenuation of neurons in old rats. Similarly, de la Roza et al33 and Vidal et al34 reported a significant reduction in the diameters of both the soma and nuclei of neurons of the dorsal LGN in aged rats. As suggested in their study, aging and partial loss of visual input appeared to induce small changes in the morphology of most of the dorsal LGN neurons. However, to the best of our knowledge, LGN volume changes associated with aging have never been studied in the human brain, and it now needs to be determined whether LGN volume loss is strictly a result of reduced afferent input from the retina or whether it is caused by LGN cell loss.
No sex difference in LGN volumes in the samples was observed, but the volume of the right LGN was, on average, larger than that of the left. Nevertheless, the difference is smaller than the variance introduced by repeated measurements. In addition, given that most subjects have 1 dominant eye, it would be of interest to determine if the asymmetry of the LGN volume is related to unilateral dominance. Additional studies are required to evaluate the relationship of LGN volume and eye dominance, including larger samples and a correlation with functional measures of vision.
In the field of neuroimaging, it is still a technical challenge to precisely visualize and distinguish the irregular and variable laminar patterns of the human LGN because this would require higher resolution. Therefore, it is imperative to apply our method to data obtained from high-resolution (7T) MR imaging, in which anatomic landmarks are more distinct and can be more easily identified.
Limitations of the Current Study
Careful attention is required when using our semiautomatic technique. We used the VDC mask from FreeSurfer to refine the non-LGN voxels in the candidate voxels from a region-growing algorithm. In the definition of VDC in FreeSurfer, the choroidal fissure is the inferior border of the LGN, and the most posterior extent of the VDC is the LGN (see more details in http://www.cma.mgh.harvard.edu/manuals/segmentation/). The subcortical segmentation in FreeSurfer takes account of the MR imaging scanner parameters, curvature and spatial information from the pial surface, and morphologic differences between the atlas and each individual. If the individual information is incorporated into the segmentation, the resulting mask and further LGN isolation would be more specific. Therefore, our results rely on the subcortical segmentation in FreeSurfer. In addition, the volume estimates are less precise and are subject to potential bias when the referred structural image itself is not well-defined.
Conclusions
Our study introduces an innovative semiautomatic method to isolate the LGN on anatomic MR images. Compared with previous studies, the measured LGN volumes agree reasonably well with the reported anatomic volume in postmortem examinations. Our method shows the possibility of assessing structural MR imaging morphologic and volume changes of the LGN in vivo. As a result, this study will greatly enhance future studies of different neurologic and ophthalmologic diseases that affect the central visual pathway, and one such example is our documentation of LGN volume shrinkage, which is associated with normal aging.
Acknowledgments
We thank Jianhong Li, MD, for assistance in reviewing our results, and Dr William Uber, Shan Yang, and Tara Crute, for helping with preparation of the manuscript.
Footnotes
-
Disclosures: Qianwen Miao—RELATED: Support for Travel to Meetings for the Study or Other Purposes: National High-Tech Research and Development Plan of China (863), grant No. 2007AA01Z327. M. Walter—RELATED: Grant: DFG-SFB779,* Comments: government grant; UNRELATED: Grants/Grants Pending: ERA-Net “Supp-Hab”.* * Money paid to institution.
-
This work was supported by the National Natural Science Foundation of China (20670530, 60875079, 81070762), Beijing Nova Plan (2007A094). M. Li was supported by Boehringer Ingelheim Fonds in Germany.
Indicates open access to non-subscribers at www.ajnr.org
References
- Received June 23, 2011.
- Accepted after revision August 19, 2011.
- © 2012 by American Journal of Neuroradiology
In this issue


Jump to section
Related Articles
Cited By...
- Mapping the Human Visual Thalamus and its Cytoarchitectonic Subdivisions Using Quantitative MRI
- Visualization of the Medial and Lateral Geniculate Nucleus on Phase Difference Enhanced Imaging
- The Anatomical and Functional Organization of the Human Visual Pulvinar
- An Investigation of Lateral Geniculate Nucleus Volume in Patients With Primary Open-Angle Glaucoma Using 7 Tesla Magnetic Resonance Imaging
- Age-Related Changes in the Visual Pathways: Blame It on the Axon