
Abstract
BACKGROUND AND PURPOSE: Intravoxel incoherent motion MR imaging can simultaneously measure the diffusion and perfusion characteristics of brain tumors. Our aim was to determine the utility of intravoxel incoherent motion–derived perfusion and diffusion parameters for assessing the treatment response of metastatic brain tumor following gamma knife radiosurgery.
MATERIALS AND METHODS: Ninety-one consecutive patients with metastatic brain tumor treated with gamma knife radiosurgery were assessed by using intravoxel incoherent motion imaging. Two readers independently calculated the 90th percentile and the 10th percentile histogram cutoffs for perfusion, normalized CBV, diffusion, and ADC. Areas under the receiver operating characteristic curve and interreader agreement were assessed.
RESULTS: With the combination of the 90th percentile histogram cutoff for perfusion and the 10th percentile histogram cutoff for diffusion, the sensitivity and specificity for differentiating recurrent tumor and treatment were 79.5% and 92.3% for reader 1 and 84.6% and 94.2% for reader 2, respectively. With the combination of the 90th percentile histogram cutoff for normalized CBV and the 10th percentile histogram cutoff for ADC, the sensitivity and specificity for differentiating recurrent tumor and treatment were 69.2% and 100.0% for reader 1 and 74.3% and 100.0% for reader 2, respectively. Compared with the combination of 90th percentile histogram cutoff for normalized CBV and the 10th percentile histogram cutoff for ADC, adding intravoxel incoherent motion to 90th percentile histogram cutoff for normalized CBV substantially improved the diagnostic accuracy for differentiating recurrent tumor and treatment from 86.8% to 92.3% for reader 1 and from 89.0% to 93.4% for reader 2, respectively. The intraclass correlation coefficients between readers were higher for perfusion parameters (intraclass correlation coefficient range, 0.84–0.89) than for diffusion parameters (intraclass correlation coefficient range, 0.68–0.79).
CONCLUSIONS: Following gamma knife radiosurgery, intravoxel incoherent motion MR imaging can be used as a noninvasive imaging biomarker for differentiating recurrent tumor from treatment effect in patients with metastatic brain tumor.
ABBREVIATIONS:
- ADC10
- 10th percentile histogram cutoff for ADC
- D
- diffusion
- D*
- pseudodiffusion coefficient
- D10
- 10th percentile histogram cutoff for D
- f
- perfusion
- f90
- 90th percentile histogram cutoff for f
- GKRS
- gamma knife radiosurgery
- ICC
- intraclass correlation coefficient
- IVIM
- intravoxel incoherent motion
- nCBV
- normalized CBV
- nCBV90
- 90th percentile histogram cutoff for nCBV
Perfusion MR imaging techniques have significantly advanced and can now provide information regarding tumor physiology. There are several reports suggesting the usefulness of dynamic susceptibility contrast-enhanced perfusion MR imaging for differentiating recurrent metastatic brain tumor from stereotactic radiosurgery–induced radiation necrosis.1⇓–3 However, quantitative brain perfusion measurement remains a challenge for currently available MR perfusion methods. DSC and dynamic contrast-enhanced MR imaging are inhibited by their signal nonlinearity, and arterial spin-labeling exhibits, in addition to a low signal-to-noise ratio, a strong dependence on the transit time.
Le Bihan et al4 defined intravoxel incoherent motion (IVIM) as the microscopic translational motion occurring in each image voxel in MR imaging. In biologic tissue, this incoherent motion includes molecular diffusion of water and microcirculation of blood in the capillary network, referred to as “perfusion.” These 2 phenomena account for the biexponential decay of the signal intensity on DWI when different diffusion b-values are applied. With the IVIM theory, both true molecular diffusion and water molecule motion in the capillary network can be estimated by using a single diffusion imaging-acquisition technique. As opposed to DSC, dynamic contrast-enhanced imaging, and arterial spin-labeling, IVIM has a unique capillary dependence that is not sensitive to the coherent laminar flow of arteries and veins. The measurement of IVIM is intrinsically local (ie, the encoding and readout are performed at the same location).5
In our clinical experience, the major advantage of IVIM MR imaging is that because it allows the simultaneous acquisition of diffusion and perfusion parameters, it can provide both measures within corresponding solid lesions without the requirement for a further coregistration processing step. In the current study, we attempted to validate the IVIM-derived perfusion and diffusion parameters by using the clinicoradiologic correlation in patients with post-gamma knife radiosurgery (GKRS) metastatic brain tumor. We also assessed the diagnostic accuracy and added value of the IVIM method for differentiating recurrent tumor from treatment effect, compared with the combination of DSC perfusion MR imaging and DWI, which has commonly been used as a parameter for brain tumor imaging.
Our hypothesis was that the difference in vascularity between recurrent tumor and the treatment effect can be assessed by using an IVIM-derived perfusion fraction (f); and the combination of f and the true diffusion parameter (D) would show diagnostic performance comparable with the combination of normalized CBV (nCBV) and the ADC. The purpose of this study was to determine the utility of IVIM-derived perfusion and diffusion parameters for assessing the treatment response of metastatic brain tumor following GKRS.
Materials and Methods
Study Population
A retrospective review of the data base of our medical institution identified 571 consecutive patients treated with GKRS between May 2010 and January 2014. Among these patients, 138 met the following inclusion criteria: 1) They had pathologically confirmed primary systemic cancer, 2) had a metastatic intra-axial tumor seen on brain MR imaging, 3) demonstrated enlarged regions of contrast enhancement based on ≥2 consecutive MR images within the radiation field suggestive of recurrent tumor or treatment effect, 4) underwent conventional MR imaging by using both IVIM and DSC perfusion MR imaging to evaluate the enlarged contrast-enhancing lesion, 5) were on zero steroid dose at the time of IVIM and DSC perfusion MR imaging, 6) had adequate image acquisition and quality without patient motion and significant susceptibility artifacts, and 7) underwent adequate clinicoradiologic follow-up to definitively determine their diagnosis. Eight patients were initially excluded from this study because they underwent gross total resection of the contrast-enhancing mass for a presumptive diagnosis of glioblastoma.
The remaining 130 who did not undergo surgical resection for presumed metastatic brain tumor before GKRS were subsequently followed by using both a clinical examination and an MR imaging study every 3 months. According to the protocol of our institution, the decision-making for treatment change or salvage radiation therapy was based on both the clinical symptoms and the findings of noninvasive advanced imaging studies by consensus of a neuro-oncologist and a neuroradiologist. Therefore, stereotactic biopsy only for the pathologic diagnosis of an enlarged contrast-enhancing lesion has been rarely performed and was not included in this study. A surgical resection was indicated only for decompression to relieve significant patient symptoms. In this study, we determined the final diagnosis between recurrent tumor and treatment effect on the basis of adequate clinicoradiologic follow-up. The diagnosis of treatment effect was made if an enlarged contrast-enhancing lesion showed complete response, partial response, or stable disease depending on the Response Evaluation Criteria in Solid Tumor method on >2 subsequent follow-up MR imaging studies for a minimum of 3 months. Complete and partial responses were defined as the disappearance of lesions or a decrease in tumor volume of >50% on MR imaging. Recurrent metastatic tumor was also clinicoradiologically diagnosed if the contrast-enhancing lesion presented with a volume increase on >2 subsequent follow-up MR imaging studies for a minimum of 3 months, accompanied by neurologic deterioration. Thirty-nine patients with equivocal clinical and image findings that did not meet the above final diagnostic criteria, such as prolonged asymptomatic increases of a contrast-enhancing lesion, were excluded from this study. Finally, 91 patients were enrolled. The most common primary tumor was lung cancer (69 of 91 patients, 76%), followed by breast cancer (21 of 91 patients, 23%) and colon cancer (1 of 91 patients, 1%). According to our inclusion criteria, hemorrhagic metastatic tumors, which can affect the results of IVIM and DSC perfusion MR imaging, were excluded from this study.
For contrast-enhancing lesion volume measurement, the maximal diameter of the lesion was measured in 3 orthogonal planes. Lesion volume was calculated according to the following formula: volume = length × width × height / 2.17. Each contrast-enhancing lesion volume on follow-up MR imaging was then compared with that on a prior MR imaging study.2
Imaging Protocol
MR imaging was performed by using a 3T system (Achieva; Philips Healthcare, Best, the Netherlands) with an 8-channel sensitivity-encoding head coil. We acquired 16 different b-values (0, 10, 20, 40, 60, 80, 100, 120, 140, 160, 180, 200, 300, 500, 700, and 900 s/mm2) in 3 orthogonal directions, and the corresponding trace was calculated before contrast injection. We used a large number of lower b-values in our study to improve the accuracy of the perfusion fraction. The images were oriented axially with a section thickness of 5 mm, FOV of 240 mm, matrix of 136 × 138, and TR/TE of 3000/72 ms. A correction of eddy current–induced distortions was enabled by using gradient pre-emphasis. Parallel imaging was done with an acceleration factor of 2, and the total acquisition time was 4 minutes 21 seconds.
DSC MR perfusion imaging was performed by using a gradient-echo, echo-planar sequence during the administration of contrast material (gadoterate meglumine, Dotarem; Guerbet, Aulnay-sous-Bois, France) at a rate of 4 mL/s by using an MR imaging–compatible power injector (Spectris MR injector; MedRad, Indianola, Pennsylvania). The bolus of contrast material was followed by a 20-mL bolus of saline administered at the same injection rate. The image dataset was obtained during the first pass of the contrast agent until 59 time points were obtained, with a temporal resolution of 1.4 seconds and 5 baseline time points. The detailed imaging parameters for the DSC study were as follows: TR/TE, 1407/40 ms; flip angle, 35°; FOV, 24 cm; matrix, 128 × 128; and number of sections, 20. The total DSC MR imaging acquisition time was 1 minute 30 seconds.
IVIM Fitting
The relationship between signal variation and b factors in an IVIM-type sequence can be expressed by the following equation5:
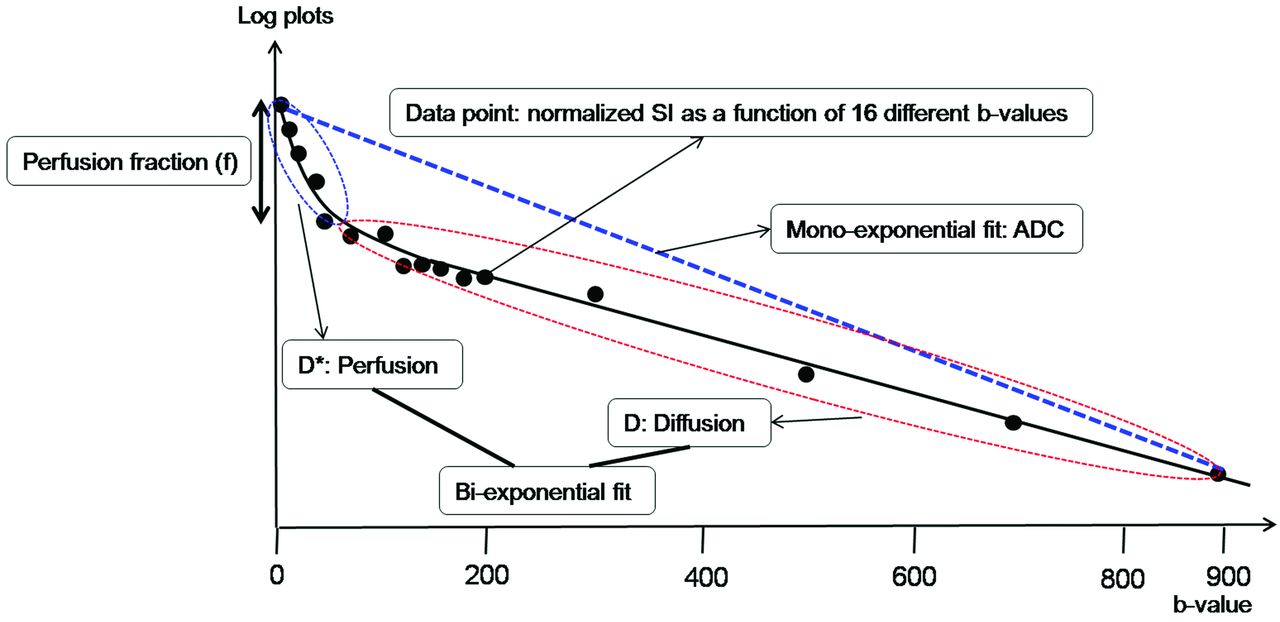
 where S is the mean signal intensity; S0 is the signal intensity without diffusion; a pseudodiffusion coefficient D* can be defined, which describes macroscopically the incoherent movement of blood in the microvasculature compartment; a perfusion fraction, f, describes the fraction of incoherent signal that arises from the vascular compartment in each voxel over the total incoherent signal; and D is the diffusion parameter representing true molecular diffusion (the slow component of diffusion) (Fig 1).

Illustration for biexponential signal decay as a function of the 16 different diffusion b-values in a given voxel of a recurrent tumor. The bold, solid line is the IVIM nonlinear regression fit providing D, D*, and f. The biexponential fit provides the fast decay associated with perfusion (blue dotted circle), and the red dotted circle represents the slow decay of the biexponential fit, thus indicating true diffusion. The blue dotted line shows the monoexponential fit providing the ADC.
The IVIM signal equation was fitted on a voxel-by-voxel basis by using an in-house program with Matlab2010b (MathWorks, Natick, Massachusetts). Two different approaches were implemented to generate IVIM parametric images (D, D*, and f): first, full biexponential fit, and second, initial estimation of D by using a reduced set of b-values of >200 s/mm2. In the second method, because D* contribution can be neglected at high b-values (b ≥ 200 s/mm2), D was extracted by using high b-values and a monoexponential fit. Subsequently, with the resulting D as a fix parameter, the curve was fitted for f and D* with a nonlinear regression.5,6 Previous reports found that the second approach delivered the most robust and signal-to-noise-enhanced results; therefore, IVIM parameters were calculated by using the second approach in all patients.7,8 In addition, an ADC measurement was calculated by using b=0 and 900 s/mm2 and a simple monoexponential fit to compare the ADC with the IVIM-derived D.
Image Processing
All imaging data were transferred from the MR imaging scanner to an independent personal computer for quantitative IVIM and DSC MR perfusion analyses. Contrast-enhancing lesion volumes were segmented on 3D postcontrast T1-weighted images by using a semiautomated adaptive thresholding technique so that all the pixels above the threshold value were selected. Therefore, significant regions of macroscopic necrosis, cystic areas, and CSF-filled ventricles and sulci were excluded. The resulting entire enhancing tumor volumes were verified by 2 experienced neuroradiologists (H.S.K., with 9 years of clinical experience in neuro-oncologic imaging, and M.J.G., with 2 years of clinical experience in neuro-oncologic imaging) who were blinded to pathologic and other imaging findings. A rigid coregistration between IVIM and anatomic MR images was performed. Each parametric value was calculated on a voxel-by-voxel basis for the segmented contrast-enhancing volume and was used for the histogram analysis (Fig 2).

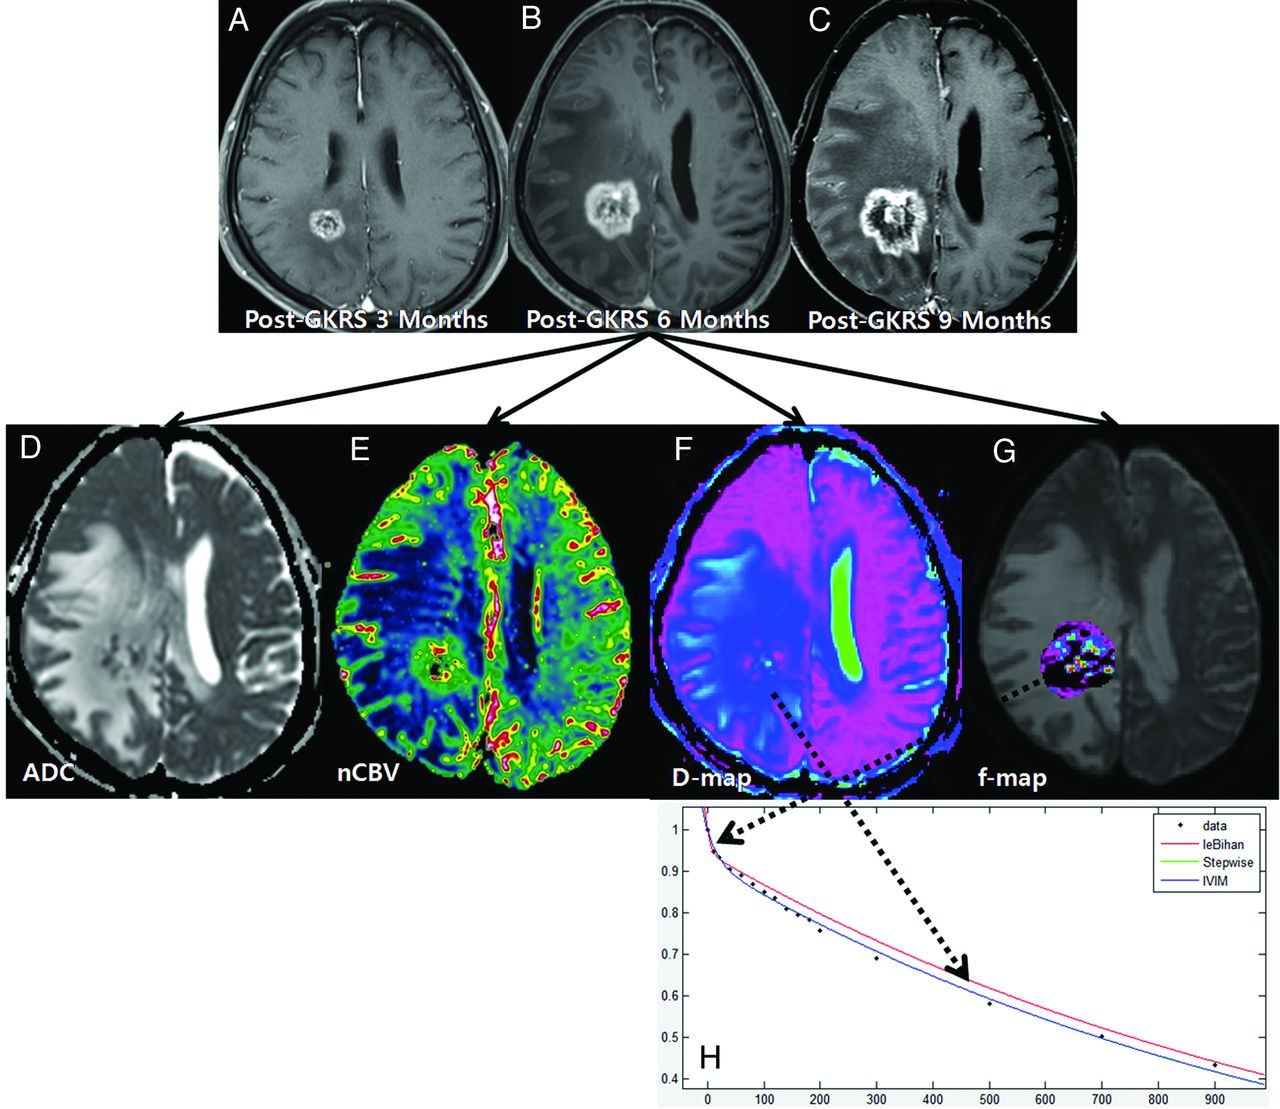
A 61-year-old woman with treatment effect following GKRS. Axial contrast-enhanced T1-weighted images, obtained 3 (A) and 6 months (B) after GKRS, show a progressively enlarging necrotic contrast-enhancing lesion in the left parietal lobe. C, The necrotic contrast-enhancing lesion is stabilized on a subsequent follow-up image obtained 9 months after GKRS, thus indicating treatment effect. The ADC (D) and nCBV (E) maps show no visual decrease of the ADC and no visual increase of the nCBV in the corresponding area of the contrast-enhancing lesion in B, respectively. The D (F) and f (G) maps show no visual decrease of the D value and no visual increase of the f value in the corresponding area of the contrast-enhancing lesion in B, respectively. H, The signal decay curve, plotted as a function of the diffusion b-values, is monoexponential.
The DSC perfusion parametric map was obtained by using a commercial software package (nordicICE; NordicNeuroLab, Bergen, Norway). For DSC MR perfusion imaging, after eliminating recirculation of the contrast agent by using γ-variate curve fitting and contrast agent leakage correction, the relative CBV was computed by using numeric integration of the curve. On a pixel-by-pixel basis, the nCBV maps were calculated by dividing each relative CBV value by an unaffected, white-matter relative CBV value defined by 2 readers (H.S.K. and M.J.G.).
Imaging Analysis
For the cumulative histogram parameters, the 90th percentile for f (f90) and nCBV (nCBV90) and the 10th percentile for D (D10) and ADC (ADC10) were derived (the nth percentile is the point at which n% of the voxel values that form the histogram are found to the left). This choice was made because the 10th percentile parameter is analogous to and statistically more reliable than the minimum value that has been commonly used with the “hot-spot” method. The 90th percentile cutoffs are analogous to and statistically more reliable than the maximum value, which has commonly been used with the hot-spot method. Moreover, this type of histogram parameter is more effective than the mean value for identifying areas where tumorous lesions intermix with treatment-related change, and it is less influenced by random statistical fluctuations than are the maximum and mean values.
Statistical Analysis
The Student t test was used to identify significant differences in the independent variables between the 2 groups. Receiver operating characteristic curve analysis was performed to assess the optimum cutoff of the independent variables for differentiating recurrent tumor-versus-treatment effect.
A leave-one-out cross-validation was used to evaluate the performance of the independent variables (f90, nCBV90, D10, and ADC10). In each round of the leave-one-out validation, 1 participant was selected as a testing sample. The remaining participants were used as training samples to construct the classifier. The testing sample was then classified with the trained classifier. Such a procedure was repeated until each participant was tested 1 time.
Interreader agreement was assessed by using the ICC with 95% confidence intervals and applying a 2-way ICC with random raters' assumption reproducibility. A P value < .05 was considered a significant difference. Statistical analyses were performed by using the Statistical Package for the Social Sciences software (Version 19.0; IBM, Armonk, New York).
Results
Of the 91 study patients, 39 (42.9%) were subsequently classified as having recurrent tumors, and 52 (57.1%), as having treatment effects. Descriptive statistics regarding the demographic data obtained in both the recurrent tumor and the treatment effect patients are summarized in Table 1.
Comparison of study patient demographic data
Visual Analysis of Imaging Parameters
Among the 91 study patients, analysis of all of the patients with recurrent tumor and 9 patients with treatment effect showed that the signal decay curve, plotted as a function of the diffusion b-values, was biexponential and ranged from 0 to 900 s/mm2. The recurrent tumor group showed more rapid signal decay than the treatment effect group in the range of lower b-values (b < 200 s/mm2) (Fig 3). In the remaining 43 patients with treatment effect, the signal decay curve was similar to the monoexponential pattern (Fig 2). The f, nCBV, D, and ADC maps of representative cases of recurrent tumor and treatment effect are shown in Figs 2 and 3.

A 54-year-old man with recurrent tumor following GKRS. Axial contrast-enhanced T1-weighted images, obtained 3 (A), 6 (B), and 9 months (C) after GKRS, show a progressively enlarging necrotic contrast-enhancing lesion in the right parietal lobe. The ADC (D) and nCBV (E) maps show a visual decrease of the ADC and a visual increase of the nCBV in the corresponding area of the contrast-enhancing lesion in B, respectively. The D (F) and f (G) maps show a visual decrease of the D value and a visual increase of the f value in the corresponding area of the contrast-enhancing lesion in B, respectively. H, The signal-decay curve, plotted as a function of the diffusion b-values, is biexponential.
Diagnostic Accuracy of Imaging Parameters
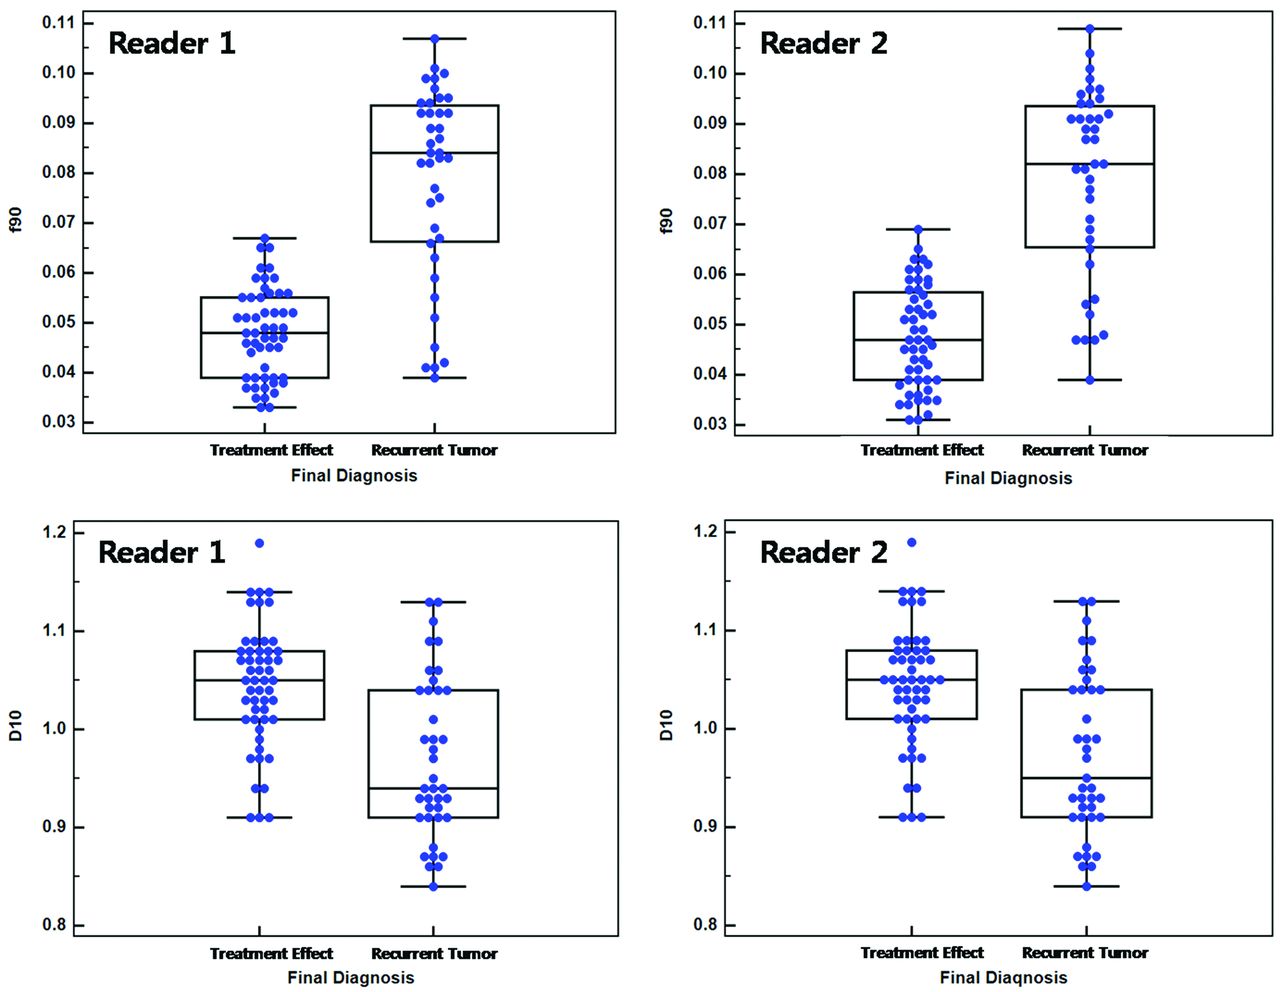
The mean ± SD of f90, D10, nCBV90, and ADC10 in both the recurrent tumor and treatment effect groups are shown in Table 2. The mean f90 showed statistically significant differences between recurrent tumor and treatment effect, with the recurrent tumor group showing a higher f90 (mean of 0.079 versus 0.048 for reader 1 and 0.081 versus 0.046 for reader 2; P < .001 for each). The mean D10 was significantly lower in the recurrent tumor group (mean of 0.970 [10−3mm2s−1] and 0.967 for readers 1 and 2, respectively) than in the treatment effect group (mean of 1.043 and 1.045 for readers 1 and 2, respectively) (P < .001 for each). Figure 4 shows a number of patients in the recurrent tumor group within an overlap zone where misclassifications can occur (10 of 39 patients for reader 1; 12 of 39 patients for reader 2).
Differences in the imaging parameters in patients with recurrent tumor and those with treatment effect

Box-and-whisker plots for the IVIM-derived f and D values between recurrent tumor and treatment effect for both readers.
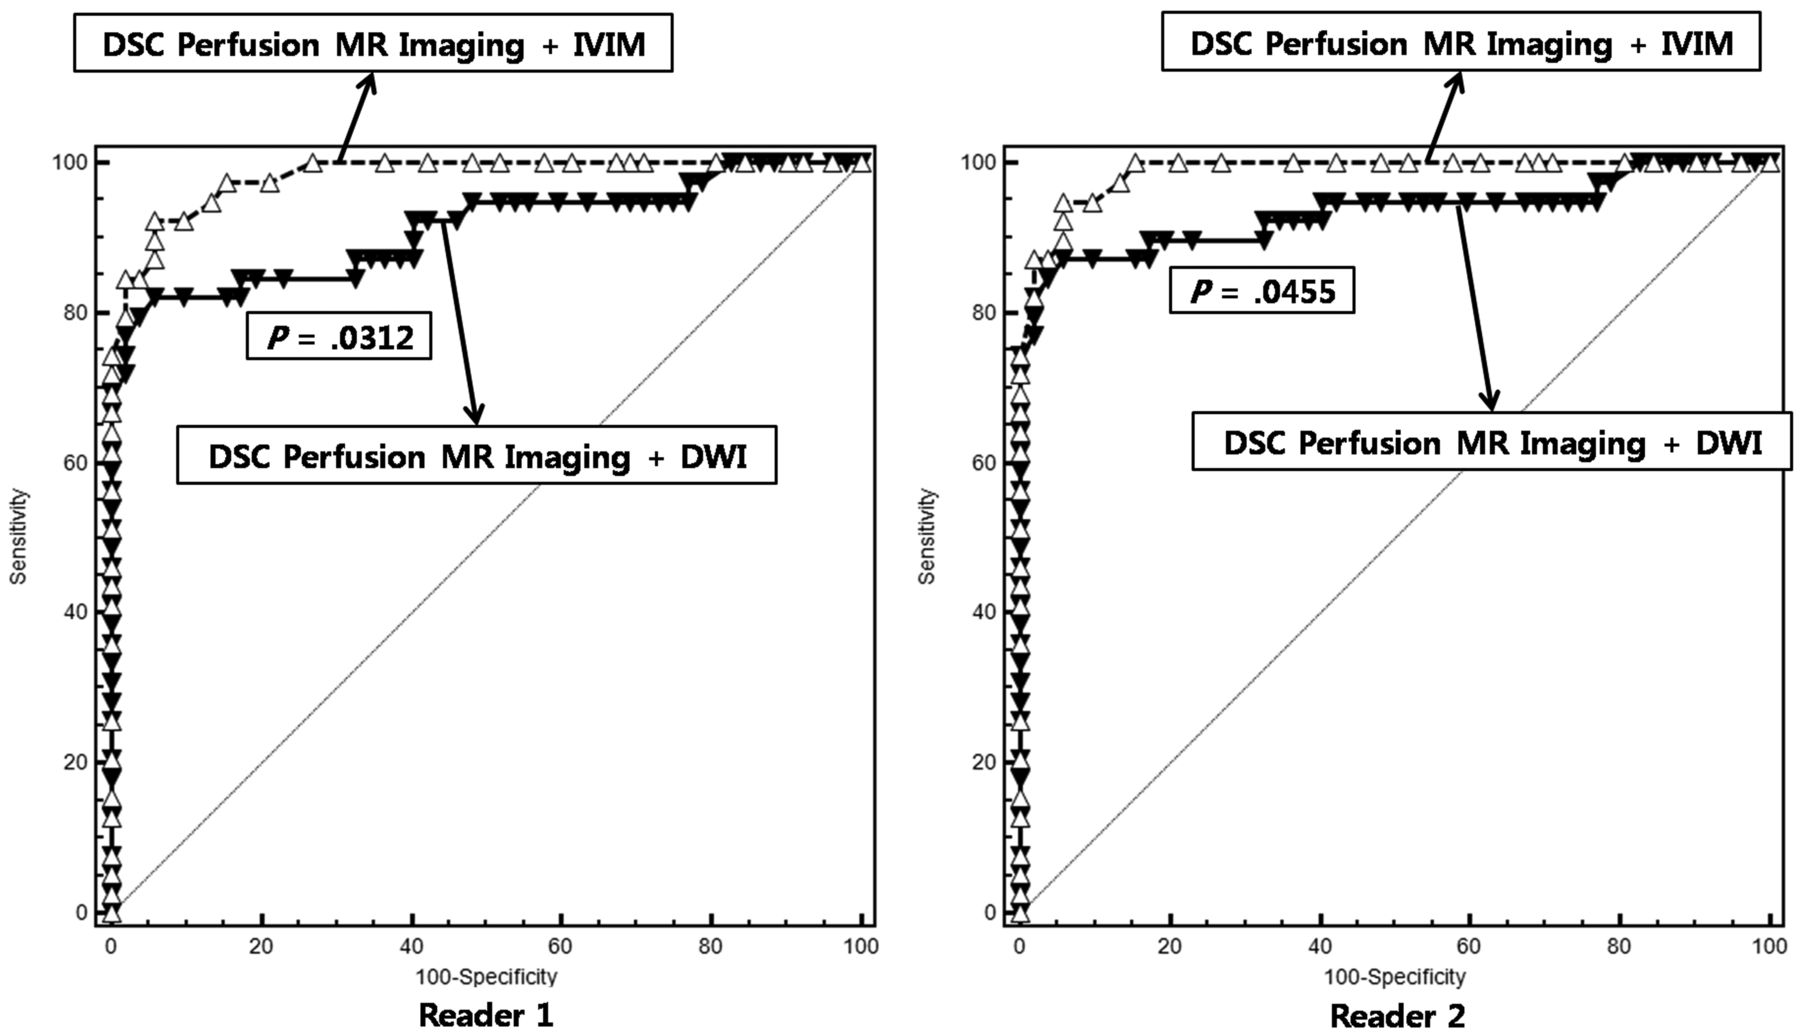
The combination of DSC perfusion MR imaging with IVIM showed a significantly larger area under the receiver operating characteristic curve than the combination of DSC perfusion MR imaging with DWI (area under the receiver operating characteristic curve of 0.911 versus 0.982 for reader 1, P = .0312; area under the receiver operating characteristic curve of 0.933 versus 0.987 for reader 2, P = .0455) (Table 3 and Fig 5). Table 4 shows the sensitivities and specificities of the imaging parameters for distinguishing recurrent tumor from treatment effect when all 91 patients were regarded as a training set. With the combination of f90 and D10 used as a discriminative index, the sensitivity and specificity for differentiation were 79.5% and 92.3% for reader 1 and 84.6% and 94.2% for reader 2, respectively. With the combination of nCBV90 and ADC10 used as a discriminative index, the sensitivity and specificity were 69.2% and 100.0% for reader 1 and 74.3% and 100.0% for reader 2, respectively. Compared with the combination of DSC perfusion MR imaging and DWI, adding IVIM to DSC perfusion MR imaging improved the diagnostic accuracy from 86.8% to 92.3% for reader 1 and from 89.0% to 93.4% for reader 2, respectively (Table 4).
ROC analysis of MR imaging methods and their combination

The graph shows the comparison between the receiver operating characteristic curve for the combination of DSC MR imaging and IVIM and for the combination of DSC MR imaging and DWI. The combination of DSC MR imaging and IVIM resulted in a significantly higher area under the receiver operating characteristic curve than the combination of DSC MR imaging and DWI for both readers, thus indicating improved diagnostic performance.
Diagnostic performance of MR imaging methods and their combination
Interreader Agreement
Table 5 summarizes the interreader agreement by using the corresponding ICCs. Interreader agreement was highest for measurement of f90 (ICC, 0.89) and was lowest for measurement of the 90th percentile histogram cutoff of D* (ICC, 0.42). The ICCs between readers were higher for calculations of the perfusion parameters including f90 and nCBV90 (ICC range, 0.84–0.89) than for calculations of the diffusion parameters including D10 and ADC10 (ICC range, 0.68–0.79).
Interreader ICC for measurements of imaging parameters
Discussion
Our study findings demonstrate that IVIM-derived perfusion and diffusion parameters can be used to distinguish recurrent tumor from treatment effect in patients with post-GKRS metastatic tumor. We found that the combination of f90 and D10, compared with the combination of nCBV90 and ADC10, provided better diagnostic performance of the MR imaging protocol for differentiating recurrent tumor versus treatment effect. Furthermore, the diagnostic model that added IVIM-derived parameters to DSC perfusion MR imaging performed better than the DSC perfusion MR imaging before the IVIM-derived parameters were added. We found that the highest interreader agreement in the detection of recurrent tumor after GKRS was achieved with f90 measurement. However, the D* value was poorly reproducible, presumably due to its high sensitivity to capillary blood flow and any partial volume effect with CSF-filled or necrotic spaces. This finding is consistent with the results of a previous study.9 Therefore, we did not use the D* in the evaluation of the diagnostic performance of IVIM.
Previously published reports have suggested that DSC perfusion MR imaging based on the measurement of the first-pass T2* effect of a bolus of paramagnetic exogenous contrast material has the potential to distinguish tumor recurrence from treatment effect by using relative CBV maps.10,11 IVIM has a unique capillary dependence, which is not sensitive to the coherent laminar flow of arteries and veins. The measurement of IVIM is intrinsically local (ie, the encoding and readout are done at the same location).4 Although the IVIM parameters estimated from the biexponential model could be sensitive to noise and to the initial values used for data fitting, IVIM MR imaging using spin-echo-based DWI can be less sensitive to the T2* susceptibility artifacts than DSC MR imaging. Moreover, in our clinical experience, IVIM MR imaging allowed both diffusion and perfusion measures within corresponding solid lesions. The significant difference in f90 between the recurrent tumor and the treatment effect groups is consistent with previous reports in which tumor recurrence had a higher relative CBV than treatment-related effect.1,10 Remarkably, in our study, we identified the better diagnostic performance of IVIM-derived perfusion and diffusion parameters for differentiating recurrent tumor from treatment effect, compared with the combination of DSC perfusion MR imaging with DWI.
Le Bihan et al5 suggested that the f-value measures the fractional volume of capillary blood flowing in each voxel. Recurrent tumors are usually higher grade tumors with increased neoangiogenesis, which leads to increased microvascular attenuation and increased permeability surface area product. In our study, we did not find any visual discordance between the nCBVs and IVIM-derived perfusion parameters for differentiating recurrent tumor from treatment effect. However, these 2 perfusion parameters represent different aspects of tumor vessels. CBV primarily measures microvascular attenuation, and f measures microscopic translational motion associated with microcirculation of the blood. Moreover, spin-echo-based IVIM imaging has a substantially different vessel-size sensitivity profile from that of gradient-echo-based DSC MR imaging. The relation between the IVIM-derived perfusion parameters and the contrast-enhanced perfusion parameters has been studied theoretically,12 but clinical validation is still lacking. Although our prior study indicated that f90 showed a significant correlation with the nCBV90 in patients with posttreatment glioblastomas,13 further studies that correlate the IVIM-derived perfusion fraction with various MR perfusion parameters, including cerebral blood flow and the permeability parameter, will be needed to understand the exact meaning of the IVIM-derived perfusion parameter.
The ADC has shown the potential to distinguish tumor regrowth from radiation injury. Several previous studies have shown that the ADC value derived from a monoexponential model can help differentiate tumor recurrence from treatment-related change.14,15 Most interesting, our study showed that D10 differed more significantly between the recurrent tumor and the treatment effect groups than did ADC10. Although the exact pathophysiologic mechanism for determining the difference between the ADC10 and D10 results is unclear, the significant perfusion difference between the recurrent tumor and the treatment effect groups may contribute to the ADC-D difference. Similarly, Yamada et al16 reported lower IVIM-derived D values compared with ADC seen in enhancing lesions of the liver, thus confirming that the ADC is contaminated by perfusion.
Our study has several limitations. The primary limitation of this initial-experience study was the bias introduced by only including patients clinically suspected of having recurrent tumor or treatment effect. Therefore, some patients with equivocal clinical and image findings that did not meet our clinicoradiologic diagnostic criteria, such as prolonged asymptomatic increases of a contrast-enhancing lesion, were excluded from this study. This exclusion did not allow us to accurately assess sensitivities and specificities for random, consecutive patients. However, this group of patients was the most clinically relevant for accurate noninvasive assessment of post-GKRS metastatic tumors, to minimize unnecessary, additional diagnostic procedures. Second, the number of study patients was relatively small; this size can reduce the statistical power for the superiority of IVIM imaging over other MR imaging techniques. Further prospective analyses with a larger number of patients will be needed to validate our results. Third, because there was no case with histopathologically diagnosed recurrent tumor or radiation necrosis in this study, we would caution against overinterpretation of our study results. A direct image-guided histopathologic correlation for recurrent tumor and radiation necrosis is needed for further validation of IVIM-derived parameters. Such a study may confirm the efficacy of the techniques described in this article.
Fourth, the set of b-values used in our study was not optimized. The number of b-values may affect a robust curve fitting for diffusion signal decay, especially in the lower range of b-values. Moreover, the b-values might be further optimized in a separate study as a function of the available IVIM parameter values in the brain, to achieve a shorter examination time without sacrificing the precision of the techniques. Fifth, the quantitative assessment of IVIM-parameters in the brain is even more complicated due to its anisotropic diffusion. The deconvolution of multiexponential processes like water diffusion in living tissue is a strongly ill-posed problem, and a large number of signal points and signal-to-noise ratio are necessary for a reliable separation of >1 exponential time constant.17 The evaluation of current fitting modalities for IVIM data and investigation of their limitations in relation to SNR and the number of b-values are, therefore, prudent.
Last, if the IVIM techniques merely “diagnose” tumor response or progression, one labor-intensive analysis by using IVIM is more accurate than another labor-intensive analysis by using DSC perfusion MR imaging; however, conventional MR imaging studies are the reference standard for diagnosis. Nevertheless, the rationale for our study can be summarized as follows: First, new advanced MR imaging techniques are more accurate and could avoid a stereotactic biopsy for histologic assessment, the only reliable but invasive method; second, in this field, the results of advanced imaging studies suggest encouraging results, but comparative studies are needed to investigate the relationship, diagnostic performance, and complementary character of advanced MR imaging techniques. Last, an increased size of contrast-enhancing lesions on follow-up MR imaging study not only creates management dilemmas but is also anxiety-provoking for patients and clinicians.
Conclusions
IVIM imaging may be helpful in making a more accurate diagnosis of recurrent tumor and can be used as a potential, noninvasive imaging biomarker for monitoring the treatment response in patients with post-GKRS metastatic tumor. Moreover, adding IVIM imaging to an MR imaging protocol improves the diagnosis of recurrent tumor beyond that achieved by using the combination of DSC perfusion MR imaging and DWI.
Footnotes
This research was supported by Basic Science Research Program through the National Research Foundation of Korea funded by the Ministry of Education, Science and Technology (grant 2011-0002629).
Indicates open access to non-subscribers at www.ajnr.org
References
- Received February 8, 2014.
- Accepted after revision April 3, 2014.
- © 2014 by American Journal of Neuroradiology


