
Abstract
BACKGROUND AND PURPOSE: It may be challenging to differentiate primary CNS lymphomas, especially primary CNS lymphomas with atypical MR features, from tumefactive demyelinating lesions by the use of conventional MR. This study aimed to investigate the usefulness of 1H-MR spectroscopy for making this discrimination.
MATERIALS AND METHODS: Forty-four patients with primary CNS lymphomas and 21 with tumefactive demyelinating lesions were enrolled. Single-voxel (TE = 144 ms) 1H-MR spectroscopy scans with the use of the point-resolved spectroscopy sequence were retrospectively analyzed. The Cho/Cr and Cho/NAA area ratios were calculated. The lipid and/or lactate peak was visually categorized into 5 grades on the basis of comparison with the height of the Cr peak. The 1H-MR spectroscopy findings were compared in all of the primary CNS lymphomas and the tumefactive demyelinating lesions and in the subgroup of atypical primary CNS lymphomas and tumefactive demyelinating lesions. The thresholds and added value of 1H-MR spectroscopy to conventional MR were calculated by use of receiver operating characteristic curves.
RESULTS: Discrepancies between all of the primary CNS lymphomas and tumefactive demyelinating lesions were found in the Cho/Cr ratio (P = .000), Cho/NAA ratio (P = .000), and the lipid and/or lactate peak grade (P = .000). Lymphoma rather than tumefactive demyelinating lesions was suggested when the Cho/Cr ratio was >2.58, the Cho/NAA ratio was >1.73, and a high lipid and/or lactate peak grade (grade >3) was seen. Higher Cho/Cr ratios, Cho/NAA ratios, and lipid and/or lactate peak grades were found in atypical primary CNS lymphomas when compared with those of tumefactive demyelinating lesions. The area under the receiver operating characteristic curve of conventional MR was improved from 0.827 to 0.870 when Cho/NAA ratio was added in the uncertain cases.
CONCLUSIONS: 1H-MR spectroscopy may be useful for differentiating primary CNS lymphomas from tumefactive demyelinating lesions. Cho/NAA ratio could provide added value to conventional MR imaging.
ABBREVIATIONS:
- PCNSL
- primary central nervous system lymphoma
- TDL
- tumefactive demyelinating lesion
- lip-lac
- lipid and/or lactate peak
- ROC
- receiver operating characteristic
- AUC
- area under the receiver operating characteristic curve
Primary central nervous system lymphomas (PCNSLs) are aggressive tumors that represent approximately 1–6% of primary intracranial neoplasms.1 Their incidence has been increasing during the past 2 decades not only in immunocompromised patients but also in immunocompetent patients.2,3 Typical MR imaging features of PCNSLs are characterized by their periventricular locations, well-defined margin, moderate or marked edema, and intense and homogeneous nodular enhancement and are usually easy to correctly diagnose.4⇓–6 However, some patients present with atypical MR imaging features, commonly those of heterogeneous enhancement, such as patchy enhancement, streaky enhancement without mass formation, or even no enhancement.6⇓⇓–9
Demyelinating diseases of the CNS are pathologic entities that are frequently encountered in clinical practice. When such lesions appear as solitary masses >2 cm in the longest diameter, they are defined as tumefactive demyelinating lesions (TDLs), and they can cause symptoms mimicking brain neoplasms and can be associated with variable enhancement on MR imaging.10 Differentiation between PCNSLs and TDLs by use of conventional MR can sometimes be challenging, especially when there are atypical MR imaging features in PCNSLs. Considering the rapid progress of PCNSLs, early differentiation is important because both the treatment effectiveness and the patient survival rate will substantially decrease if there is delayed radiation therapy and/or chemotherapy.7 Accurate differentiation is also important to avoid unnecessary biopsies of TDLs.
1H-MR spectroscopy can provide noninvasive biochemical information regarding in vivo tissue. Some authors have suggested that 1H-MR spectroscopy is helpful for discriminating tumors and pseudotumors,11,12 whereas others argue that it may not be so, because there is some overlap of the metabolites.13,14 There are many published 1H-MR spectroscopy studies of PCNSLs as well as TDLs3,10,15,16; however, to our knowledge, there is still no 1H-MR spectroscopy study that distinguishes PCNSLs from TDLs. Our current study attempts to investigate the potential clinical utility of 1H-MR spectroscopy for differentiating PCNSLs from TDLs and further focuses on evaluating whether 1H-MR spectroscopy is also helpful for discriminating PCNSLs with atypical MR imaging features from TDLs.
Materials and Methods
This retrospective study was approved by our institutional review board, and the requirement for informed consent was waived.
Study Subjects
Sixty-nine patients with PCNSL and 35 patients with TDL, all of whom had undergone conventional MR imaging and 1H-MR spectroscopy between June 2006 and May 2012, were selected from our institution data base. The inclusion criteria were as follows: 1) histologically proven PCNSLs by stereotactic biopsy or surgical resection; 2) histologically proven or clinically diagnosed TDLs; with 3) 1H-MR spectroscopy on intermediate TE (144 ms) and conventional MR including T1WI, T2WI, FLAIR, and contrast-enhanced T1WI. The clinical diagnosis of TDL was based on the following criteria: 1) acute or subacute onset of neurologic symptoms and signs; 2) at least 1 brain lesion with the longest diameter ≥2 cm seen on MR; 3) no evidence of systemic illness, vasculitis, toxic or metabolic disease, or CNS infection seen on extensive laboratory testing. The final diagnosis of TDL was made on the basis of histopathologic findings or a strong clinical suspicion supported by the patient's clinical course and the follow-up MR findings.
For a subgroup comparison of PCNSLs with TDLs, patients with PCNSL were further divided into 2 subgroups on the basis of enhancement patterns seen on conventional MR: 1) typical PCNSLs had nodular and homogeneous enhancement; and 2) atypical PCNSLs with various types of heterogeneous enhancement, including patchy infiltrative, streaky infiltrative, ring enhancement, or lack of enhancement.
Fourteen patients with PCNSL and 6 patients with TDL with unsatisfactory 1H-MR spectroscopy, including noisy baseline, motion artifact, and inappropriate ROI that contained too much normal tissue, were excluded. Eight patients with PCNSL and 3 patients with TDL with only multivoxel 1H-MR spectroscopy were excluded. Three patients with PCNSLs without pathologic confirmation and 5 patients with TDL who neither met all the clinical diagnostic criteria nor had pathologic confirmation were also excluded.
A total of 44 patients with PCNSL (31 men, 13 women; 13–76 years of age) and 21 patients with TDL (10 women, 11 men; 22–66 years of age) were finally identified according to all of the criteria we used. Among the patients with PCNSLs, there were 24 patients with typical PCNSLs (16 men, 8 women; 13–76 years of age) and 20 patients with atypical PCNSLs (15 men, 5 women; 26–68 years of age). Forty-two patients (95.5%) with PCNSLs were confirmed as having diffuse large B-cell lymphoma, whereas the other 2 patients were confirmed as having malignant lymphoma with atypical large cells and histiocytic sarcoma. TDLs were diagnosed by brain biopsy in 6 patients (28.6%) and by clinical follow-up and repeat MR imaging in 15 patients (71.4%).
Acquisition and Analysis of Conventional MR Imaging
Conventional MR imaging was performed in all of the study patients with the use of a 3T MR system (Achieva; Philips Healthcare, Best, the Netherlands), including fast spin-echo T1WI (TR, 500 ms; TE, 10 ms; section thickness, 5 mm; FOV, 230 mm; matrix, 512 × 512), T2WI (TR, 3000 ms; TE, 80 ms; section thickness, 5 mm; FOV, 230 mm; matrix, 512 × 512), FLAIR (TR, 10,000 ms; TE, 125 ms; section thickness, 5 mm; inversion time, 2200 ms; FOV, 230 mm; matrix, 512 × 512), and contrast-enhanced T1WI after intravenous injection of 0.1 mmol/kg gadoterate meglumine (Dotarem; Guerbet, Paris, France).
Two readers (D.Y.K., S.H.C.) with 9 and 5 years of experience in radiology, respectively, and blinded to the diagnosis, evaluated the conventional MR images by use of a 5-point confidence scale on the basis of lesion number, location, signal intensity, and mass effect on T1WI, T2WI, and FLAIR, as well as enhancement pattern on contrast-enhanced T1WI: grade 1: quite certainly TDL; grade 2: probably TDL; grade 3: equivocal; grade 4: probably PCNSL; grade 5: quite certainly PCNSL. Final decisions were made by consensus of the 2 readers and used for analysis.
Acquisition and Analysis of Proton MR Spectroscopy
Single-voxel 1H-MR spectroscopy with the use of the point-resolved spectroscopy sequence was performed (TR, 2000 ms; TE, 144 ms; average 128). A volume of interest was placed on the basis of the abnormal signal intensity lesions seen on T2WI, FLAIR, and the enhancing portion of lesions seen on contrast-enhanced T1WI. The voxel size ranged from 3–8 mL. Spectrum analysis was performed with baseline correction, phase correction, and noise filtering to improve the quality of 1H-MR spectroscopy in SpectroView software (Philips Healthcare).
The metabolites assessed were Cho at 3.22 ppm, Cr at 3.02 ppm, NAA at 2.02 ppm, lipid at 0.8 to 1.3 ppm, and lactate at 1.33 ppm. Lactate peak is identified as an inverted doublet peak at TE = 144 ms. However, the anomalous J modulation can cause signal loss for lactate, which leads to complicated assessment of the presence or absence of lactate in the voxel, particularly complicated by the presence of lipid resonances. This problem has been identified previously.16⇓–18 Therefore, they were not separated in this study and were recorded as the lipid and/or lactate (lip-lac) peak.
For the analysis of 1H-MR spectroscopy, Cho/Cr and Cho/NAA peak area ratios were calculated. For the analysis of the lip-lac peak, the height of the lip-lac peaks was used instead of the peak area because it was not possible to accurately measure the areas. Lip-lac peaks were visually categorized into 5 grades on the basis of comparison with the height of the Cr peak by 2 readers (D.Y.K., S.H.C.): grade 1, no definite lip-lac peak; grade 2, any single peak (upward or downward) smaller than the Cr peak; grade 3, both peaks smaller than the Cr peak; grade 4, any single peak 1 to 3 times higher than the Cr peak; and grade 5, any single peak >3 times higher than the Cr peak. Final decisions were made by consensus of the 2 readers and used for analysis.
Statistical Analysis
Inter-rater agreement was measured by use of weighted κ statistics. Conventional MR imaging features and grades of PCNSLs and TDLs were compared by means of Pearson χ2 test when appropriate or Fisher exact test. The Cho/Cr and Cho/NAA ratios were compared by use of the Student t test in all the PCNSLs and the TDLs. The Mann-Whitney U test was used to evaluate the difference of lip-lac grades between the 2 groups. Receiver operating characteristic curve (ROC) analyses were used to determine the optimum thresholds of the ratios and to evaluate their diagnostic performance for differentiating the 2 entities. The area under the receiver operating characteristic curve (AUC), sensitivity, and specificity were then calculated. The same statistical analysis was repeated in the atypical PCNSLs and TDLs groups.
The receiver operating characteristic curve was also constructed to assess the added value of 1H-MR spectroscopy to conventional MR imaging in the differential diagnosis between PCNSLs and TDLs. The diagnostic performance of conventional MR alone was evaluated first. Afterward, we tested whether combined 1H-MR spectroscopy and conventional MR could improve the diagnosis when the conventional imaging results were uncertain (grades 2–4).
All the statistical analyses were performed with the use of commercially available software (SPSS, version 13.0, IBM, Armonk, New York, and MedCalc, version 12.3.0, Mariakerke, Belgium). A difference of P < .05 was considered statistically significant.
Results
Conventional MR Imaging Manifestations and Grades
On conventional MR images, a single lesion was observed in 24 PCNSLs and in 8 TDLs, whereas multiple or diffuse lesions were found in 14 and 6 patients with PCNSL and in 9 and 4 patients with TDL, respectively. No statistical difference was found between PCNSLs and TDLs (P = .463).
Variable enhancement patterns were observed in both PCNSLs and TDLs, including homogeneous enhancement, open-ring or ring enhancement, patchy infiltrative enhancement, streaky infiltrative enhancement, and no contrast enhancement. Twenty-four PCNSLs were considered as typical PCNSLs (grade 5) that were homogeneously enhanced and certainly diagnosed on the basis of conventional MR imaging, whereas the remaining 20 PCNSLs were uncertain cases. Five TDLs were evaluated as grade 1, and 16 TDLs were considered as grade 2–5. The weighted κ value for inter-rater agreement was 0.602. Both enhancing patterns and conventional MR grades between PCNSLs and TDLs were significantly different (P = .000 and P = .000, respectively).
The conventional MR imaging features and grades of the PCNSLs and TDLs are summarized in Table 1.
Conventional MR imaging features and grades of PCNSLs and TDLs
Quantitative Analysis of 1H-MR Spectroscopy
The diagnostic performance of the Cho/Cr ratio, Cho/NAA ratio, and lip-lac grade are summarized in Table 2.
Diagnostic performance of the Cho/Cr ratio, Cho/NAA ratio, and lip-lac grade
The Cho/Cr ratio and Cho/NAA ratio were significantly different between PCNSLs and TDLs (P = .000 and P = .000, respectively). PCNSLs demonstrated higher Cho/Cr and Cho/NAA ratio than TDLs (Figs 1 and 2). The AUC of the Cho/Cr ratio and the Cho/NAA ratio was 0.849 and 0.885, respectively. The optimal cutoff values for differentiating PCNSLs from TDLs were 2.58 for the Cho/Cr ratio and 1.73 for the Cho/NAA ratio.

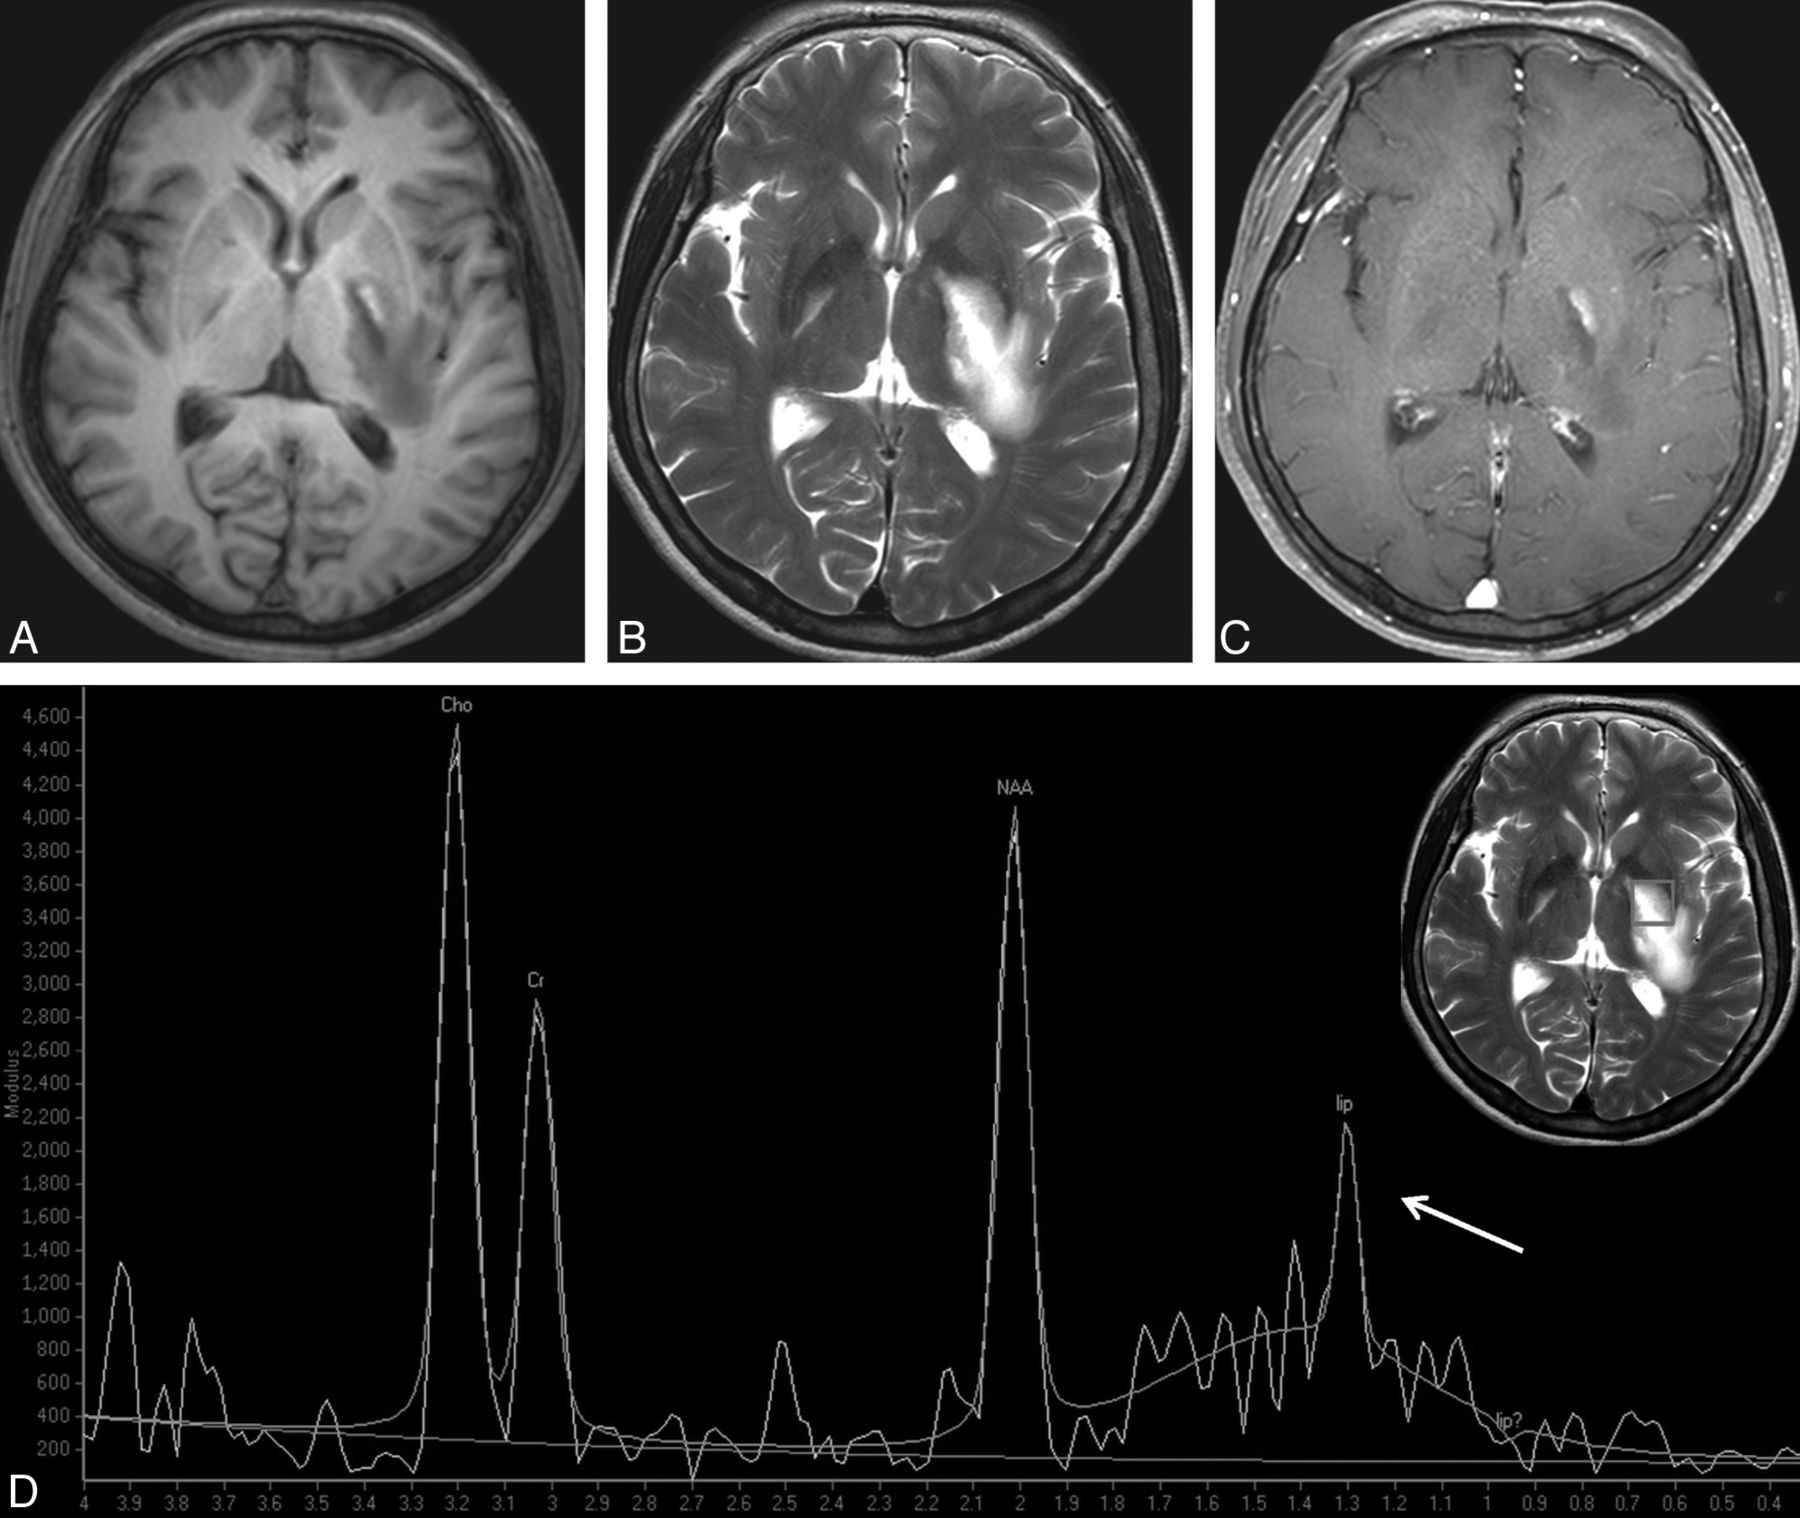
Typical PCNSL in a 47-year-old woman. A round mass is located in the left thalamus and with hypointensity on T1WI (A) and hyperintensity on T2WI (B). Homogeneous enhancement is observed on contrast-enhanced T1WI (C). D, 1H-MR spectroscopy demonstrates the remarkably increased Cho peak and the decreased NAA peak, both of which give rise to a high Cho/Cr ratio (6.47) and a high Cho/NAA ratio (3.57). A very high lip-lac peak (grade 5) is shown (arrow).

TDL in a 35-year-old woman. A well-defined lesion is shown in the left basal ganglia, and with predominant hypointensity on T1WI (A), hyperintensity on T2WI (B), and focal peripheral enhancement on contrast-enhanced T1WI (C). Spectrum (D) demonstrates an elevated Cho resonance. The Cho/Cr ratio is not as high as that of PCNSL (1.62). The low Cho/NAA ratio (1.09) strongly supports the diagnosis of TDL. A grade 2 lip-lac peak, caused by the necrosis component, is observed (arrow).
Higher Cho/Cr and Cho/NAA ratios were consistently found in the atypical PCNSLs compared with those of the TDLs (P = .003 and P = .001, respectively, Fig 3). The AUC of the Cho/Cr ratio and the Cho/NAA ratio was 0.785 and 0.883, respectively. The optimum threshold value was 2.39 for the Cho/Cr ratio and 1.73 for the Cho/NAA ratio. In 2 nonenhancing PCNSLs, the Cho/Cr ratios or Cho/NAA ratios were not higher than the threshold values for PCNSLs. Differences of the Cho/Cr ratio and Cho/NAA ratio among all of the PCNSLs, atypical PCNSLs, and TDLs are displayed in Fig 4.

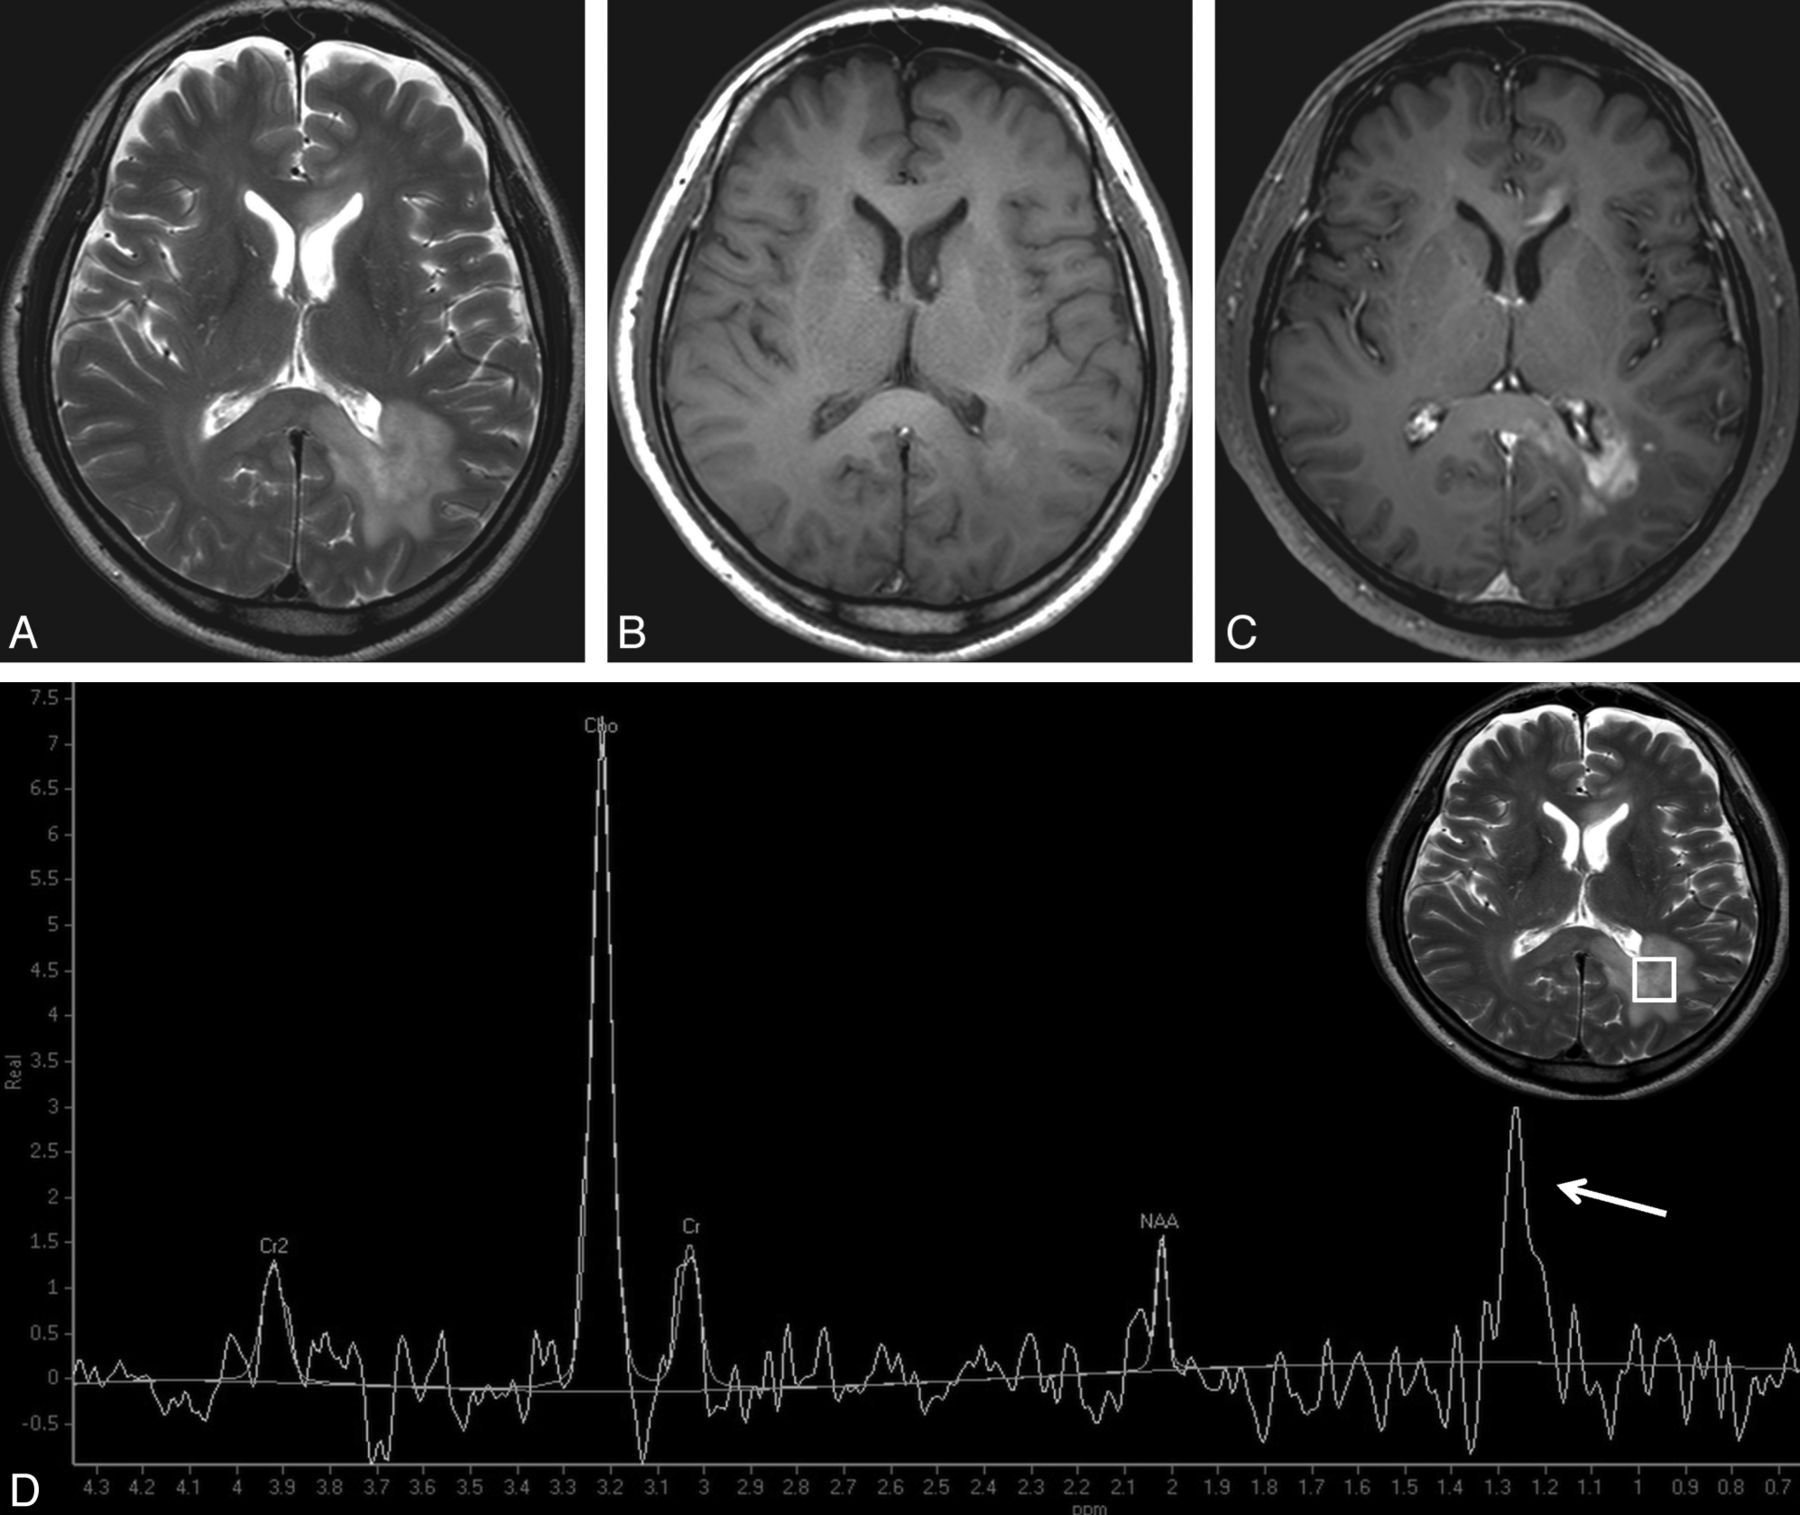
Atypical PCNSL in a 59-year-old man. Multiple lesions are observed in left parieto-occipital periventricular white matter, genu, and splenium of the corpus callosum, with hyperintensity on T2WI (A), isointensity on T1WI (B), and patchy infiltrative enhancement on contrast-enhanced T1WI (C). D, The Cho/Cr ratio and the Cho/NAA ratio are 4.55 and 8.46, respectively. Both obvious elevation of the Cho peak and reduction of the NAA peak strongly suggest tumor rather than TDL. A high lip-lac peak (grade 4) is observed in this case (arrow).

Box lots of the Cho/Cr ratio and the Cho/NAA ratio of all the PCNSLs, atypical PCNSLs, and TDLs. All of the PCNSLs as well as atypical PCNSLs reveal a higher Cho/Cr ratio (A) and higher Cho/NAA ratio (B) than TDLs. Some very high Cho/Cr and Cho/NAA ratios are observed exclusively in PCNSLs (circles).
The weighted κ value for inter-rater agreement of lip-lac grade was 0.739. Lip-lac peaks were noted in 40 of the 44 (90.9%) patients with PCNSL and in 12 of the 21 (57.1%) patients with TDL. A substantial difference in lip-lac grades was found when all of the patients were analyzed (P = .000). High lip-lac peaks (> grade 3) were mostly observed in PCNSLs (n = 21), especially in nodular enhancing PCNSLs (n = 14) (Fig 1), whereas only one high lip-lac peak (grade 4) was found in a TDL, which had central necrosis. Very high lip-lac peaks (grade 5) were only observed in 10 of 44 (22.7%) PCNSLs, including 8 typical PCNSLs and 2 atypical PCNSLs. The lip-lac grades of atypical PCNSLs were also higher than those of TDLs (P = .005).
In addition, the Cho/Cr ratio of typical PCNSLs were found to be higher than those of atypical PCNSLs (P = .018), whereas no differences of the Cho/NAA ratio and lip-lac grade were found between the typical and atypical PCNSLs (P = .152 and P = .058, respectively).
Assessment of the Added Value of 1H-MR Spectroscopy
The AUC for conventional MR imaging alone to differentiate PCNSLs from TDLs was 0.827 (95% CI, 0.713, 0.910).
Thirty-five cases were classified as grade 2–4 according to the conventional MR imaging, including 20 PCNSLs and 15 TDLs. When Cho/NAA ratio was added to conventional MR imaging in those cases, the diagnosis could be improved in 29 of 35 cases (82.9%), and the AUC was improved to 0.870 (95% CI, 0.713, 0.959). However, the Cho/Cr ratio and lip-lac grade did not improve the diagnostic accuracy of conventional MR imaging.
Discussion
We intended to investigate whether 1H-MR spectroscopy was useful for discriminating PCNSLs and TDLs and was also useful for discriminating PCNSLs with atypical MR features and TDLs. Our results suggest that the Cho/Cr ratio, the Cho/NAA ratio, and the lip-lac grade were significantly different between PCNSLs and TDLs. PCNSL rather than TDL was suggested when the Cho/Cr ratio was >2.58, the Cho/NAA ratio was >1.73, and when there was a high lip-lac grade (grade >3) seen on MR spectroscopy. 1H-MR spectroscopy was also useful in discriminating atypical PCNSLs and TDLs. Cho/NAA ratio could provide added value to conventional MR imaging.
Discrimination between PCNSLs and TDLs has important diagnostic and therapeutic implications, and conventional MR imaging is a successful technique for evaluating both. However, differentiation can be complicated by atypical or ambiguous MR imaging features. Many advanced imaging techniques are now used clinically in the attempt to distinguish the 2 entities. DWI has been used with success. PCNSLs tend to have a low ADC value because of high cellularity, whereas TDLs are usually associated with elevated ADC values.10,19 However, at times, an acute demyelinating lesion may also have areas of low ADC values, which makes it difficult to differentiate from tumors.20 Cha et al21,22 summarized the perfusion MR imaging features of brain tumors. The typical PWI feature of PCNSL is low relative CBV compared with that of high-grade gliomas and metastasis. However, TDLs are also reported to have low relative CBV. Although in the Cha et al23 report, PCNSLs tended to have higher relative CBV than TDLs, the difference was less pronounced.
1H-MR spectroscopy provides noninvasive assessment of lesion metabolism, which makes it a potentially useful adjunct tool. In our study, elevated Cho and decreased NAA peak were observed in both PCNSLs and TDLs and are consistent with the findings of previous reports.10,15,16 The increase in Cho is thought to result from rapid membrane turnover, high mitotic activity, and dense cellularity in PCNSL and from inflammatory cellular infiltration, reactive astrogliosis, and demyelination in TDL.13,16,24 The decreased NAA reflects the neuronal destruction, axonal damage, early axonal degeneration, and decreased axonal density.13,24 Our results suggest that an increase of Cho and a decrease of NAA in PCNSLs were more obvious than those seen in TDLs. This is probably because PCNSLs have a more increased phosphocholine turnover as the result of the membrane biosynthesis caused by proliferating cells, dense cellularity, and larger loss, dysfunction, or displacement of normal neuronal tissue, compared with TDLs.
A high lipid peak in PCNSLs and a variable lip-lac peak in patients with TDL have been previously noted by many other researchers.1,3,10,15,16 In our study, we classified the lip-lac grade by visual judgment, which could easily be applied in daily clinical practice. We found that a high-grade lip-lac (grade >3) was mostly shown in PCNSLs regardless of whether there was necrosis. In a previous report, Raizer et al16 stated that a markedly elevated lipid in lymphoma might be helpful in differentiating it from glioma, and our observation was similar to theirs. A high lip-lac peak was suggestive of PCNSL rather than of TDL.
Although the origin of the lipid is still unclear, it is thought to be associated with necrosis and membrane breakdown.25,26 However, a very high lipid peak in PCNSL may result from an increased turnover of the membrane components in transformed lymphoid cells rather than from necrosis, which has been reported in many homogeneously enhancing PCNSLs.16 In our study, 8 nodular enhancing PCNSLs showed a very high lip-lac peak (grade 5), which was consistent with that seen in previous reports. It is also possible that PCNSL is composed of numerous macrophages that also contribute to the lipid signal.27 The increase of lactate results from anaerobic metabolism, which is thought to be related to several mechanisms such as necrosis, demyelination, the inflammatory process, or mitochondrial dysfunction.14,25,28 In our study, the only patient with TDL with a high lactate peak had necrosis.
We also observed that the Cho/Cr ratio of typical, nodular PCNSLs was higher than that of atypical PCNSLs. This may be because homogeneously enhancing PCNSLs had more densely packed lymphoma cells than heterogeneously enhancing PCNSLs,29 such that they had more active cell division, rapid cell turnover with synthesis of membrane phospholipids, and higher Cho/Cr ratios. The lower Cho/Cr ratios of atypical PCNSLs may result in the decreased diagnostic performance of the Cho/Cr ratio for discriminating between atypical PCNSLs and TDLs.
In our 2 nonenhancing PCNSLs, 1H-MR spectroscopy was not helpful in differentiating them from TDLs. Nonenhancing PCNSLs were considered to be low-grade PCNSLs, less aggressive than typical PCNSLs in some previous studies.8,30 An autopsy report of a patient with PCNSL suggested that only scattered infiltration of malignant lymphomatous cells was observed in the nonenhancing tumor portion.29 Therefore, we speculate that the low cellularity and low invasiveness contributed to the nonspecific MR spectrum in those cases.
There are a number of limitations to our study. First, all the spectra in our study were based on intermediate TE 1H-MR spectroscopy. It has been reported that metabolites on short TE 1H-MR spectroscopy, such as the glutamate/glutamine peak, can help to differentiate TDL from neoplasm.13 Further study with the combination of long and short TE 1H-MR spectroscopy will be helpful for better discrimination of the 2 conditions. Second, pathology confirmation was lacking in 15 patients with TDL. However, supportive clinical and laboratory information as well as follow-up imaging helped us to make the final diagnosis. Third, our analysis of the lip-lac peak was not based on quantitative evaluation but was based on visual assessment. Because in many of our patients, accurate quantification was not possible, we considered it practical to use visual assessment. Difficulty in the assessment of the lipid or lactate in 1H-MR spectroscopy is well known, especially in a single TE study. Multiple TE studies (TE = 20, 144, and 288 ms) are desirable to accurately separate the lipid and lactate peak. Finally, the retrospective nature of our study should also be considered as a limitation.
Conclusions
In our study, PCNSLs showed differences from TDLs on 1H-MR spectroscopy. A higher Cho/Cr ratio (>2.58), higher Cho/NAA ratio (>1.73), and high lip-lac grade (grade >3) therefore suggest PCNSL rather than TDL. The 1H-MR spectroscopy findings are also helpful for discriminating PCNSLs with atypical MR features from TDLs. When conventional MR imaging features do not differentiate between PCNSLs and TDLs with certainly, the Cho/NAA ratio can provide added value. 1H-MR spectroscopy may be a useful tool for differentiating PCNSLs from TDLs.
References
- Received February 7, 2013.
- Accepted after revision April 29, 2013.
- © 2014 by American Journal of Neuroradiology


