
Abstract
BACKGROUND AND PURPOSE: Cerebrovascular oxygenation changes during respiratory challenges have clinically important implications for brain function, including cerebral autoregulation and the rate of brain metabolism. SWI is sensitive to venous oxygenation level by exploitation of the magnetic susceptibility of deoxygenated blood. We assessed cerebral venous blood oxygenation changes during simple voluntary breath-holding (apnea) and hyperventilation by use of SWI at 3T.
MATERIALS AND METHODS: We performed SWI scans (3T; acquisition time of 1 minute, 28 seconds; centered on the anterior commissure and the posterior commissure) on 10 healthy male volunteers during baseline breathing as well as during simple voluntary hyperventilation and apnea challenges. The hyperventilation and apnea tasks were separated by a 5-minute resting period. SWI venograms were generated, and the signal changes on SWI before and after the respiratory stress tasks were compared by means of a paired Student t test.
RESULTS: Changes in venous vasculature visibility caused by the respiratory challenges were directly visualized on the SWI venograms. The venogram segmentation results showed that voluntary apnea decreased the mean venous blood voxel number by 1.6% (P < .0001), and hyperventilation increased the mean venous blood voxel number by 2.7% (P < .0001). These results can be explained by blood CO2 changes secondary to the respiratory challenges, which can alter cerebrovascular tone and cerebral blood flow and ultimately affect venous oxygen levels.
CONCLUSIONS: These results highlight the sensitivity of SWI to simple and noninvasive respiratory challenges and its potential utility in assessing cerebral hemodynamics and vasomotor responses.
ABBREVIATIONS:
- ACPC
- anterior/posterior commissure
- SD
- standard deviation
Blood oxygen supply and metabolism are critical to maintaining normal brain function and are dependent on neurovascular coupling, a unique characteristic of the brain that ensures adequate CBF in response to neuronal activity. This mechanism is thought to be associated with intrinsic changes in the caliber of cerebral arteries secondary to neuronal-induced vasoactive stimuli. These vasoactive agents and metabolites include K+, nitric oxide, adenosine, and CO2 and have been shown to cause vasodilation of cerebral blood vessels and an increase in CBF.1,2 External vasoactive stimuli such as intravenous acetazolamide, ingestion of caffeine, and inhaled CO2 have also been shown to modulate CBF, leading to the appropriate downstream effect on blood oxygenation.3⇓⇓⇓⇓–8 These external hemodynamic modulators are of clinical interest because they are often used to evaluate cerebral hemodynamics and vasomotor responses, which can be impaired in many neurologic diseases such as stroke,9 Alzheimer disease,10 and multiple sclerosis.11,12
In line with the interest in cerebral vasomotor response in numerous neurologic diseases, respiratory challenges that can induce systemic changes in CO2 have been introduced as simple modulators of CBF because they do not require complicated equipment for gas delivery setup and can be easily repeated.13⇓⇓–16 Voluntary apnea, or breath-holding, results in a hypercapnic state, which has been shown to cause vasodilation and an increase in CBF. Conversely, voluntary hyperventilation results in a hypocapnic state, which decreases CBF by vasoconstriction.17,18 Because there is constant oxygen metabolism, increases in CBF will eventually lead to increases in venous blood oxygenation, whereas the opposite holds true for decreases in CBF.16
SWI uses venous blood oxygenation or deoxyhemoglobin as an intrinsic contrast agent to enhance venous vessel visibility and provides an opportunity to directly visualize the vasomotor response to stimuli. Although recent works have demonstrated that oxygen saturation changes caused by breathing carbogen or pure oxygen or ingesting caffeine can be visualized on SWI venography,6,19 few studies have addressed the sensitivity of SWI to simple and fast respiratory stresses.16 Fushimi et al16 demonstrated that SWI tissue signal changes reflected decreases in CBF and associated blood oxygenation changes as a result of hyperventilation. The venous conspicuity changes on SWI venograms related to simple alteration in respiratory pattern have not yet been directly defined. Thus, the aim of the present study is to quantitatively assess the sensitivity and degree of cerebral venous blood oxygenation changes in response to both voluntary breath-holding (apnea) and hyperventilation on SWI venous conspicuity.
MATERIALS AND METHODS
Ten healthy male volunteers (mean age, 34.7 ± 10.2 years) participated in the study. According to the institutional guidelines, all subjects gave informed written consent to the study approved by our institutional review board at New York University School of Medicine before MR imaging.
Experimental Design
All experiments were performed on a clinical 3T system (Tim Trio; Siemens, Erlangen, Germany) by use of a 12-channel array head coil. Axial T2- and T1-weighted images were acquired first and used as anatomic reference parallel to the line running through the anterior commissure and the posterior commissure (ACPC). SWI is a 3D, radiofrequency-spoiled fast low-angle shot gradient-echo sequence with flow compensation in all 3 directions. This gradient moment nulling in all 3 orthogonal directions reduces signal loss in blood attributable to flow dephasing. To avoid the susceptibility artifacts near the skull base, SWI was performed solely at the lateral ventricle level with the first section going through the ACPC line. The SWI scans were performed with the following parameters: TR/TE = 29/20 ms, flip angle = 15°, resolution = 0.4 × 0.4 mm2, section thickness = 1.2 mm, section number = 16, bandwidth = 120 Hz/pixel, and 1 acquisition. The total acquisition time of each SWI scan was 88 seconds without the use of parallel imaging.
The experimental design included 3 SWI scans with different breathing patterns: normal, breath-hold, and hyperventilation. Each subject was instructed by an investigator on how to perform these baseline and respiratory challenges before the start of the study. The participants were also instructed not to ingest caffeine for 6 hours before the scan. The baseline SWI with normal breathing was performed first, followed by the breath-holding scan. The subjects were instructed to start the breath-hold 10 seconds into the SWI scan. The breath-holding challenge was followed by a recovery period of 5 minutes with normal breathing and the head kept still. The third SWI scan was then started, at which point the participants were instructed to begin the hyperventilation challenge. Hyperventilation lasted throughout the entirety of the scan. Each scan (baseline, breath-hold, and hyperventilation) was obtained with the same imaging parameters, section number, orientation, and localization. The periods for breath-hold and hyperventilation were 30∼45 seconds and approximately 90 seconds (duration of scan), respectively, which were well tolerated in all participants. In addition to the constraint headphones and a cushion used to prevent movement during imaging, the subjects were instructed to keep the head still during the respiratory tasks for motion artifact control. A few participants complained of dizziness immediately after the experiment; however, none of the subjects had any procedure-related side effects 20 minutes after the scan.
Image Processing and Analysis
SWI is designed to enhance susceptibility contrast by use of phase information. The raw magnitude and phase from each SWI scan were obtained and used to generate an SWI venogram. As had been previously described,20 all phase images were reconstructed and corrected for field inhomogeneities by use of a 32 × 32 high-pass filter with the use of an in-house image-processing software (SPIN). Because the current Siemens system uses a left-handed system, the phase mask is defined such that the mask runs from unity to zero for positive phase values from 0 to 180° and unity for negative phase values from −180° to 0°. The original magnitude image was multiplied by this phase mask 4 times to enhance the visibility of venous structures. Finally, SWI venograms were created by use of an MIP performed over 8 sections, creating a total of 9.6-mm coverage centered around the ventricular body between the ACPC line and upper centrum semiovale to maintain consistency between subjects.
Quantification of the venous blood voxels was performed on the basis of these 12 SWI MIP images with enhanced venous visibility. A statistical thresholding algorithm,21 similar to what has been used to segment arteries,22 was used to isolate venous structures on the basis of their contrast with surrounding brain tissue. This algorithm involves first applying a threshold to remove background noise and structures (ie, skull).23 A shape-filtering noise removal algorithm was then used to remove falsely identified venous structures from the threshold-generated map. Further filtering of false-positives was performed by removal of clusters of connected voxels below a certain size.21 The compactness24 and relative anisotropy of connected voxels were then assessed by means of shape analysis to highlight clusters of venous structures. These clusters were displayed on color-coded venous vasculature maps, and the voxel number of each venous cluster was then finally quantified.25
One limitation to note is that very small veins that were visualized on the SWI MIP venogram may not have been identified by the thresholding algorithm because of signal attenuation from partial volume effects that limit the available contrast. However, because the thresholding parameters, imaging parameters, and position setting were consistent across all 3 SWI scans, the low contrast vessels were treated in a consistent manner, and we assumed that the difference in number of venous blood voxels between scans was caused by oxygenation changes associated with the respiratory challenges. The differences of segmentation results of venous blood on SWI venography between SWI scans were assessed by use of the paired t test, with a value of P < .05 considered statistically significant.
RESULTS
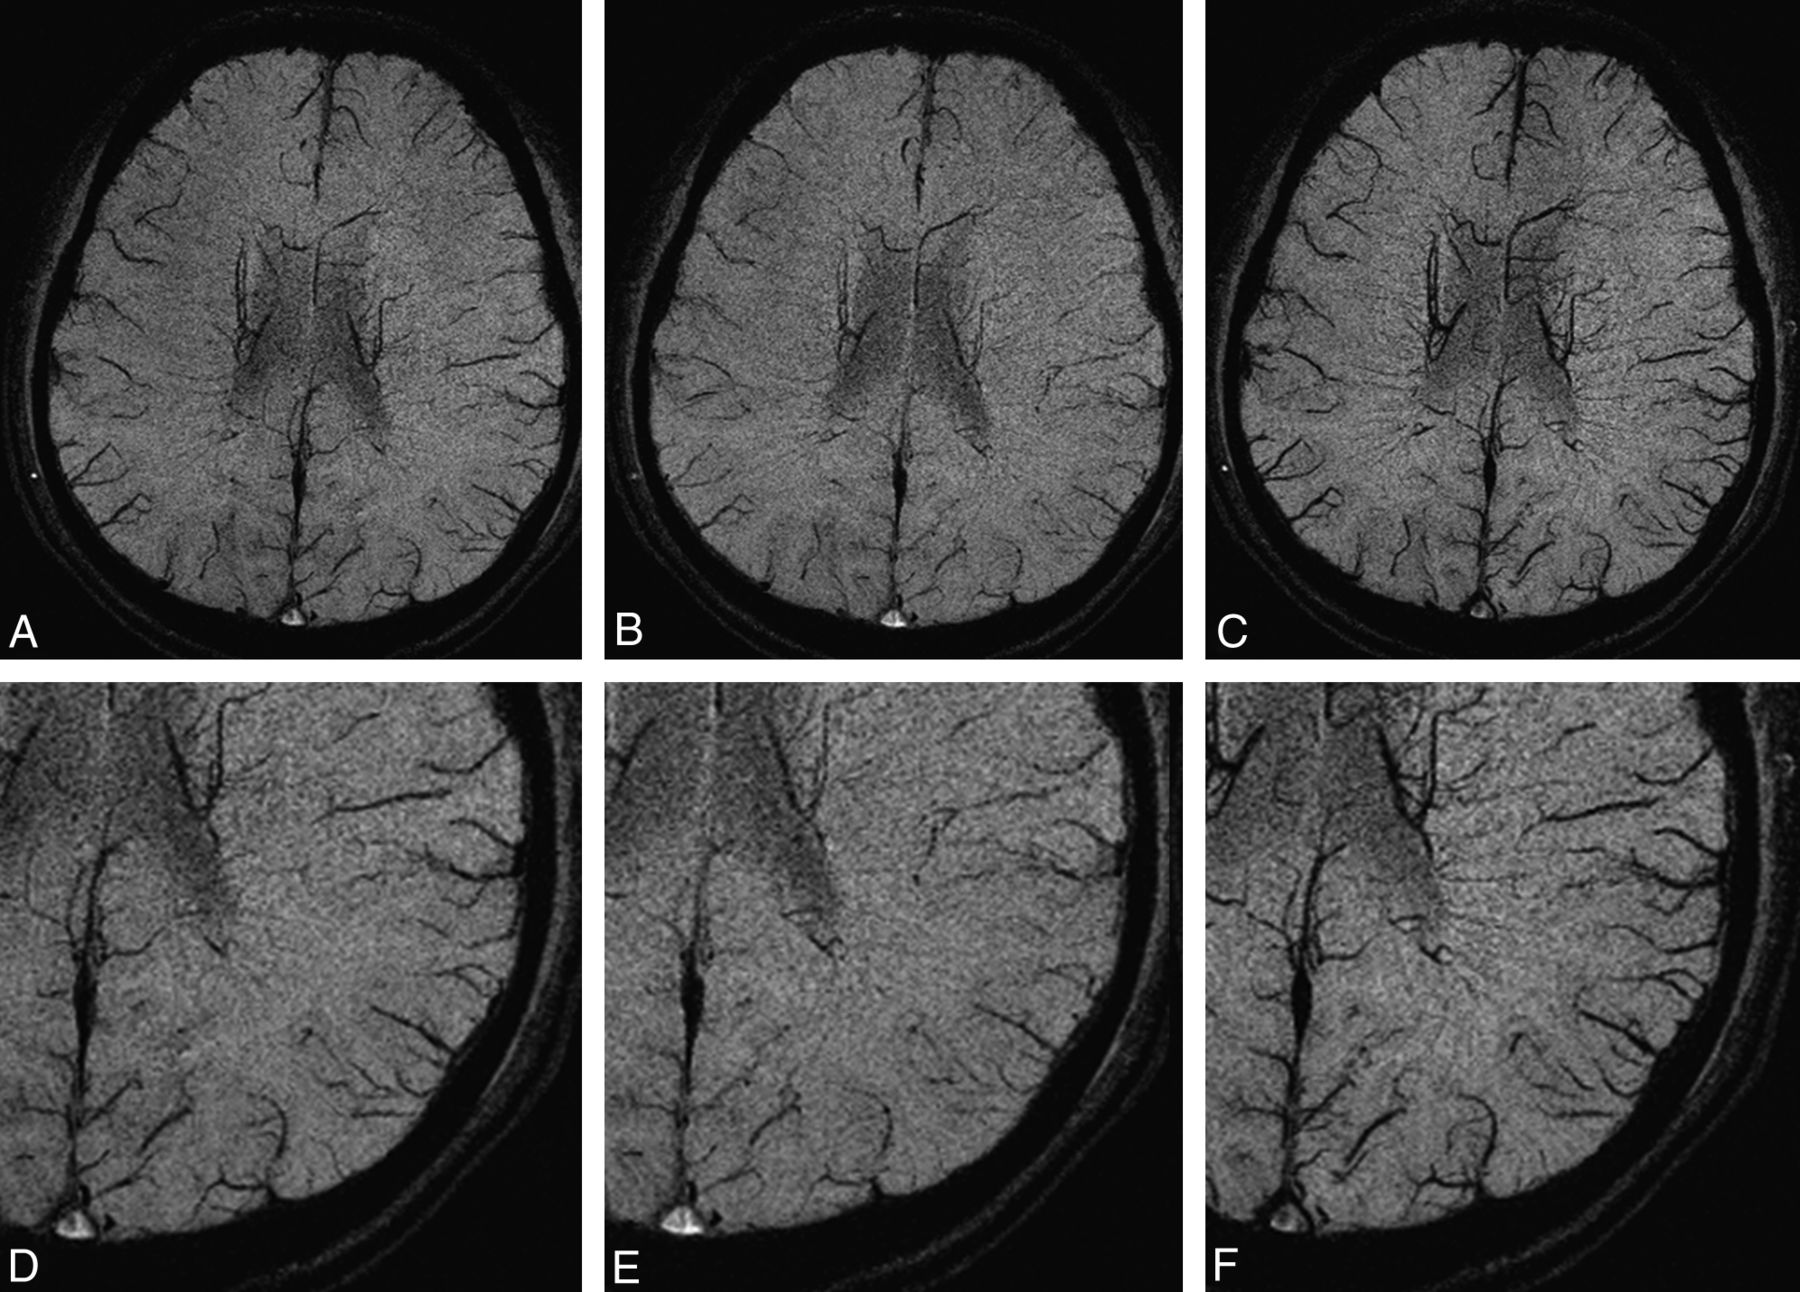
Changes in oxygenation level as indicated by venous blood signal change caused by alteration in the concentration of deoxyhemoglobin in the veins was clearly seen on SWI in all volunteers. Figure 1 shows the SWI MIP venogram for a typical subject at baseline and during apnea and hyperventilation respiratory challenges. Compared with the baseline scan with normal breathing, the venous architecture is slightly attenuated during breath-holding and is amplified during hyperventilation. Figure 2 shows the total venous voxel number for all 10 subjects during baseline, apnea, and hyperventilation. Although there were variations in SWI venous voxels from subject to subject, the behavior of these signal changes in response to apnea and hyperventilation were consistent across all 10 subjects.

Axial SWI MIP venogram at baseline (A), breath-holding (B), and hyperventilation (C) in a healthy subject. D–F, Magnified portions of the SWI venogram at baseline, breath-holding, and hyperventilation, respectively. The signal intensity changes in the venous architecture are caused by oxygenation level alterations during the respiratory challenges. There is a slight increase in signal intensity within venous structures during breath-holding (B) and marked signal decrease during hyperventilation (C) as a result of different responses of vascular tone to changes of blood CO2, which is a vasoactive modulator.

Number of venous blood voxels for each of the 10 subjects at baseline, breath-hold, and hyperventilation. There is a decrease in venous blood voxel number during breath-holding and an increase in venous voxel number during hyperventilation, and such changes are consistent across subjects.
The paired t test showed significant decrease of venous voxel numbers during breath-hold (P < .0001) and significant increase during hyperventilation (P < .0001) compared with baseline. The mean and standard deviation (SD) of venous voxel numbers were 24,427 ± 936, 24,032 ± 962, and 25,081 ± 959 at baseline, apnea, and hyperventilation SWI, respectively. Relative to baseline, there was a significant percent change in venous blood voxel number during breath-holding (mean/SD: −1.6 ± 0.46%) and a significant increase during hyperventilation (mean/SD: 2.7 ± 0.41%).
DISCUSSION
Although many in vivo human studies have demonstrated MR imaging signal changes with vascular stimuli (eg, hypercapnia, carbogen, or caffeine) on the basis of gradient-echo or blood oxygen level–dependent type techniques, few studies have investigated changes in venous conspicuity on SWI venograms when there is an alteration of respiratory pattern. Our data indicate that venous blood oxygenation level is higher during voluntary breath-holding and lower during hyperventilation. As a result, venous vasculature visibility on SWI venograms is enhanced for hyperventilation and diminished for apnea. Therefore, SWI may afford a noninvasive and relatively simple and quick method to assess underlying blood flow changes or oxygen metabolic pathophysiology in various disease states.
Hyperventilation is a physiologic mechanism by which CO2 is expelled from the body in response to acidotic states secondary to the pathologic conditions. Voluntary hyperventilation will also cause the same decrease in blood CO2,26 which leads to vasoconstriction and a corresponding decrease in CBF. The mechanism by which this vasoconstriction occurs is mediated by the local increase in blood pH or reduction in [H+].27,28 Because cerebral oxygen consumption remains unchanged in healthy persons,29 the reduction in CBF means less overall oxygen delivery, and this will eventually result in a more deoxygenated venous blood. The local susceptibility effects of deoxyhemoglobin lead to a decrease in MR signal intensity, which translates to the observed increase in venous visibility on the SWI venogram. These results are consistent with the enhanced venous contrast on the SWI caused by hyperventilation, as reported by Fushimi et al,16 as well as the decrease in MR signal intensity on SWI due to caffeine ingestion, as reported by Sedlacik et al.6 Opposite to hyperventilation, breath-holding leads to the accumulation of blood CO2 and a resultant cerebrovascular smooth muscle relaxation. This vasodilation decreases the resistance to blood flow, allowing for an increase in CBF and thus oxygen delivery to the brain. More oxygenated venous blood with decreased deoxyhemoglobin concentration will cause an increase in signal intensity. This translates to a decrease in venous vasculature visibility on the SWI venogram and a decrease in venous voxel number. These results are consistent with the decrease in venous contrast on SWI caused by carbogen breathing, as reported in Rauscher et al.19 Whereas venous deoxyhemoglobin concentration plays an important role in modulating SWI signal, the venous vasculature visibility can also be influenced by its caliber size changes. However, unlike arterial vasculature, venous vasculature has thin walls, lacks vasomotor smooth muscle, and is insensitive to vasoactive stimuli. Therefore, the observed SWI venous conspicuity changes during respiratory stress in this study are probably caused by PaCO2 alteration and subsequent oxygenation changes, which outweigh venous caliber changes (if any).
The SWI venous voxel change during apnea (1.6%) was observed to be smaller than that during hyperventilation (2.7%). This difference, which can be partly attributed to the greater uniformity among subjects in the ability to hyperventilate (with task performed lasting 90 seconds) compared with breath-hold (with task performed around 30∼45 seconds). The baseline SWI venous voxel numbers were also observed to be variable from subject to subject, as shown in Fig 2. These variations probably are representative of the normal anatomic variation in venous structures, which have been documented to be less conserved than their corresponding arterial structures. In addition, this intersubject variation in SWI venous voxel numbers can also be explained by the slight differences in brain coverage during the SWI scan. Some of the variance seen may also be caused by changing partial volume effects from scan to scan and variability in the small vasculature from person to person. Although anatomic landmarks were used to maintain consistency in brain coverage across subjects, slight inconsistencies were still possible. Nevertheless, the observed intersubject variations do not affect the results of our study because comparisons of SWI venous vasculature between baseline, apnea, and hyperventilation were performed within each individual subject and not across subjects.
There are several limitations of note. First, perfusion imaging (ie, arterial spin-labeling) was not performed because of the potential for increased subject distress during the prolonged respiratory challenges or longer scan times required for perfusion imaging. Measurement of CBF would have provided direct validation that the observed changes in SWI venous contrast resulted from alterations to CBF in response to the respiratory challenges. In addition, we do not have PaCO2 measurements in this study. Measurement of end-tidal CO2, a representation of PaCO2, would have confirmed that the respiratory challenges of apnea and hyperventilation were actually inducing changes in blood CO2 levels. Second, because of the limitations placed on acquisition times, whole-brain imaging with SWI was not performed. Whole-brain imaging, however, was not necessary because the aim of the study was to simply evaluate the sensitivity of SWI to respiratory challenges. The region of the central brain that was scanned included both small white matter medullary veins and large peripheral cortical veins and was therefore sufficient for our purposes in observing changes in CBF and venous oxygenation. Last, the resolution of the SWI venogram was also limited by the shortened acquisition time. Although this was not a problem for this current study, future resolution limitations can be resolved with ultra-high field MR imaging (eg, 7T), and enhanced venous visibility would be possible as the result of the stronger susceptibility effect at higher magnetic fields. Recent advances in the use of phase to create quantitative susceptibility maps may make this type of evaluation even easier because this technique will provide positive contrast and possibly a direct measure of changes in oxygen saturation.30,31
CONCLUSIONS
Our study shows that changes in venous blood oxygenation in response to simple respiratory challenges can be imaged by SWI on 3T. Because of its noninvasiveness and sensitivity, SWI probably will play a role in the assessment of the cerebral vasomotor response for various cerebrovascular and neurodegenerative diseases such as stroke, multiple sclerosis, and Alzheimer disease.
ACKNOWLEDGMENTS
The authors thank Jens H. Jensen and Leon Axel for the helpful discussion of the experiment design.
Footnotes
Disclosures: Samuel Barnes—RELATED: Grant: NIH,* Comments: Grant number 2R0 HL062983-04A2. Mark Haacke—UNRELATED: Patents (planned, pending or issued): MR Innovations, Comments: I have several patents, held by MR Innovations, related to SWI; Royalties: MR Innovations, Comments: I receive royalties from the aforementioned patents. Robert Grossman—RELATED: Grant: NIH,* Comments: R01 grant number NS29029. Yulin Ge–RELATED: Grant: NIH,* Comments: R01 grant numbers NS29029-20S and NS076588 (*money paid to institution).
This work was supported by the National Institutes of Health (NIH) R01 grants NS29029, NS29029-20S and NS076588 and by National Multiple Sclerosis Society (NMSS) research grant RG4707A1.
Indicates open access to non-subscribers at www.ajnr.org
References
- Received August 7, 2013.
- Accepted after revision October 16, 2013.
- © 2014 by American Journal of Neuroradiology


Jump to section
Related Articles
Cited By...
- No citing articles found.