
Abstract
BACKGROUND AND PURPOSE: There is a well-established correlation between deep gray matter atrophy and cognitive dysfunction in MS. However, the cause of these signs of neurodegeneration is poorly understood. Iron accumulation in the deep gray matter is higher in patients with MS compared with age- and sex-matched healthy controls, and could contribute to disease progression. Our objective was to evaluate the relationship between iron and cognition in several deep gray matter structures while accounting for the influence of volume loss.
MATERIALS AND METHODS: Eighty-five patients with MS and 27 healthy volunteers underwent 3T MR imaging and neuropsychological examination. We used SWI filtered phase to analyze the mean phase of low-phase voxels, indicative of abnormal iron accumulation.
RESULTS: Correlations between mean phase of low-phase voxels and cognitive tests were found in the caudate nucleus (r = 0.240 and 0.232), putamen (r = 0.368, 0.252, and 0.238), globus pallidus (r = 0.235), and pulvinar nucleus of thalamus (r = 0.244, 0.255, and 0.251) (P < .05). However, correlations between structure volume and cognition were more robust. Furthermore, the introduction of structure volume into hierarchical regression analyses after iron metrics significantly improved most models, and mean phase of low-phase voxels did not account for significant variance after volume.
CONCLUSIONS: These findings suggest that iron accumulation plays a significant, if minor, role in MS cognitive decline.
ABBREVIATIONS:
- BVMT-R
- the total learning portion of the Brief Visuospatial Memory Test-Revised
- CVLT2
- total learning portion of the California Verbal Learning Test
- DGM
- deep gray matter
- DKEFS-CS
- Delis-Kaplan Executive Function System Sorting Test
- LPV
- low-phase voxel
- MP-LPV
- mean phase of the low-phase voxels
- NP
- neuropsychological
- PASAT
- 3-second Paced Auditory Serial Addition Test
- SDMT
- Symbol Digit Modalities Test
Investigation of iron accumulation in the central nervous system is an emerging area of research. Iron is elevated in MS at the areas of demyelination1 and in the CSF,2 and could potentially contribute to the understanding of progressive neurodegenerative disease. Iron deposition may adversely impact cellular function, such as enhancing or decreasing production of proteins, or it can cause oxidative stress leading to cell death, directly causing structural damage in the brain.3
SWI is an available method that estimates the degree of iron deposition, in vivo, using MR imaging.4 In a study examining the deep gray matter (DGM) of patients with MS, low-phase voxel (LPV) analysis reflected increased iron accumulation in the caudate nucleus, putamen, globus pallidus, and pulvinar.5 Even in clinically isolated syndrome, this representation of increased iron accumulation was found in the putamen and pulvinar.6 In a pediatric MS cohort, analysis of LPV reflected increased iron accumulation in both the thalamus and pulvinar while the volume of the LPV was increased in the pulvinar.7 LPV volume was also increased in clinically isolated syndrome in the caudate nucleus, putamen, and pulvinar,6 and magnetic susceptibility (also indicative of iron level) was increased in the caudate nucleus, putamen, globus pallidus, and pulvinar.8
Contemporary research shows that brain atrophy is predictive of cognitive disability in MS, more so than lesion burden.9,10 GM atrophy is the subject of intense research because of its correlation with disease progression, neurologic disability,11 cognitive impairment, and neuropsychiatric symptoms.12 Regional analysis of the DGM in MS revealed that volume is reduced in the thalamus, caudate nucleus, putamen, and globus pallidus.13,14 Likewise, lower thalamus volume is found in clinically isolated syndrome,15 and both whole thalamus and pulvinar volume are decreased in patients with pediatric onset.16 DGM volumes are strongly correlated with fatigue17 and performance on cognitive tests.13,14 Total DGM volume was the strongest predictor of Expanded Disability Status Scale scores in a study utilizing various MR imaging metrics; LPV analysis, reflecting iron accumulation in the DGM, further increased the percentage of variance in the regression model.18
In sum, the literature shows that DGM atrophy is strongly associated with cognitive dysfunction in MS.13 However, the role of iron deposition, as observed with SWI-filtered phase, in explaining cognitive dysfunction is less clear, and potentially interactive effects of iron and volume have not been explored. Here we present findings from an initial investigation of the relationship of iron deposition and cognitive ability in patients with MS.
Materials and Methods
Participants
We studied 85 patients with clinically definite MS19 and 27 healthy, demographically matched controls (Table 1) with approval from the Institutional Review Board. These subjects were a subset from a previously published cohort, and informed consent was obtained.12,13 Patients were excluded from the study if they had previous or current substance abuse, current or past major medical, neurologic, or psychiatric disorder outside of MS, or if they had a relapse or steroid pulse treatment within 8 weeks before evaluation. Patients with depressive disorders that emerged after MS onset were permitted, but those meeting criteria for current major depressive episode were excluded. Participants were free of developmental delay and any medical history that could potentially impact cognitive ability. Of the patients with MS, 57 (67.1%) were in relapsing-remitting, and 28 (32.9%) were in secondary-progressive disease course. Sixty-eight (80.0%) patients with MS were on disease-modifying therapy at the time of the study. Therapy included intramuscular interferon beta-1a, 44 mcg subcutaneous interferon beta-1a, natalizumab, glatiramer acetate, mycophenolate mofetil, intravenous immunoglobulin, interferon beta-1b, mitoxantrone, and the following combinations: intramuscular interferon beta-1a + mycophenolate mofetil, 22 mcg + 44 mcg subcutaneous interferon beta-1a, and glatiramer acetate + mycophenolate mofetil.
Demographic characteristics, neuropsychological test scores, and mean phase of the low-phase voxels across subcortical deep gray matter structures
MR Imaging Acquisition and Analysis
Participants were examined on a 3T Signa Excite HD 12.0 Twin Speed 8-channel scanner (GE Healthcare, Milwaukee, Wisconsin) with a maximum slew rate of 150 T/m/s and maximum gradient amplitude in each orthogonal plane of 50 mT/m. A multichannel head and neck coil (GE Healthcare) was used to acquire: 2D multiplanar dual FSE proton density and T2WI; FLAIR; 3D high-resolution T1WI using a fast-spoiled gradient echo with magnetization-prepared inversion recovery pulse and spin-echo T1WI; and SWI. Scans were acquired in an axial-oblique orientation, parallel to the subcallosal line. One average was used for all pulse sequences. With the exception of SWI, all sequences were acquired with a 256 × 192 matrix (frequency × phase), FOV of 25.6 cm × 19.2 cm (256 × 256 matrix with phase FOV = 0.75), for an in-plane resolution of 1 mm × 1 mm. For all 2D scans (proton density/T2, FLAIR, spin-echo T1), we collected 48 contiguous, 3-mm-thick sections. For the 3D high-resolution inversion recovery–fast-spoiled gradient echo, we acquired 180 1-mm-thick locations. Other relevant parameters were: for dual FSE proton density/T2, TE1/TE2/TR = 9 /98/5300 ms, echo-train length = 14; for FLAIR, TE/TI/TR = 120/2, 100/8, 8500 ms, echo-train length = 24; spin-echo T1WI, TE/TR = 16/600 ms; for 3D high-resolution T1WI, TE/TI/TR = 2.8/900/5.9 ms, flip angle = 10°. SWI was acquired using a 3D flow-compensated gradient-echo sequence with 64 contiguous, 2-mm-thick sections, a 512 × 192 matrix, FOV = 25.6 cm × 19.2 cm (512 × 256 matrix with phase FOV 0.75), for an in-plane resolution of 0.5 mm × 1 mm, flip angle = 12°, and TE/TR = 22/40 ms.
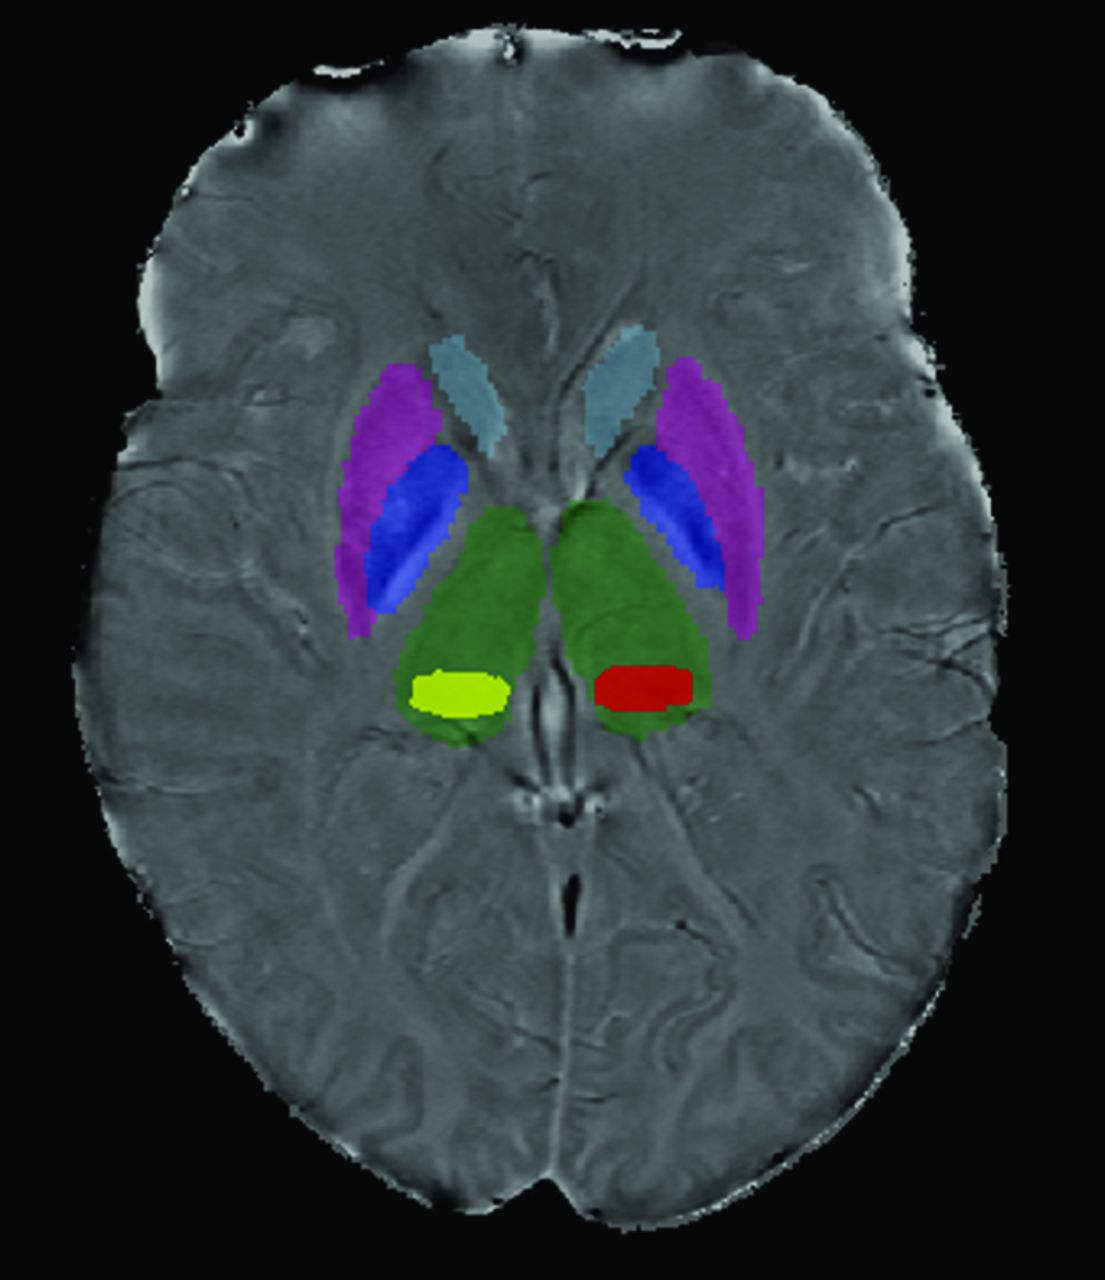
T2 and T1 lesion volume was measured using a semiautomated edge detection contouring technique as previously described.20 To segment the thalamus, caudate nucleus, putamen, and globus pallidus, FMRIB's Integrated Registration and Segmentation Tool21 (http://www.fmrib.ox.ac.uk/) was applied to the 3D high-resolution T1WI (Fig 1). As the pulvinar was not identified in this manner, the most representative section was outlined for each patient using a semiautomated contouring technique (Fig 1).22 The SWI-filtered phase image processing method and reproducibility were discussed in a previous study involving reliable scan-rescan analysis in a subset of 6 patients with MS and 6 healthy volunteers.5 Voxels having a mean phase value 2 SDs below normal mean phase were identified on a structure-by-structure basis, as previously described, with normal mean phase identified from 330 healthy volunteers aged 8–87 years.20 The thresholded phase voxels, which were identified as abnormally low, were analyzed to calculate their mean phase, yielding mean phase of the low-phase voxels (MP-LPV).22

Scan demonstrating deep gray matter structure segmentation. FMRIB's Integrated Registration and Segmentation Tool was applied to the 3D high-resolution T1WI to segment the DGM. Pulvinar (yellow and red) was segmented using a semiautomated contouring technique.
Neuropsychological Testing
Neuropsychological testing (NP) was conducted under the supervision of a board-certified neuropsychologist blinded to MR imaging findings. Tests measured processing speed, executive function, and memory in accordance with the recommendations of a consensus panel,23 and were as follows: oral administration of the Symbol Digit Modalities Test (SDMT)24 for visual information-processing speed; 3.0-second interval Paced Auditory Serial Addition Test (PASAT)25 for auditory information-processing speed; the Correct Sorts component of the Delis-Kaplan Executive Function System Sorting Test (DKEFS-CS)26 for executive function; the Total Learning portion of the second edition of the California Verbal Learning Test (CVLT2)27 for auditory/verbal learning and memory; and the Total Learning portion of the Brief Visuospatial Memory Test-Revised (BVMT-R)28 for visual learning and memory.
Statistical Analysis
Patients with MS and healthy controls as well as cognitively impaired and nonimpaired patients with MS were compared with respect to demographic characteristics and MR imaging findings using 1-way ANOVA. Z scores were calculated for each NP test based on healthy controls.29 Impairment was defined as either: a z score < −2 on 1 test with a z score of < −1.5 on at least 1 other test; a z score of < −1.5 on at least 3 tests, as previously defined.30 In patients with MS, age and years of education were correlated with some NP test scores (SDMT, PASAT, DKEFS-CS, CVLT2); therefore, NP tests were compared between patients with MS and healthy controls using 1-way ANCOVA controlling for age and years of education. Partial correlations controlling for age and years of education assessed the association between NP tests and individual DGM structure volumes, disease duration, and duration of disease-modifying therapy. Pearson correlations were examined between MP-LPV and structure volume and LPV volume. Partial correlations controlling for LPV volume, age, and years of education were examined between NP tests and MP-LPV for individual structures of the DGM. Structures that had the strongest relationship of MP-LPV to NP test performance were included in hierarchical linear regression analyses controlling for age and years of education (in Block 1), followed by LPV volume of the structure in Block 2, MP-LPV of the structure in Block 3, and total tissue volume of the structure in Block 4. In this manner, we assessed the association between iron deposition and cognition, and then reassessed the association while controlling for the effects of atrophy. Tests were considered significant at P < .05. Analyses were conducted using SPSS for Windows, version 20.0 (IBM, Armonk, New York).
Results
As expected, patients with MS were significantly more cognitively impaired and performed significantly worse on cognitive tests compared with healthy controls (Table 1). MP-LPV was significantly lower in patients with MS in the thalamus, caudate nucleus, and pulvinar, whereas a statistical trend was found for the putamen (P = .085) and globus pallidus (P = .051) (Table 1). Age, education, and MP-LPV did not significantly differ between cognitively impaired patients with MS and nonimpaired patients with MS, but duration of disease did (P = .009). Except for the globus pallidus with CVLT2, all individual structure volumes were significantly correlated to NP test scores (Table 2). Duration of disease and duration of disease-modifying therapy were not related to NP test scores, and were not further investigated.
Partial correlation of structure volume and mean phase of the low-phase voxels to neuropsychological tests in patients with multiple sclerosis
Next, we assessed whether MP-LPV was linearly related to cognitive performance in patients with MS. To account for the possibility that tissue atrophy results in tissue loss specifically in regions of low-phase value, thereby potentially altering distribution of iron accumulation, we chose to control for the LPV volume. Controlling for LPV volume, MP-LPV of the caudate nucleus, putamen, globus pallidus, and pulvinar, but not the thalamus, correlated with multiple NP test results (Table 2).
MP-LPV was positively correlated with total volume in the same structure in the caudate and pulvinar, and there was a trend with the putamen (P = .075), indicating that as iron accumulation increases, the structure decreases in size. MP-LPV was negatively correlated with LPV volume in the same structure in the putamen, globus pallidus, and pulvinar, indicating that as iron accumulation increases, the voxels that contain abnormally high iron accumulation decrease in collective volume in those structures (Table 3).
Mean phase of the low-phase voxels correlated with structure volume and with low-phase voxel volume
Finally, we investigated whether iron-sensitive metrics would have a significant bearing on cognitive function relative to age, education, and volumes of the DGM structures showing a significant correlation between MP-LPV and cognition. The R2 and P values of each regression model are reported in Table 4. With the exception of the caudate nucleus for the PASAT, MP-LPV (controlling for LPV volume) added significant variance in the regression models predicting performance score. However, volume of the structure improved all of the models, except for DKEFS-CS and BVMT-R, as predicted by MP-LPV of the pulvinar. Moreover, when a second series of regression models was conducted with structure volume entered ahead of the iron metrics, MP-LPV was not statistically significant. Furthermore, when a third series of regression models was conducted with T2 lesion volume entered along with age and education, none of the other MR imaging measures remained statistically significant.
Summary of hierarchical linear regressions predicting neuropsychological test scores
Discussion
This study demonstrated a correlation between iron accumulation, as measured by SWI-filtered phase, and cognition in MS. We found that MP-LPV is decreased among patients with MS in the thalamus, caudate nucleus, and pulvinar, and there is a decreasing trend, indicative of higher iron content, in the putamen and globus pallidus. In addition, MP-LPV of the pulvinar, caudate nucleus, putamen, and globus pallidus, but not the thalamus as a whole, is related to cognitive performance. Whereas the correlation between MP-LPV and cognition is statistically significant, the effect size is modest and smaller than the volume/cognition correlation in the DGM. In regression models predicting NP tests, total structural volume significantly increased the R2 after MP-LPV, whereas entering structure volume first in the models erased the clinical significance of MP-LPV. We therefore conclude that the association between iron accumulation and cognitive impairment is significant, but considerably smaller than with DGM atrophy or T2 lesion volume.
Previous studies examining cognition in MS have used other methods of investigating iron. An increase in R2* rate, indicative of iron, in the basal ganglia, but not the thalamus, of patients with MS correlated with a combined standardized score of the SDMT and PASAT.31 T2 hypointensity, indicative of iron, in the globus pallidus and caudate nucleus of patients with MS correlated with performance on the SDMT.32 Similar to our findings, these studies showed correlations between iron and cognition in the DGM; however their correlations were stronger, with r values in the 0.3–0.6 range. The effects of R2*, however, may be hidden by local increases in water content,33 and T2 relaxation times are more variable in older subjects,34 making SWI a preferable measure of iron. Magnetic field correlation, another MR imaging method unaffected by dipolar relaxation which is used for iron imaging, found that iron in the thalamus correlated with CVLT2, and that neither the globus pallidus nor the putamen were correlated to SDMT or CVLT2,35 which contrasts with our findings. Sensitivity to magnetic field inhomogeneities with differing length scales may help explain why these methods yield disparate results.36
While the observation of MR imaging phase value as an interpretation of iron concentration is increasingly common, it does not differentiate between iron that is shielded or unshielded, intracellular or extracellular. If iron accumulation is not properly shielded, oxidative stress could lead to necrosis of the cells within its immediate vicinity.3 As suggested by Kovtunovych et al,37 with macrophages releasing iron into both spleen tissue and circulation, focal iron deposits in the DGM could disperse within the focal area and out into surrounding tissue upon cell death. By definition, MP-LPV is a measurement in the voxels of the highest iron concentration; its value may be attenuated if iron dissipates as a structure atrophies, thereby masking its association with cognitive performance. We controlled for this confound by making use of the LPV volume as a covariate in our analysis.
With the exception of the thalamus, most of the DGM structures examined had MP-LPV values that positively correlated with structure volume and negatively correlated with LPV volume. We would expect MP-LPV to be positively correlated with structure volume if focal deposits of iron accumulation were connected to atrophy. MP-LPV in the globus pallidus, however, negatively correlated with structure volume, which could indicate a curiously different role for iron in that structure. Meanwhile, MP-LPV was conspicuously higher in the thalamus compared with other structures examined, possibly reflective of different functions of the thalamus. The caudate and putamen together make the striatum of the basal ganglia, a region receiving signals from the sensorimotor, premotor, motor, and prefrontal cortices involving voluntary movement.38 Meanwhile, the pulvinar receives signals from the visual cortex involving visual attention.39 Several of the NP tests used manual movement (DKEFS-CS, BVMT-R) and visual perception (SDMT, DKEFS-CS, BVMT-R), likely taxing these structures.
This study is limited by the cross-sectional design, which makes it difficult to characterize the effects of iron in disease course and whether it impacts or is impacted by atrophy. A longitudinal study should help elucidate the temporal and spatial relationships between high iron concentration and tissue atrophy. It also is important to note that the pulvinar structure was analyzed using a single-section method and semiautomated contouring technique, which potentially introduces more variance than analysis using FMRIB's Integrated Registration and Segmentation Tool.
Conclusions
High iron deposition, as measured by mean phase of the low-phase voxels, in pulvinar, putamen, caudate nucleus, and globus pallidus is correlated with cognitive performance in patients with MS. However, the contribution of structure volume is more robust. Longitudinal investigation is underway that may tease apart the temporal evolution of iron deposition and atrophy in MS.
Footnotes
Disclosures: Robert Zivadinov–UNRELATED: receives personal compensation from Teva Pharmaceuticals, Biogen Idec, EMD Serono, Novartis, Claret, and Sanofi-Genzyme for speaking and consultant fees, and receives financial support for research activities from Biogen Idec, Teva Pharmaceuticals, EMD Serono, Novartis, and Sanofi-Genzyme. Michael Dwyer–UNRELATED: received consulting fees from EMD Serono for scientific advisory board activities, and from Claret Medical for image analysis consulting. Ralph H.B. Benedict–UNRELATED: receives research support from Accorda, Novartis, Genzyme, Biogen Idec, and Questcor Pharmaceuticals, is on the speakers' bureau for EMD Serono (designing CME courses), and consults for Biogen Idec, Genentech, and Novartis. Dr. Benedict also receives royalties for Psychological Assessment Resources.
This study was supported in part by National MS Society grant #RG4060A3/1 awarded to R.H.B. Benedict.
References
- Received November 18, 2013.
- Accepted after revision April 7, 2014.
- © 2015 by American Journal of Neuroradiology


Jump to section
Related Articles
Cited By...
- Gray Matter alterations in MS and CIS: a Coordinate based Meta-analysis and regression
- Quantitative Susceptibility Mapping of the Thalamus: Relationships with Thalamic Volume, Total Gray Matter Volume, and T2 Lesion Burden
- Thalamic Iron Differentiates Primary-Progressive and Relapsing-Remitting Multiple Sclerosis
- Cognitive Implications of Deep Gray Matter Iron in Multiple Sclerosis