
Abstract
BACKGROUND AND PURPOSE: White matter abnormalities have been demonstrated to play an important role in minimal hepatic encephalopathy. In this study, we aimed to evaluate whether WM diffusion tensor imaging can be used to identify minimal hepatic encephalopathy among patients with cirrhosis.
MATERIALS AND METHODS: Our study included 65 patients with cirrhosis with covert hepatic encephalopathy (29 with minimal hepatic encephalopathy and 36 without hepatic encephalopathy). Participants underwent DTI, from which we generated mean diffusivity and fractional anisotropy maps. We used a Bayesian machine-learning technique, called Graphical-Model-based Multivariate Analysis, to determine WM regions that characterize group differences. To further test the clinical significance of these potential biomarkers, we performed Cox regression analysis to assess the potential of these WM regions in predicting survival.
RESULTS: In mean diffusivity or fractional anisotropy maps, 2 spatially distributed WM regions (predominantly located in the bilateral frontal lobes, corpus callosum, and parietal lobes) were consistently identified as differentiating minimal hepatic encephalopathy from no hepatic encephalopathy and yielded 75.4%–81.5% and 83.1%–92.3% classification accuracy, respectively. We were able to follow 55 of 65 patients (median = 18 months), and 15 of these patients eventually died of liver-related causes. Survival analysis indicated that mean diffusivity and fractional anisotropy values in WM regions were predictive of survival, in addition to the Child-Pugh score.
CONCLUSIONS: Our findings indicate that WM DTI can provide useful biomarkers differentiating minimal hepatic encephalopathy from no hepatic encephalopathy, which would be helpful for minimal hepatic encephalopathy detection and subsequent treatment.
ABBREVIATIONS:
- FA
- fractional anisotropy
- GAMMA
- Graphical-Model-based Multivariate Analysis
- HE
- hepatic encephalopathy
- HR
- hazard ratio
- MD
- mean diffusivity
- MHE
- minimal hepatic encephalopathy
- NHE
- no hepatic encephalopathy
Hepatic encephalopathy (HE) is a serious and frequent complication of cirrhosis,1 which can increase the risk of death.2 As the mildest form of HE, minimal hepatic encephalopathy (MHE) is defined by impaired performance on psychometric or neurophysiologic testing, despite normal mental status.1,3 MHE is associated with impaired quality of life4 and predicts conversion to overt HE,5 which can result in subsequent mortality.2 Meanwhile, MHE represents a treatable and reversible stage of HE6; it is, therefore, important to identify MHE to optimize treatment and prognosis.
Abnormalities in brain white matter, such as low-grade edema7⇓⇓⇓–11 and structural impairments,12⇓–14 have been well-revealed in MHE by MR imaging. These WM abnormalities are believed to be responsible for poor neurologic performances12,15,16 and brain dysfunctions17,18 in MHE and to be associated with HE development,9,11,16 suggesting that WM imaging may be useful in characterizing potential MHE biomarkers. Of WM imaging techniques, diffusion tensor imaging, measuring the appropriate metrics such as mean diffusivity (MD), reflecting water movement across cell membranes, and fractional anisotropy (FA), reflecting microstructural integrity of WM, is demonstrated to reveal the neuropathologic processes of MHE through group-level comparison.8,9,12,14,15,17 To date, however, there is no study using DTI-derived feature maps to discriminate patients with and without MHE in cirrhosis at the individual level; this discrimination remains an important question for clinicians.6,19 The only related study is the report of Sugimoto et al,16 which used a DWI-based metric (apparent diffusion coefficient) instead of DTI to classify patients with or without MHE, but in which patients in the intermediate state were excluded; this method obviously results in inadequate assessment. Few studies to date have been conducted to detect MHE by using FA as a biomarker.
In this study, our goal was to investigate whether DTI feature maps can distinguish patients with cirrhosis with MHE from those without (NHE) by using a Bayesian voxel-based machine-learning technique called Graphical-Model-based Morphometric Analysis (GAMMA; http://www.nitrc.org/projects/gamma_suite).20⇓–22 GAMMA is a nonparametric, multivariate, Bayesian approach to modeling structure-function associations, which allows dimension reduction and predictive modeling in a unified framework and has been validated both on structural and functional MR imaging data21,23 and has been used in several studies related to neurologic diseases.22,24 To further validate identified biomarkers, we assessed their abilities to predict survival among patients with cirrhosis with covert hepatic encephalopathy, given the relationship between MHE and mortality: The presence of MHE has been observed to have a prognostic impact on mortality among patients with liver cirrhosis.25,26
Materials and Methods
Subjects
This study was approved by the Research Ethics Committee of Affiliated Zhongda Hospital, Southeast University, China; 65 patients with clinically proved cirrhosis with covert HE (29 with MHE and 36 with NHE) were included after written informed consent was obtained (Table 1).
Demographic and clinical characteristics of subjects
For psychometric assessment, a battery of neuropsychiatric tests, including the Number Connection Test A, Digit Symbol Test, and Block Design Test, were administered to all participants. These 3 neuropsychiatric tests are widely used in MHE detection,1,3,16 development of new diagnostic methods for MHE,19,27 and survival analysis of patients with cirrhosis.16,28 Patients were identified as having MHE if they had abnormal scores in any of these 3 neurocognitive tests.19,27
Exclusion criteria were the presence of overt HE at baseline, known presence of neuropsychiatric diseases, significant nonhepatic diseases (such as decompensated heart and respiratory or renal failure), and uncontrolled endocrine or metabolic diseases (such as diabetes mellitus and thyroid dysfunction). Subjects on psychoactive medications or with alcohol abuse 6 months before the study were also excluded.
MR Imaging Acquisition
MR imaging was performed by using a 1.5T scanner (Vantage Atlas; Toshiba Medical Systems, Tokyo, Japan). DTI sequences were acquired by using a 6-direction, single-shot, spin-echo EPI sequence, with TR = 9450 ms, TE = 100 ms, FOV = 260 × 260 mm, matrix = 128 × 128, section thickness/gap = 3.0/0 mm, b=1000 s/mm2, and NEX = 3. The 3D high-resolution (1.0 × 1.0 × 1.5 mm) T1-weighted images were also acquired for the registration of DTI.
DTI Processing
We used the fMRI of the Brain Software Library (FSL; http://fsl.fmrib.ox.ac.uk/fsl) to process the DTI data. We corrected the DTI data for head movement and eddy current distortions with the non-diffusion-weighted imaging (the B0 image) as a reference. We fitted diffusion tensor models independently for each voxel and computed MD and FA maps. For the normalization of DTI, we first segmented the high-resolution T1-weighted images into gray matter, WM, and CSF by using the FMRIB Integrated Registration and Segmentation Tool (FIRST; http://fsl.fmrib.ox.ac.uk/fsl/fslwiki/FIRST) and spatially normalized these images to the Montreal Neurological Institute coordinate space. By concatenating the transformation from the B0 image to the T1 image with the transformation from the T1 image to the Montreal Neurological Institute space (by using a nonlinear transformation), we obtained normalized FA and MD maps.
GAMMA
GAMMA is a machine-learning method that detects biomarkers from high-dimensional neuroimaging data. GAMMA has 2 important features: First, it has an embedded dimension-reduction mechanism. For high-dimensional neuroimaging data, the large number of candidate models turns the model inference into an underdetermined computational problem. Dimension reduction can ameliorate this problem. Second, GAMMA can detect multivariate interactions among brain regions characterizing a disorder by considering conditional independence among variables. To date, few neuroimaging data analysis methods have these 2 features.
The goal of GAMMA is to detect a set of brain regions that are jointly predictive of a group-membership variable g. Toward this end, GAMMA iteratively performs Markov Blanket identification and voxel-space partitioning. In Markov Blanket identification, GAMMA uses Bayesian methods to search for a set of voxels (called representative voxels) that are jointly predictive of g. The interactions among representative voxels and g are described by a Bayesian network model. In voxel-space partitioning, for each representative voxel, GAMMA identifies voxels that are probabilistically equivalent to this representative voxel—that is, GAMMA searches for additional voxels that have similar associations with g. In this manner, each representative voxel is associated with a region of interest consisting of a representative voxel and its equivalent voxels. The output of GAMMA is a label field and a Bayesian network model. The label field includes a set of brain regions that are jointly most predictive of g, and each brain region in the label field is a ROI. The interactions among these brain regions and g are described by the Bayesian network model. Details of the GAMMA algorithm are presented in Chen and Herskovits.20
We calculated voxelwise mean and SD values for FA maps and compared each subject's FA map with the mean FA map. Decreased FA in WM has been consistently reported in patients with MHE12,14,15; therefore, we used a voxelwise threshold that is at multiple SDs below the mean value to threshold the FA map, resulting in a binary FA map, in which 1 represents an abnormal FA value and zero is normal. To reduce noise, we included only WM voxels with decreased FA value (determined by uncorrected P < .05 in a 2-sample t test).29 To ensure model stability, we compared 5 different thresholds: 0 SD, 0.25 SD, 0.50 SD, 0.75 SD, and 1.0 SD below the mean.
We performed similar preprocessing steps to generate binary MD maps. Because previous reports have consistently reported that patients with MHE have increased MD in WM,8,12,14⇓⇓–17 we set the voxelwise thresholds of the MD value at 0 SD, 0.25 SD, 0.50 SD, 0.75 SD, and 1.0 SD above the mean.
After identifying FA and MD regions of interest that characterize group differences, we used the regional state inference algorithm20 to infer the state (normal/abnormal) for a particular ROI. Then we built Naive-Bayes classifiers (10-fold cross-validation) to discriminate patients with MHE and NHE on the basis of these regional state variables. The structure of the Naive-Bayes classifier was [group membership → (biomarker 1, …, biomarker m)].
Validation of Detected Biomarkers
We performed 2 experiments to validate the biomarkers detected by GAMMA. For each subject, we extracted the average FA value for each ROI generated by GAMMA; let FA(ROIk)/MD(ROIk) denote the average FA/MD value for the kth ROI.
First, we used Pearson correlation analysis to examine the relationship between MD(ROIk) or FA(ROIk) and the neurologic test score and the Child-Pugh score. Second, we performed survival analysis by using the detected biomarkers. We defined the date of the first DTI examination as day 1, and each patient was followed up every 6 months. Fifty-five of 65 patients with cirrhosis completed follow-up studies until death or the end of the observation period (November 2012). We performed multivariate Cox regression (forward LR method) analysis to assess the associations of MD(ROIk) or FA(ROIk) with survival.
Results
Neurologic Assessments and Altered DTI Metrics
Patients with MHE showed significantly impaired performance in all neurocognitive tests, compared with those with NHE (Table 1). Relative to patients with NHE, those with MHE showed increased mean MD values throughout the WM globally [NHE: (0.805 ± 0.020) ×10−3 mm2/s; MHE: (0.821 ± 0.035) ×10−3 mm2/s; P = .025]. Patients with MHE also had reduced mean FA values throughout the WM (NHE: 0.344 ± 0.014; MHE: 0.331 ± 0.016; P < .001). The brain areas with increased MD values in MHE were the bilateral frontal lobes and the corpus callosum, and the areas with decreased FA values included the bilateral frontal, parietal, occipital, and temporal lobes; internal capsule; and corpus callosum (see the Appendix and On-line Figure). Moreover, in the MHE group, there was no area showing decreased MD or increased FA.
Additionally, we performed a post hoc power analysis based on FA. The observed effect size was 0.87, which was considered large by using Cohen criteria. Power analysis with α = .05 demonstrated that this study had power = 0.96.
Results of GAMMA Analysis
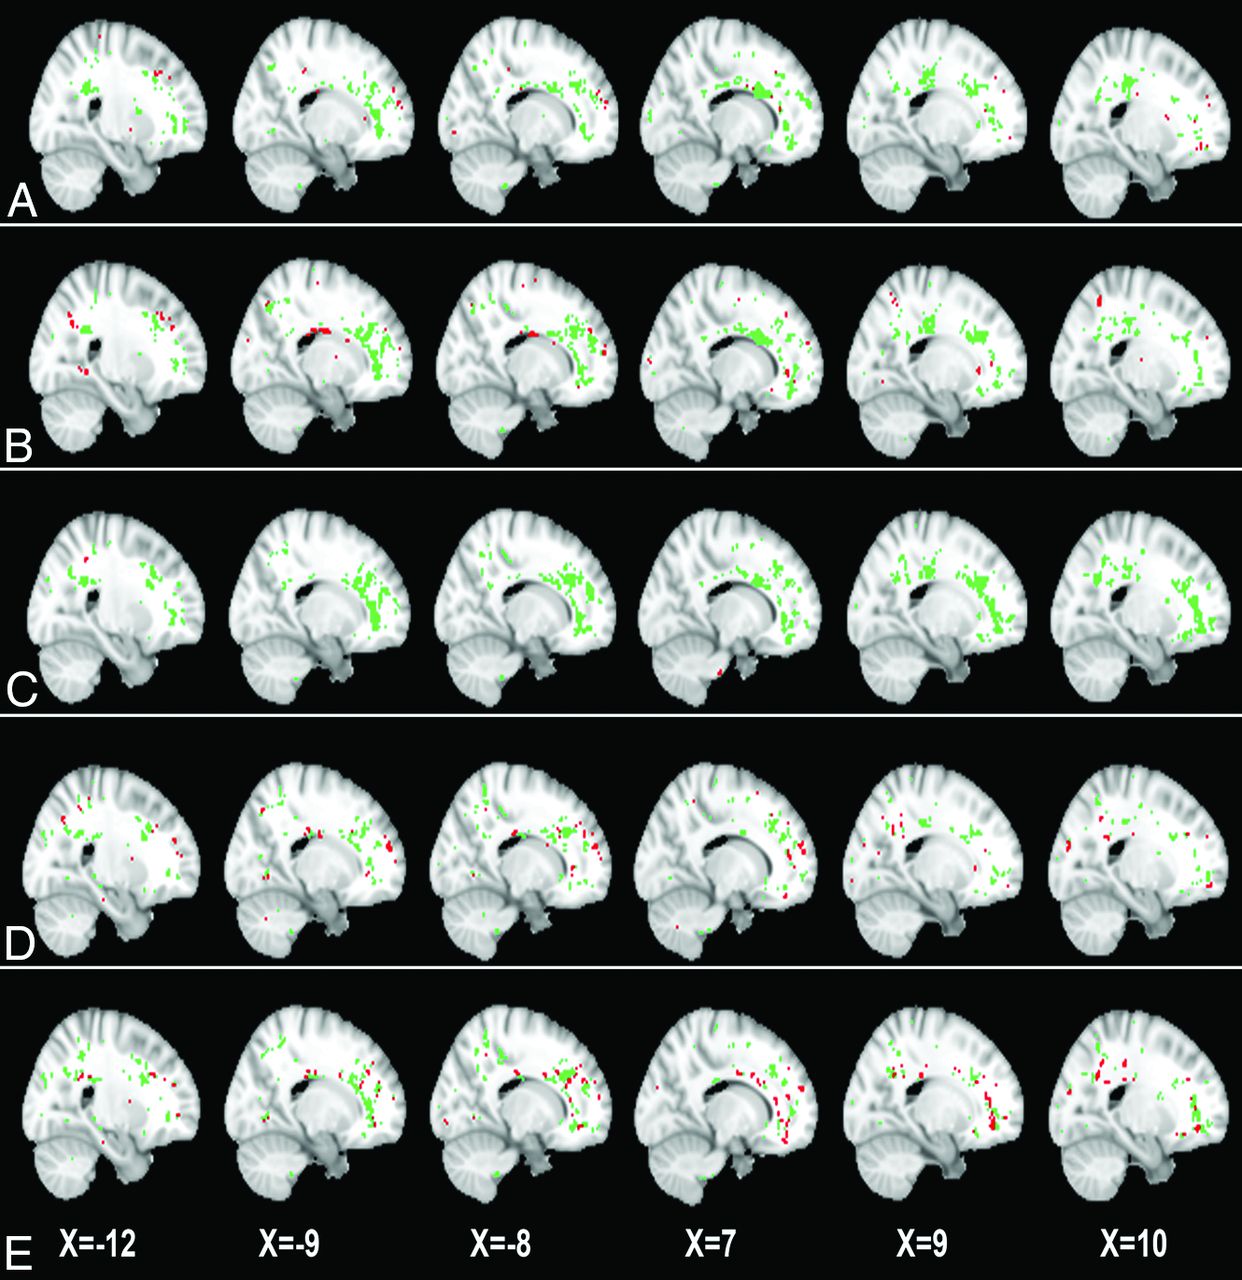
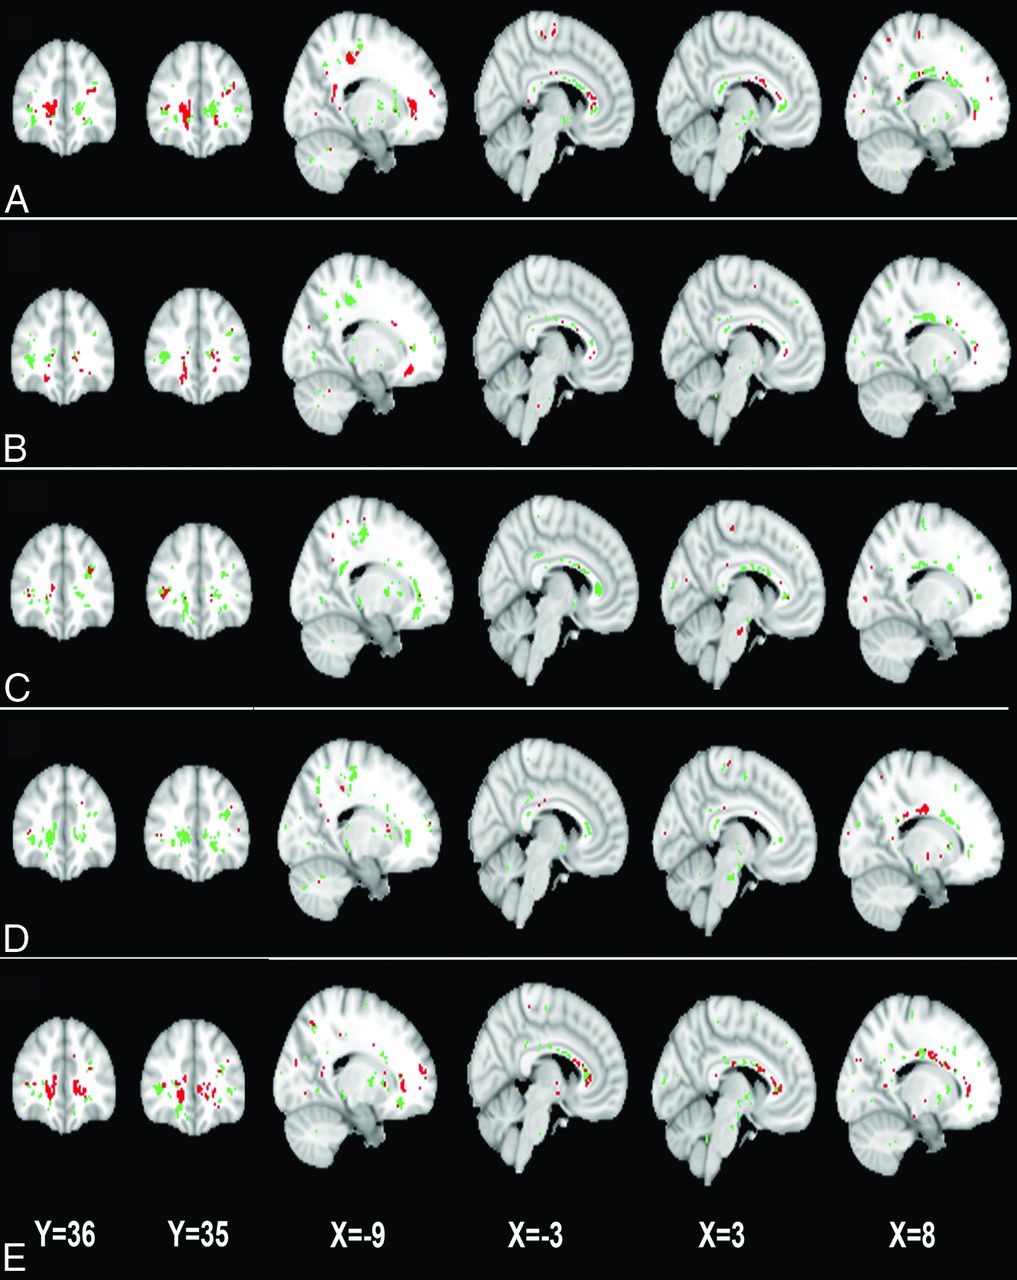
Across different abnormality thresholds for the MD and FA maps, GAMMA consistently identified 2 spatially distributed WM regions that were jointly significantly predictive of the group-membership variable (Figs 1 and 2). Two ROIs identified in MD maps, denoted by ROI1MD and ROI2MD, were predominant in the bilateral frontal lobes, precuneus, and the corpus callosum (Fig 1). Similarly, the 2 ROIs identified in FA maps, denoted by ROI1FA and ROI2FA, included bilateral frontal lobes, the corpus callosum, and the left paracentral lobule (Fig 2). Of note, the ROIs that GAMMA identified from MD and FA maps largely overlapped.

Two white matter ROIs generated by GAMMA, which characterize group differences on the MD map on the basis of voxelwise thresholds of the following: 0 SD (A), 0.25 SD (B), 0.50 SD (C), 0.75 SD (D), and 1.0 SD (E) above the mean voxelwise MD value. Green and red indicate the 2 ROIs generated by GAMMA.

The 2 white matter ROIs generated by GAMMA, which characterize group differences in the FA on the basis of voxelwise thresholds of the following: 0 SD (A), 0.25 SD (B), 0.50 SD (C), 0.75 SD (D), and 1.0 SD (E) below the mean voxelwise FA value. Green and red indicate the 2 ROIs.
Results of Classification Analysis
Table 2 shows classification performance based on these ROIs. Using MD maps, GAMMA achieved good classification accuracy (mean, 79.1%; range, 75.4%–81.5%) across 5 distinct thresholds. The optimal classification performance was accuracy = 80.0%, sensitivity = 75.9%, and specificity = 83.3%, with the threshold of 0.25 SD above the mean MD value. Using FA maps, GAMMA yielded higher classification accuracy (mean, 87.1%; range, 83.1%–92.3%) across the different thresholds. The optimal classification result was accuracy = 92.3%, sensitivity = 100%, and specificity = 86.1%, which was obtained at the threshold of 0.75 SD below the mean FA value. The thresholds resulting in best classification result (eg, a threshold of 0.25 SD above the mean MD value or a threshold of 0.75 SD below mean FA value) were chosen and included in the following validation analyses.
Classification accuracy between patients with MHE and NHE using a single Bayesian network
Results of Validation Analysis
Table 3 shows that MD values of WM ROIs [MD(ROI1) and MD(ROI2)] were significantly positively correlated with the result of the Number Connection Test A and negatively correlated with the results of the Digit Symbol Test and Block Design Test. In contrast, FA values of WM ROIs [FA(ROI1) and FA(ROI2)] were significantly negatively correlated with the Number Connection Test A and positively correlated with the Digit Symbol Test and the Block Design Test scores. Longer time to complete Number Connection Test A and lower scores in the Digit Symbol Test and Block Design Test indicated poorer performance. Patients' Child-Pugh scores were significantly correlated with MD(ROI1), MD(ROI2), FA(ROI1), and FA(ROI2).
Pearson correlation coefficients of MD and FA values with neurologic performances and Child-Pugh score among patients with cirrhosis and covert hepatic encephalopathy
For survival analysis, the median follow-up period was 18.0 months. By the end of the observation, 15 patients (11 with MHE and 4 with NHE) had died from liver-related complications. Given the consensus that the Child-Pugh score is a variable with prognostic value for survival among patients with cirrhosis,2,25,26,28 we assessed the predictive values of MD and FA alterations by multivariate Cox regression, taking into account the Child-Pugh score as a covariate. Cox regression showed that MD(ROI1) (hazard ratio [HR] = 4.253; 95% CI, 1.218–14.848; P = .023) was a predictor of survival, independent of the Child-Pugh score. Similarly, MD(ROI2) (HR = 3.948; 95% CI, 1.655–9.420; P = .002), FA(ROI1) (HR = 0.823; 95% CI, 0.696–0.973; P = .022), and FA(ROI2) (HR = 0.805; 95% CI, 0.671–0.965; P = .019) showed prognostic value on survival as well, in addition to the Child-Pugh assessment.
Discussion
In this study, by using machine learning, we found that MD values in the bilateral frontal lobes, the precuneus, and the corpus callosum differentiate subjects with MHE and NHE; similarly, FA values in the bilateral frontal lobes, the corpus callosum, and the left paracentral lobule distinguish subjects with MHE from those with NHE. Meanwhile, MD and FA values of WM ROIs had prognostic value for survival, independent of the Child-Pugh score. These findings suggest the utility of measuring WM water molecular diffusivity for MHE detection.
WM edema (reflected by increased MD)7⇓⇓⇓–11 and impaired cerebral structures12⇓–14 have been demonstrated to play an important role in the MHE mechanisms. WM edema, which could be extracellular and/or cytotoxic in origin,8⇓–10 is considered closely associated with a metabolic disorder of ammonia in the brain tissue of patients with MHE.7,8,10,30 Although the neuropathologic mechanism of decreased FA is not well-understood in the setting of cirrhosis, one possible explanation is demyelination. Osmotic demyelination (due to inappropriate correction of hyponatremia31) has been noted in cirrhosis.32 Moreover, central nervous system inflammation has been shown to play an important role in HE,33 which may contribute to inflammatory demyelination as observed in other neurologic diseases such as multiple sclerosis.34 In addition, it has been found that factors released by astrocytes contribute to brain myelination,35 which would be impaired due to astrocytic dysfunction resulting from Alzheimer type II changes.7,8,10 Thus, reduction of WM FA may indicate impaired microstructural integrity in MHE.
Indeed, increased MD and decreased FA are also associated with the disruption of brain intrinsic networks,17,18 which can induce neurologic dysfunction in patients with MHE. In our study, the correlations between altered MD and FA values and psychometric results further suggest that WM abnormalities, especially in the corpus callosum and frontal and parietal lobes, are responsible for neurologic deficits such as psychomotor speed (reflected by the Number Connection Test A), attention and visual memory (reflected by the Digit Symbol Test), and visuospatial motor function (reflected by the Block Design Test).
We identified 2 spatially distributed WM ROIs, predominantly located in the bilateral frontal lobes, the corpus callosum, and bilateral parietal lobe, in MD maps as predictive of MHE. The ROIs identified from FA maps largely overlap those obtained from MD maps; this overlap indicates that these WM regions are predominantly affected by MHE pathology. Increased ammonia levels have been found to be associated with the increased ADC in the frontal and parietal WM.16 In addition, positron-emission tomography studies have indicated that an altered glial cell state, an important cause of MHE, occurs in the frontal WM and in the corpus callosum.36 The frontal and parietal WM and corpus callosum (particularly the anterior part) are the regions most commonly reported to demonstrate increased water content11 or diffusivity9,10,12,15,16 and decreased FA.15 When patients with cirrhosis in the intermediate state are excluded, Sugimoto et al16 reported 70%–90% sensitivity and 85%–90% specificity in classification of MHE and NHE, based on a frontal or parietal WM ADC metric. Their results indicate, to some extent, the usefulness of measuring WM diffusion features in MHE detection and are in line with our findings.
Increased regional MD has been found to be predictive of the development of overt HE,16 which has an ominous prognostic value on survival.2 Meanwhile, MHE is associated with increased risk of an episode of overt HE.5 It is believed that MHE (measured by neuropsychological tests) has prognostic value on survival in patients with cirrhosis with covert HE.25 These progressive patterns of disease may explain why we found increased MD to be predictive of survival for patients with cirrhosis with covert HE. Brain edema has been reported to be fatal, especially in high-grade HE, due to increased intracranial pressure.37,38 Moreover, our findings regarding the predictive values of MD and FA on survival agree with the consensus that brain edema9⇓–11 and structural impairment12,13 progress with advanced disease.
One strength of this study is the application of an advanced machine-learning method, GAMMA, to the detection of MHE-related biomarkers.20⇓–22 GAMMA is a nonparametric and multivariate Bayesian approach to model complex nonlinear multivariate associations among image features and the clinical variables. GAMMA automatically generates ROIs that can be used to differentiate MHE from NHE; this feature distinguishes our study from previous DWI studies, which relied on prespecified ROIs.8⇓–10,16 The consistency of classification across distinct thresholds suggests the validity of these results. Moreover, the significance of MD ROIs and FA ROIs in predicting survival provides further evidence regarding the validity of biomarkers detected by GAMMA.
One limitation of our study is that we confined our analysis to WM regions, where brain edema predominantly occurs in MHE11,15; however, several studies have indicated that other cerebral regions, such as subcortical nuclei,9,10 may also manifest low-grade edema. The second limitation is that we used a suboptimal DTI sequence with 6 diffusion-encoding gradient directions, due to the finite capability of our MR imaging scanner. The third limitation is that we only used DTI to generate biomarkers for MHE. Other MR imaging models (eg, resting-state fMRI39) have been reported to be useful in distinguishing MHE from NHE as well. DTI may be more readily applicable in the clinical setting because it is more convenient to obtain DTI relative to resting-state fMRI. However, the combination of these MR imaging techniques may yield more accurate classification and is an area for future extension of this research.
Conclusions
Combining advanced machine-learning techniques and DTI can generate biomarkers that identify patients with MHE among patients with cirrhosis with covert hepatic encephalopathy; both increased MD and decreased FA are predictive of survival. Our findings may be helpful in detecting MHE and improving subsequent treatment.
Appendix
Between-Group Comparison
The 2-sample t tests were performed to determine the regions with an MD/FA difference between 2 groups in a voxelwise way. The statistical threshold was set at P < .05 (the combination of P < .005 for single voxel and a minimum cluster size of 120 voxels), which was determined by Monte Carlo simulations by using the AlphaSim program (http://afni.nimh.nih.gov/afni).
Footnotes
Disclosures: Edward H. Herskovits—UNRELATED: Expert Testimony: Medicolegal; Grants/Grants Pending: Microsoft,* State of Maryland.* *Money paid to the institution.
This work was supported by the grants from the National Basic Research Program of China (973 Program: No. 2013CB733800, No. 2013CB733803), National Natural Science Foundation of China (No. 30910103905), Jiangsu Provincial Special Program of Medical Science (BL2013029), and Scientific Research Foundation of Graduate School of Southeast University (No. YBJJ1243).
Indicates open access to non-subscribers at www.ajnr.org
REFERENCES
- Received April 29, 2014.
- Accepted after revision September 5, 2014.
- © 2015 by American Journal of Neuroradiology


Jump to section
Related Articles
Cited By...
- No citing articles found.