
Abstract
BACKGROUND AND PURPOSE: Our aim was to assess the performance of flow-diverter stents. The pre- and end-of-treatment angiographies are commonly compared. However, the arterial flow rate may change between acquisitions; therefore, a better understanding of its influence on the local intra-aneurysmal hemodynamics before and after flow-diverter stent use is required.
MATERIALS AND METHODS: Twenty-five image-based aneurysm models extracted from 3D rotational angiograms were conditioned for computational fluid dynamics simulations. Pulsatile simulations were performed at different arterial flow rates, covering a wide possible range of physiologic flows among 1–5 mL/s. The effect of flow-diverter stents on intra-aneurysmal hemodynamics was numerically simulated with a porous medium model. Spatiotemporal-averaged intra-aneurysmal flow velocity and flow rate were calculated for each case to quantify the hemodynamics after treatment. The short-term flow-diverter stent performance was characterized by the relative velocity reduction inside the aneurysm.
RESULTS: Spatiotemporal-averaged intra-aneurysmal flow velocity before and after flow-diverter stent use is linearly proportional to the mean arterial flow rate (minimum R2 > 0.983 of the linear regression models for untreated and stented models). Relative velocity reduction asymptotically decreases with increasing mean arterial flow rate. When the most probable range of arterial flow rate was considered (3–5 mL/s), instead of the wide possible flow range, the mean SD of relative velocity reduction was reduced from 3.6% to 0.48%.
CONCLUSIONS: Both intra-aneurysmal aneurysm velocity and flow-diverter stent performance depend on the arterial flow rate. The performance could be considered independent of the arterial flow rates within the most probable range of physiologic flows.
ABBREVIATIONS:
- CFD
- computational fluid dynamics
- m
- ratio between the aneurysm velocity and the arterial flow
- Q̅
- mean arterial flow rate
- Qmin
- minimum arterial flow rate required to have a distinguishable velocity inside the aneurysm
- s
- stented
- u
- untreated
- velred
- relative velocity reduction
- v̅e̅l̅sa
- spatiotemporal-averaged flow velocity
Flow diverters are low-porosity stents designed to reduce the blood flow inside the aneurysm cavity. They also serve as a scaffold for neointima formation at the aneurysm ostium.1,2 To evaluate the potential occlusion performance by intrasaccular thrombus formation, one must conduct middle- and long-term observations. However, to foresee these future conditions and to assess potential short-term complications, one must evaluate immediate posttreatment hemodynamic features using the end-of-treatment angiography.3⇓–5
Qualitative, angiography-based metrics of short-term hemodynamics have been proposed, such as the SMART (simple measurement of aneurysm residual after treatment) scale or grading of the intrasaccular contrast flow speed.6,7 Additionally, more complex quantitative techniques have been introduced by processing the pre- and posttreatment angiograms.8 In most of these techniques, information about the contrast propagation is directly compared between pre- and posttreatment angiograms without paying attention to the potential arterial flow rate changes between image acquisitions and its impact on aneurysmal hemodynamics. It has been reported that change in 30%–50% of the mean arterial flow rate could lead to a 30%–80% variation of hemodynamic quantities, such as mean flow velocity, aneurysm inflow, or wall shear stress.9
The purpose of this study was to evaluate the role of the arterial flow rate on flow-diverter stent performance. Because patient-specific flow measurements are not unique and depend on the instance at which a medical examination is performed, a wide range of flow rates was considered.
Materials and Methods
Twenty-five aneurysms from different patients were investigated. 3D rotational angiography images of the aneurysms and their surrounding vasculature were acquired with an x-ray system (Allura Xper FD20; Philips Healthcare, Best, the Netherlands). All aneurysms were located between the siphon of the internal carotid artery and its downstream bifurcation. Medical data were collected by 2 departments of interventional neuroradiology: University Hospitals of Geneva, Geneva, Switzerland, and Beaujon University Hospital, France.
From these images, a surface mesh was extracted by image segmentation. The surface meshes were cleaned and smoothed. Hexahedral meshes inside each vascular model were generated with a cell size of 0.2 mm at the wall, 0.1 mm in the porous medium, and 0.2 mm elsewhere, with 4 cells between sizes. The total number of elements ranged between 2.08 × 10⁵ and 6.44 × 10⁵. For a given case, the same mesh was used for both untreated and stented models. More details about the mesh strategies can be found elsewhere.10⇓–12
In these volumetric meshes, governing equations of flow motion were solved by using the open-source computational fluid dynamics (CFD) package OpenFOAM 2.2.1 (www.openfoam.org). Arterial walls were considered rigid and nonslippery (flow velocity = 0). Blood was modeled as a Newtonian and incompressible fluid, with the knowledge that changes in blood viscosity due to increments in shear strain rates can be neglected.13 A parabolic profile was set at the inlet of each vascular model as a spatial condition, which changes in time according to the pulsatile waveform (temporal variation). Zero-pressure conditions were imposed at all outlets. Details of this methodology can be found elsewhere.10
Arterial Flow Rates
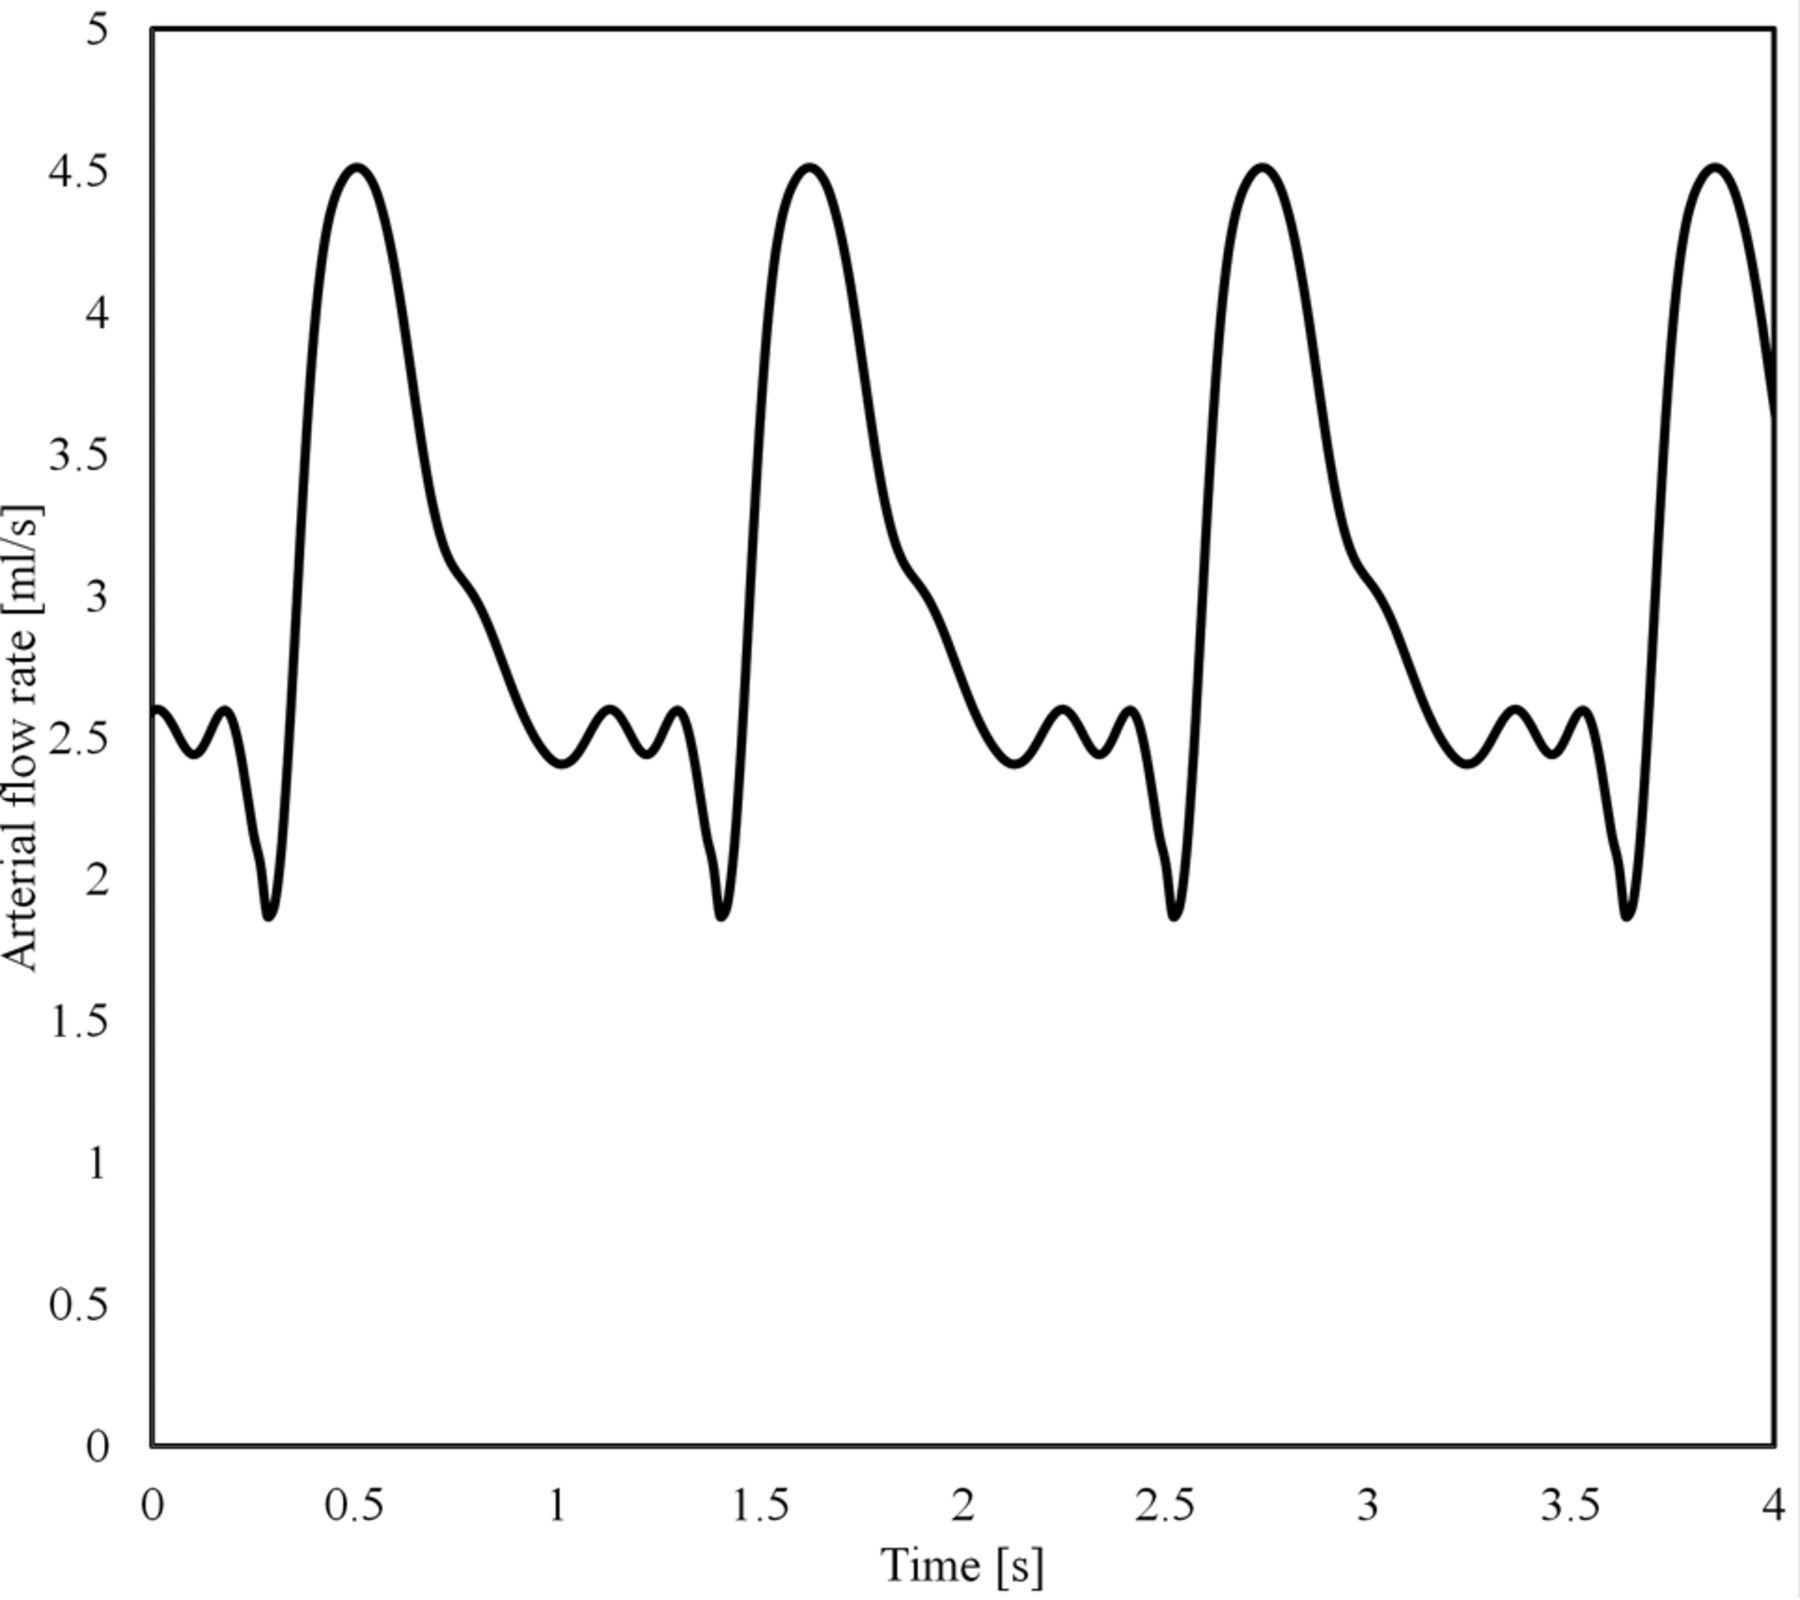
To single out the effect of the mean arterial flow rate, Q̅, the same shape of the flow waveform was used for all simulations, which was scaled to achieve the desired Q̅ (Fig 1). The waveform was originally extracted from a DSA sequence of a patient by using valid optical flow techniques.14⇓–16 Per case, 9 pulsatile flow simulations were created. Five of those flows were set within the most probable range (3 mL/s to 5 mL/s),17,18 every 0.5 mL/s. To cover lower flows, which occurs according to a possible range among 1 mL/s to 5 mL/s, we used both the inlet-area flow condition19 and the 1.5-Pa wall shear stress condition at the inlet. In case those strategies provided a value within 3 mL/s to 5 mL/s, flow rate values were imposed at 1.0, 1.5, 2.0, and 2.5 mL/s.10 With this configuration, the highest simulated flow rate has a systolic value of 7.56 mL/s, which is below the highest values measured in patients (>11 mL/s).17

Waveform (Q̅= 3 mL/s).
Virtual Stent Placement
To model the influence of a flow-diverter stent on the intra-aneurysmal hemodynamics, we placed a porous medium at the aneurysm ostium. This medium locally imposes an additional hydraulic resistance to flow and has been previously used.11,20⇓⇓–23 The Darcy-Forchheimer law was used in the porous medium, which includes both viscous- and inertia-related pressure losses. The parameters of this medium used were k = 8.7 × 10⁻⁷ (viscosity term) and F = 8.1 × 10⁴ (inertia term), and an equivalent porosity of around 70% was imposed. Details of the volumetric porous medium approach can be found elsewhere.11
Data Analysis
The following analysis was conducted to characterize the flow-diverter stent performance at different arterial flow rates.
Inside the aneurysm, the spatiotemporal-averaged flow velocity, v̅e̅l̅sa, was calculated, which has been shown to be independent of the waveform shape.12,24 Per case, linear regression models were applied to the untreated and stented datasets. The goal was to confirm that v̅e̅l̅sa can be characterized as a linear function of Q̅ (see Equation 1) for untreated aneurysms12 and to extend this characterization of the v̅e̅l̅sa after treatment under the hypothesis that this relationship should be preserved.

In Equation 1, the parameters m and Qmin are given by the linear regression models applied on the results of the CFD simulations, but they can also be derived from measurements by using functional image analysis.14,15 Qmin can be interpreted as the minimum arterial flow rate required to have a distinguishable velocity inside the aneurysm. The parameter m represents the ratio between the aneurysm velocity and the arterial flow.
Afterward, the flow-diverter stent performance was characterized by the relative velocity reduction, velred:
 where the indexes u and s stand for untreated and stented, respectively. By placing Equation 1 inside Equation 2 for both untreated and stented conditions, defining the slope ratio rm = ms / mu, and making Q̅s = Q̅u = Q̅, Equation 2 becomes:

To evaluate when velred becomes independent of the flow rate, Equation 3 was derived with respect to Q̅ and set to zero:
 where ΔQmin = Qmin,s−Qmin,u. Equation 4 is satisfied under 2 conditions:
The ratio rm is zero, meaning that the slope after stent placement (ms) is zero or “tiny” with respect to the slope before treatment (mu), ie, mu ≫ ms.
ΔQmin = 0, meaning that the Qmin before and after stent placement are the same (Qmin,s ≈ Qmin,u).
A less-evident third condition may occur in the case that both, Qmin,s and Qmin,u (in Equation 3), are small compared with Q̅. In this situation, equation 3 becomes

Results
In all cases, flow direction was changed after treatment. The porous medium produced an additional hydraulic resistance to flow near the aneurysm ostium, thus reducing the amount of flow that penetrates the aneurysm. Figure 2 shows examples of the flow patterns that can be obtained after flow diversion by using a porous medium. These results are similar to those using explicit stent models.25⇓–27 In general, it seems that the flow patterns were unaltered when Q̅ was changed.

Peak systolic instantaneous streamlines of velocity and an aneurysmal cut plane for case 8 at 2 arterial flow rates. Untreated and stented models are in the upper and lower rows, respectively.
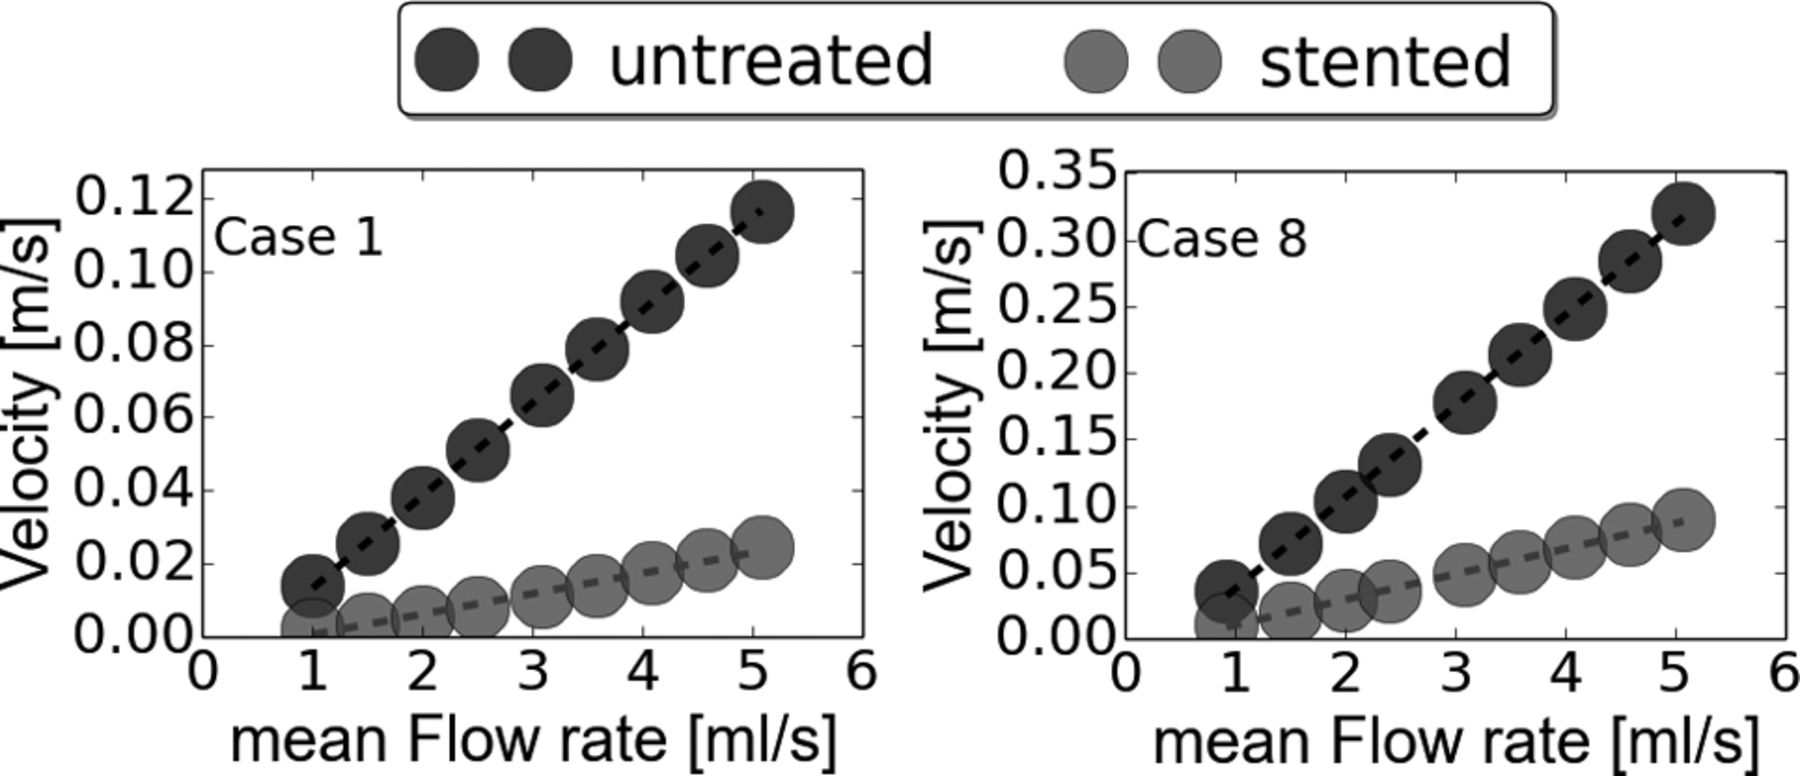
v̅e̅l̅sa linearly increased when Q̅ goes up before and after treatment for all cases (minimum R2 > 0.995 for untreated and R2 > 0.983 for stented cases). The Table presents the results of the linear regressions that were applied for each case before and after treatment. Moreover for all cases, the slope m was reduced (rm < 1) and Qmin,s > Qmin,u (ΔQ > 0) after flow-diverter stent placement. Figure 3 depicts the v̅e̅l̅sa as a function of Q̅ for cases 1 and 8 as a visual example of these results. Using these linear regressions, we calculated velred (Equation 3) and plotted it in Fig 4 by using the range (1–6 mL/s).
Linear regressions for untreated and stented conditions for all aneurysm models

v̅e̅l̅sa for cases 1 and 8 before and after flow-diverter stent placement. Points were derived from CFD simulations, and the curves represent the linear regressions that were applied on each point set.

A, velred as function of Q̅, where the gray region represents the most probable arterial flow range (3–5 mL/s). B, Mean and SD of velred per case. C, Mean and SD of velred per case but only considering the most probable arterial flow range. velred is presented as a percentage.
In general, velred decreased with an increasing arterial flow rate (Fig 4A). However in cases 8, 11, and 22 (footnoted in the Table), almost a constant reduction was observed. In those cases, ΔQmin was relatively small (mean = 0.024 mL/s, maximum ≤ 0.05 mL/s) compared with the rest of the cases (mean = 0.37 mL/s, minimum ≥ 0.18 mL/s). These results can also be visualized in Fig 4B, where the standard deviation of velred is presented for each case. When the most probable flow range is taken into account at 3–5 mL/s,17,18 the mean SD of velred was reduced from 3.6% (Fig 4B) to 0.48% (Fig 4C).
Discussion
In this study, the intra-aneurysmal hemodynamics were investigated before and after flow-diverter stent placement for different arterial flow rates in 25 aneurysm models. As was expected, v̅e̅l̅sa increases when the arterial flow rate goes up (Fig 3). However, the increment is linear and can be simply represented by 2 coefficients: m and Qmin. When the short-term flow-diverter stent performance is characterized by the relative reduction of the aneurysm flow velocity, velred (Equation 3), the flow-diverter stent was relatively “more effective” at lower flow rates than at higher ones (Fig 4). To better understand these findings, we performed the following analyses.
Linear Law
It was confirmed in untreated aneurysm models that the v̅e̅l̅sa linearly depends on Q̅ (R2 > 0.995),12 and this linear relationship was extended for stented aneurysms (R2 > 0.983). Indeed, from a hemodynamic point of view, a stented aneurysm is like another aneurysm with a particular resistance near the ostium (obtained by the stent), and this law is preserved. This relationship is very useful for characterizing aneurysm flow velocities because the influence of the arterial flow rate is included. Other variables such as wall shear stress or pressure can be also represented as functions of Q̅, but a quadratic relation seems to be more appropriate according to previous studies.12,24 These characterizations go beyond any hemodynamic assessment by using patient-specific measurements (either from CFD simulations or from image processing), because those evaluations are limited to flow conditions during recording, which change with time.
This linear law describes the intra-aneurysmal velocity at any flow rate in terms of the slope m and Qmin (both positive). If the endovascular device reduced the aneurysmal velocity, 2 changes were observed in these curves. First, the slope after treatment must be smaller than before (yet still positive), making rm < 1. This ratio is a direct indication that the blood flow speed is decreased after treatment, with the benefit of being independent of the arterial flow rate. For example, rm can be used to compare devices for a given aneurysm because it is related to the untreated condition, and a lower rm means that the implanted device will produce a higher velocity reduction inside the aneurysm. On the contrary, rm > 1 means that the treatment is actually increasing the velocity inside the aneurysm, which could be harmful and may increase the risk of rupture.
The slopes can also be used to compare cases because they quantify the hemodynamics of each aneurysm, independent of the arterial flow rate. For example, a standardized “critical slope” after flow diversion can be identified, in which aneurysm thrombosis would be expected. Nevertheless, further investigation is required to find this critical slope in a larger dataset with clinical follow-up information. Still, if these curves are used for this purpose or another one such as aneurysm rupture, then the specific arterial flow rate at which those aneurysms were evaluated becomes irrelevant because the flow rate is implicitly considered when using this approach.
The second change in the curves is that Qmin increases after stent placement; this change makes a positive ΔQmin (Qmin,s − Qmin,u). As discussed by Morales and Bonnefous,12 Qmin is given by the regressions and does not necessarily represent a physical phenomenon (zero velocity for a given nonzero flow rate), though it can be seen as the minimum arterial flow rate required to have a distinguishable flow motion inside the aneurysm cavity. Qmin increases after stent placement because the blood flow needs more energy (a higher Qmin) to overcome the additional hydraulic resistance produced by the flow-diverter stent and then to generate this distinguishable flow motion.
The validity of the linear model is only within the possible flow rate range studied here, which includes the most probable physiologic range. For flow rates between 0 and 1.0 mL/s, a quadratic model crossing the origin would be more appropriate. Nevertheless, the interest in such a low range is arguable because it will not be a physiologic condition and other phenomena, such as blood coagulation, may arise. Moreover, because the flow rate range covered here is based on the variability among patients,19 a shorter patient-specific flow range should be within this wide range without affecting the presented relationships for that patient.
Flow-Diverter Stent Performance and Arterial Flow Rate
In this study, the short-term flow-diverter stent performance was characterized by velred.
As presented in Equation 3 and confirmed in Fig 4, velred is higher when the arterial flow rate is low. This finding indicates that the arterial flow rate should be taken into account to fairly compare the performance of endovascular devices by any approach (in vivo, in vitro, or in silico). Using the same Reynolds number would not be fair for comparing the hemodynamics of 2 (or more) aneurysms because this number depends on the local arterial caliber; therefore, if 2 cases have the same number, the one with the higher arterial caliber will have a lower flow rate. This lower arterial flow rate benefits the device performance as shown in Fig 4A.
The weakening of the stent performance when increasing the arterial flow rate (and vice versa) is because the hydraulic resistance of the flow-diverter stent decreases when increasing the Reynolds number (proportional to the flow rate). This phenomenon is well-known in classic fluid mechanics and has been thoroughly studied for high-porosity stent placement in cerebral aneurysms.25
Previously, Larrabide et al26 performed CFD simulations by using an explicit representation of the flow-diverter stents to investigate the velocity variation during the cardiac cycle as a mean to quantify the device performances. They found that the pulsatility of the aneurysmal velocity increases after treatment. Similarly, Peach et al27 investigated the influence of several flow-diverter stent designs (different porosities and pore sizes) on hemodynamics, and the lowest flow reductions were seen at peak systole, when parent vessel flow is at its highest. These studies show that the stent performance is “weaker” at systole than at diastole (higher-versus-lower arterial flow rates); this finding is congruent with our findings when increasing the arterial flow rates.
Additionally, Mut et al9 varied the flow rate conditions before and after flow-diverter stent placement. It was found that a change in 30%–50% of the mean arterial flow could lead to a variation between 30% and 80% of some hemodynamic quantities. This is similar to the presentation in Fig 3—that is, variations of Q̅ do change v̅e̅l̅sa. Besides, the authors concluded that this variation can lead to misleading interpretations when clinical information is used, in particular, when pre- and posttreatment conditions are compared because flow conditions may vary among image acquisitions. The results presented here are in accordance with this statement, and the authors stress that caution is needed when comparing the 2 situations (either experimental or clinical) in which the arterial flow rates are known.
Flow Rate–Free Performance
The first condition that satisfies Equation 4 was not found in our study because it means flow cessation inside the aneurysm after treatment (ms = 0), which can be achieved after several months due to the formation of intrasaccular thrombus. The second condition was observed in 3 cases. There, ΔQmin was very small (≤0.05 mL/s) compared with the rest of the cases (minimum ≥ 0.018 mL/s).
The third condition that makes velred independent of Q̅ is the one derived from Equation 5. The largest variations in velred were observed at the lower end of the possible flow range, which are outside the most probable range at the ICA (gray region in Fig 4A). Nevertheless, further investigation is required in a larger population to see for which cases this assumption is plausible, by measuring the SD of velred, for example. A possible case stratification could be based on morphologic features such as aneurysm size and shape.
Potential Clinical Translation
Equation 5 is a plausible way to transfer these findings into clinical practice. However, this equation assumes that Q̅s = Q̅u = Q̅ and that Q̅ ≫ Qmin (for untreated and stented conditions).
To overcome the first limitation, (ie, Q̅s ≠ Q̅u), a more general expression should be used:
 Equation 6 states that velred can be obtained by knowing rm, the arterial flow rate before (Q̅u) and after treatment (Q̅s) and that those Q̅'s should be higher to neglect the influence of each Qmin. These quantities can be obtained from either CFD simulations or image analysis. For the latter, medical images can be processed by using optical flow techniques to retrieve both the arterial and aneurysm flows.14⇓–16
From a more generic perspective, this study reveals the importance of the arterial flow rate when evaluating aneurysm hemodynamics. As a consequence, qualitative evaluations such as the SMART scale or the grading of contrast flow speed should be avoided because no distinction can be made between variations in contrast due to either the implanted device or a reduction in the arterial flow rate. This advice is very important when comparing pre- and posttreatment angiograms of the same patient, but also when comparing among subjects. Additionally, this study proposes a simple quantification approach in which the arterial flow rate is considered to properly quantify aneurysm hemodynamics.
Limitations
Arterial walls were considered a rigid wall though it is known that the arteries are flexible structures and radial dilations occur due to pressure changes. Nevertheless, it is expected that main flow structures will be preserved.28 As in both numeric and experimental studies, the vascular morphology was not altered after flow-diverter stent placement. Indeed, the placement of a stent could locally change the artery shape. Unfortunately, it is not possible to overcome this limitation due to the lack of information regarding the mechanical properties of the artery and implanted devices, as well as the surrounding tissue and organs that could influence the final morphology after stent placement.
Conclusions
Spatiotemporal-averaged intra-aneurysmal velocity can be characterized by a linear function of the arterial flow rate before and after flow-diverter stent placement. This characterization provides a simple way to study intra-aneurysmal hemodynamics that goes beyond any patient-specific flow measurements. By using this linear relationship, it was found that the arterial flow rate affects the short-term flow-diverter stent performance. However, the device performance can be considered independent of the arterial flow rates within (and above) the physiologic flow range.
Acknowledgments
We thank the units of interventional neuroradiology of the Department of Medical Imaging and Information Sciences, University Hospitals of Geneva, Switzerland, and of Beaujon University Hospital, Clichy, France, for providing the medical images from which the vascular models were extracted.
Footnotes
Disclosures: Vitor Mendes Pereira—UNRELATED: Grant: Philips Healthcare,* Comments: grant to pay for a technician for 2 years for a related research project. Laurent Spelle—UNRELATED: Consulting Fee or Honorarium: Medtronic, Stryker, Sequent Medical. Jacques Moret—UNRELATED: Consultancy: Covidien, MicroVention, Stryker. Ignacio Larrabide—UNRELATED: Consultancy: Galgo Medical S. L.; Employment: CONICET and UNICEN; Patents (planned, pending or issued): WO 2015063352 A1. *Money paid to the institution.
References
- Received November 19, 2015.
- Accepted after revision July 20, 2016.
- © 2016 by American Journal of Neuroradiology


