Advertisement

Main menu

  • Home
  • Content
    • Current Issue
    • Accepted Manuscripts
    • Article Preview
    • Past Issue Archive
    • AJNR Case Collection
    • Case of the Week Archive
    • Classic Case Archive
    • Case of the Month Archive
  • Special Collections
    • Spinal CSF Leak Articles (Jan 2020-June 2024)
    • 2024 AJNR Journal Awards
    • Most Impactful AJNR Articles
  • Multimedia
    • AJNR Podcast
    • AJNR Scantastics
    • Video Articles
  • For Authors
    • Submit a Manuscript
    • Author Policies
    • Fast publishing of Accepted Manuscripts
    • Graphical Abstract Preparation
    • Manuscript Submission Guidelines
    • Imaging Protocol Submission
    • Submit a Case for the Case Collection
  • About Us
    • About AJNR
    • Editorial Board
  • More
    • Become a Reviewer/Academy of Reviewers
    • Subscribers
    • Permissions
    • Alerts
    • Feedback
    • Advertisers
    • ASNR Home
  • Other Publications
    • ajnr

User menu

  • Alerts
  • Log in

Search

  • Advanced search
American Journal of Neuroradiology

American Journal of Neuroradiology

ASHNR American Society of Functional Neuroradiology ASHNR American Society of Pediatric Neuroradiology ASSR
  • Alerts
  • Log in

Advanced Search

  • Home
  • Content
    • Current Issue
    • Accepted Manuscripts
    • Article Preview
    • Past Issue Archive
    • AJNR Case Collection
    • Case of the Week Archive
    • Classic Case Archive
    • Case of the Month Archive
  • Special Collections
    • Spinal CSF Leak Articles (Jan 2020-June 2024)
    • 2024 AJNR Journal Awards
    • Most Impactful AJNR Articles
  • Multimedia
    • AJNR Podcast
    • AJNR Scantastics
    • Video Articles
  • For Authors
    • Submit a Manuscript
    • Author Policies
    • Fast publishing of Accepted Manuscripts
    • Graphical Abstract Preparation
    • Manuscript Submission Guidelines
    • Imaging Protocol Submission
    • Submit a Case for the Case Collection
  • About Us
    • About AJNR
    • Editorial Board
  • More
    • Become a Reviewer/Academy of Reviewers
    • Subscribers
    • Permissions
    • Alerts
    • Feedback
    • Advertisers
    • ASNR Home
  • Follow AJNR on Twitter
  • Visit AJNR on Facebook
  • Follow AJNR on Instagram
  • Join AJNR on LinkedIn
  • RSS Feeds

Welcome to the new AJNR, Updated Hall of Fame, and more. Read the full announcements.


AJNR is seeking candidates for the position of Associate Section Editor, AJNR Case Collection. Read the full announcement.


Research ArticleAdult Brain

Quantifying Tissue Properties of the Optic Radiations Using Strategically Acquired Gradient Echo Imaging and Enhancing the Contrast Using Diamagnetic Susceptibility Weighted Imaging

P.K. Jella, Y. Chen, W. Tu, S. Makam, S. Beckius, E. Hamtaei, C.C.-T. Hsu and E.M. Haacke
American Journal of Neuroradiology February 2021, 42 (2) 285-287; DOI: https://doi.org/10.3174/ajnr.A6897
P.K. Jella
aFrom the Department of Radiology (P.K.J., S.B., E.M.H.)
  • Find this author on Google Scholar
  • Find this author on PubMed
  • Search for this author on this site
  • ORCID record for P.K. Jella
Y. Chen
bNeurology (Y.C.), Wayne State University School of Medicine, Detroit, Michigan
  • Find this author on Google Scholar
  • Find this author on PubMed
  • Search for this author on this site
  • ORCID record for Y. Chen
W. Tu
cShanghai World Foreign Language Academy (W.T.), Shanghai, China
  • Find this author on Google Scholar
  • Find this author on PubMed
  • Search for this author on this site
  • ORCID record for W. Tu
S. Makam
dDetroit Medical Center (S.M.), Detroit, Michigan
  • Find this author on Google Scholar
  • Find this author on PubMed
  • Search for this author on this site
  • ORCID record for S. Makam
S. Beckius
aFrom the Department of Radiology (P.K.J., S.B., E.M.H.)
  • Find this author on Google Scholar
  • Find this author on PubMed
  • Search for this author on this site
  • ORCID record for S. Beckius
E. Hamtaei
eMR Innovations Inc. (E.H., E.M.H.), Bingham Farms, Michigan
  • Find this author on Google Scholar
  • Find this author on PubMed
  • Search for this author on this site
  • ORCID record for E. Hamtaei
C.C.-T. Hsu
fDivision of Neuroradiology, Department of Medical Imaging (C.C.-T.H.), Gold Coast University Hospital, Southport, Australia
  • Find this author on Google Scholar
  • Find this author on PubMed
  • Search for this author on this site
  • ORCID record for C.C.-T. Hsu
E.M. Haacke
aFrom the Department of Radiology (P.K.J., S.B., E.M.H.)
eMR Innovations Inc. (E.H., E.M.H.), Bingham Farms, Michigan
  • Find this author on Google Scholar
  • Find this author on PubMed
  • Search for this author on this site
  • ORCID record for E.M. Haacke
  • Article
  • Figures & Data
  • Info & Metrics
  • Responses
  • References
  • PDF
Loading

Abstract

SUMMARY: Visualization of the optic radiations is of clinical importance for diagnosing many diseases and depicting their anatomic structures for neurosurgical interventions. In this study, we quantify proton density, T1, T2*, and susceptibility of the optic radiation fiber bundles in a series of 10 healthy control participants using strategically acquired gradient echo imaging. Furthermore, we introduce a novel means to enhance the contrast of the optic radiations using diamagnetic susceptibility weighted imaging.

ABBREVIATIONS:

dSWI
diamagnetic susceptibility weighted imaging
ESS
external sagittal striatum
ISS
internal sagittal striatum
OR
optic radiation
STAGE
strategically acquired gradient echo
TAP
tapetum
HPF
high-pass-filtered
QSM
quantitative susceptibility map
PD
proton density

Some pathologies may benefit from studying the tissue properties of the optic radiations (ORs). The ORs are a common site for chronic small-vessel ischemic changes, especially in older adults.1 Periventricular demyelinating plaques in multiple sclerosis also have a propensity to involve the ORs.2 Wallerian degeneration of the OR fibers can occur from a wide range of injuries to the visual pathway such as traumatic optic neuropathy,3 compressive optic neuropathy, degeneration of the ORs in patients with glaucoma, restricted blood supply of the optic nerve followed by ischemic infarction, and various postoperative visual deficits. Infarcts in both middle and posterior cerebral artery territories can cause injury to the ORs, causing homonymous hemianopia. Finally, preoperative localization of the ORs can be important to ensure the ORs are not affected during neurosurgical procedures.4

Knowledge of the tissue properties of each structure is important to image the 3 bundles of the ORs (external sagittal striatum [ESS], internal sagittal striatum [ISS], and tapetum [TAP]) with adequate contrast. Therefore, we proposed using strategically acquired gradient echo (STAGE) imaging as a means to collect qualitative and quantitative information to study the tissue properties of the ORs.5 STAGE uses 2 contiguous double-echo gradient-echo sequences with differing flip angles. STAGE provides a variety of different contrasts, including T1, proton density (PD), quantitative susceptibility map (QSM), and R2* maps. Finally, we propose using diamagnetic susceptibility weighted imaging (dSWI) to further improve visualization of the OR.

MATERIALS AND METHODS

All participants signed consent forms approved by the local institutional review board. Data were collected on a 3T scanner (Verio; Siemens) using a 32-channel head coil. STAGE imaging was used to acquire the data (imaging parameters are given in a previous work).5 Briefly, we used TR = 25 ms, flip angles = 6° and 24°, TEs = 7.5 and 17.5 ms, bandwidth = 270 Hz/pixel, and resolution = 0.67 × 0.67 × 2 mm3. With a parallel imaging acceleration factor of 2, STAGE acquisition time was 7 minutes each for these 2 high-resolution scans. They were repeated 3 times, co-registered using SPM,6 averaged to increase the signal-to-noise ratio, and processed using software described previously.5 In addition, instead of using a positive phase mask from the phase,7 we generated dSWI data using a negative phase mask. The following 8 images were evaluated: T2* PD-weighted (the B1 field variation corrected second echo magnitude of the low flip angle scan), PD map, T1 map, R2* map, pure-PD map (T2*-corrected PD map), high-pass-filtered (HPF) phase, dSWI, and QSM. The images were reviewed throughout the OR bundles over roughly 10–15 slices using SPIN software (SpinTech). Slices that demonstrated the best contrast and most uniform signals were used. Given the narrow width of the OR bundles and adjacent bands of WM, for quantification purposes, a line was drawn down the middle of the bundles for ESS, ISS, TAP, and outer and inner WM. Mean and standard deviation were calculated for each layer. The PD values were normalized to the outer WM regions. These measurements were calculated for both the right and left ORs and averaged.

RESULTS

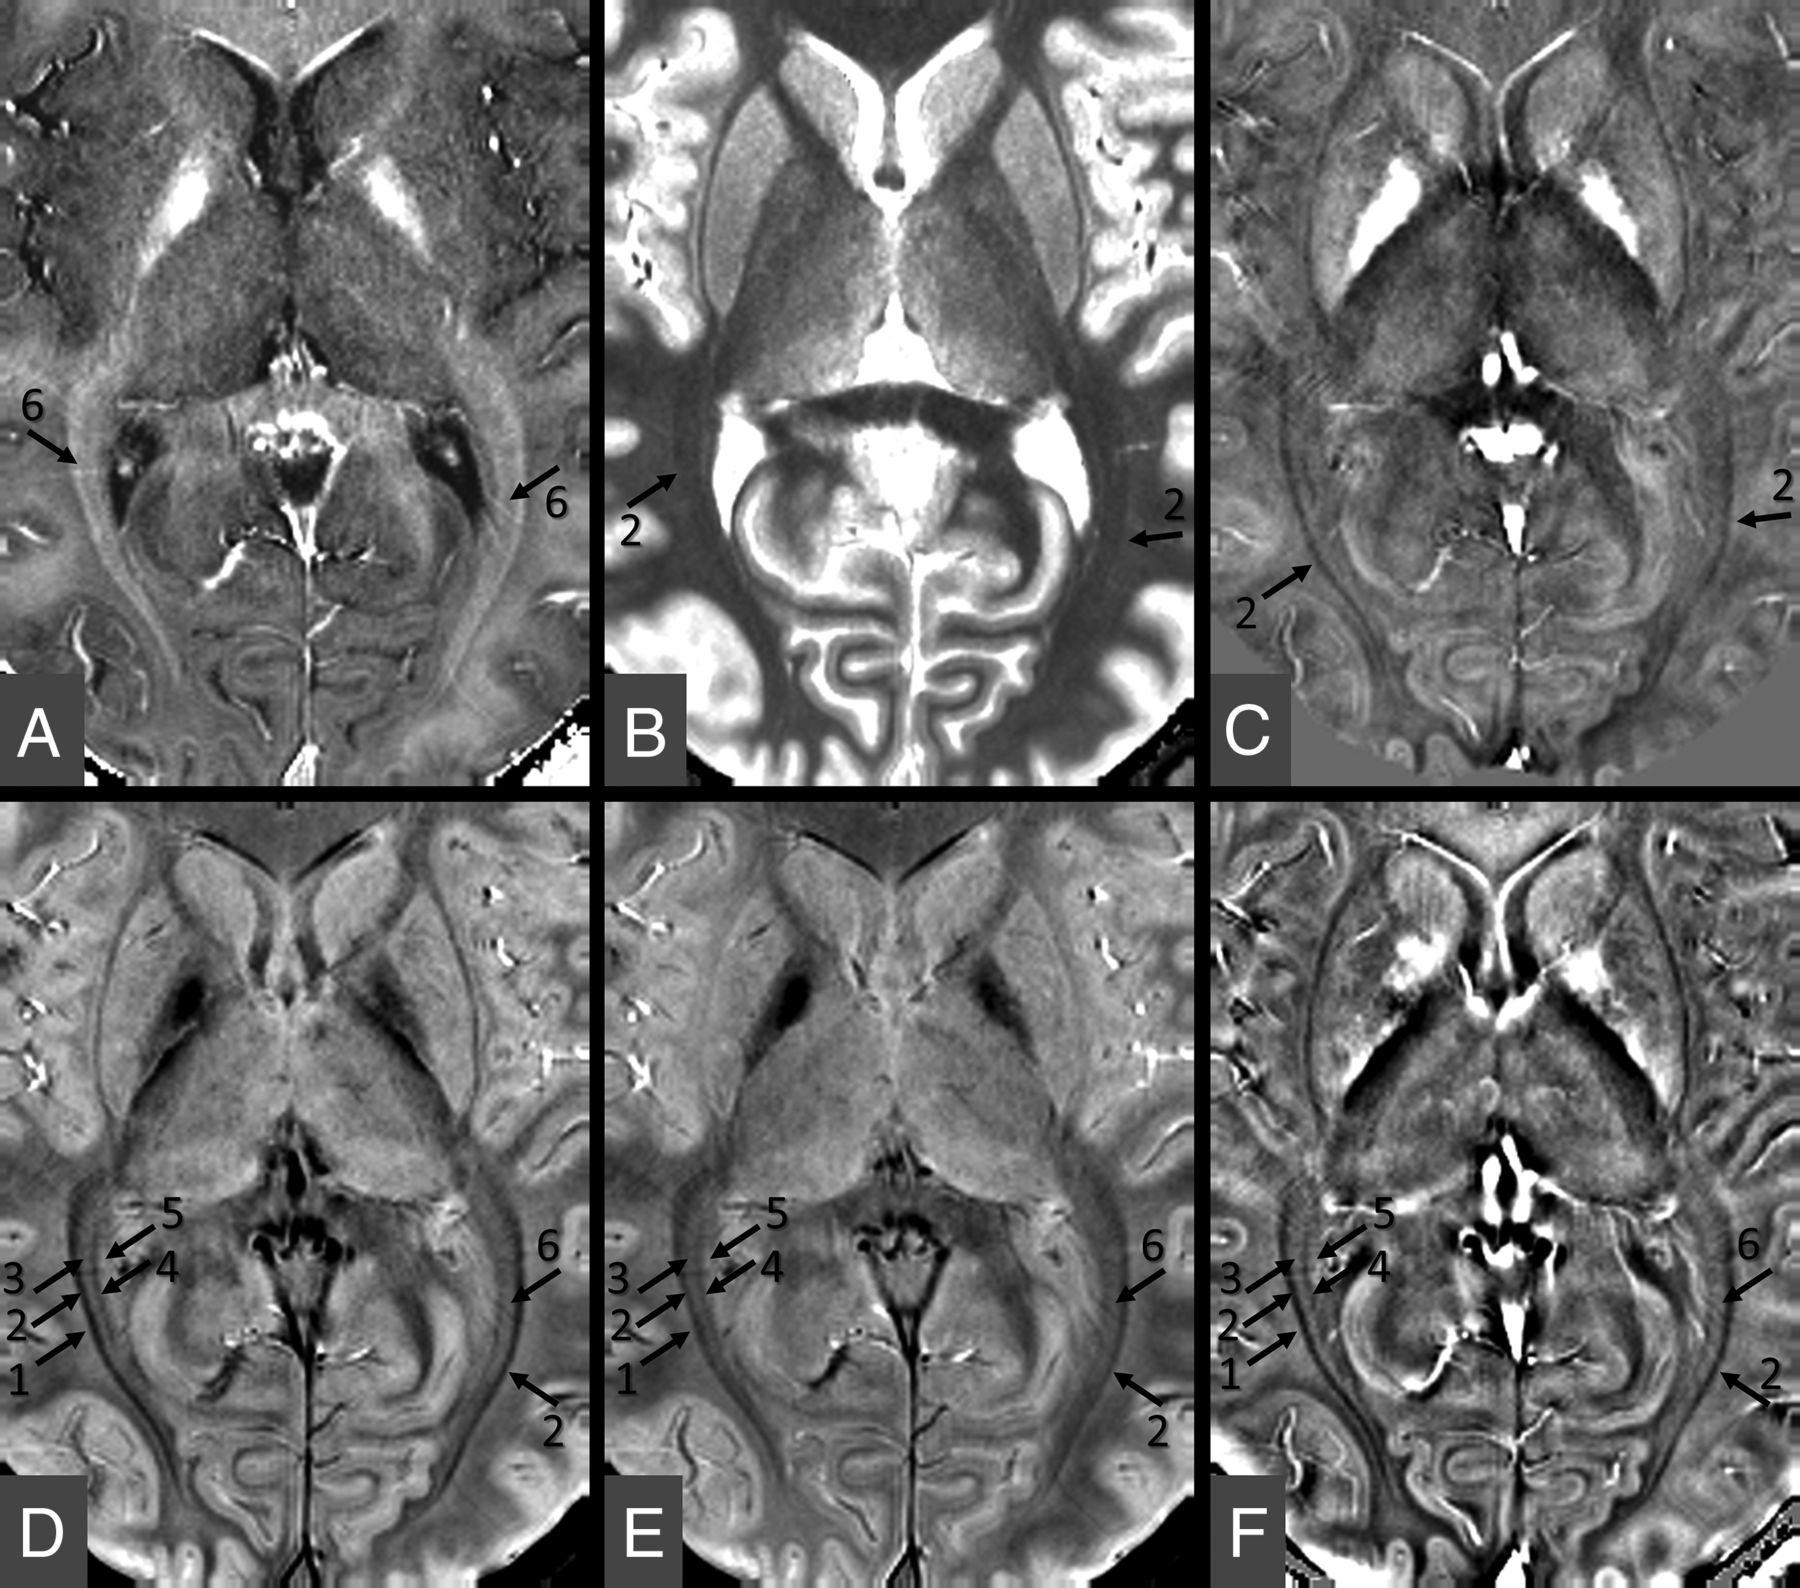
Ten healthy volunteers were imaged (mean age, 28.7 ± 5.3 years; range, 20–37 years; 6 female). The 3 bundles of the ORs can be seen clearly in the Figure, D–F. Each image type revealed a different contrast mechanism. 1) On the R2* map, the ESS is part of the bright band that appears to cover all 3 bundles. The 2 dark bands abutting each side of the ORs represent adjacent subcortical WM. There are occasional medullary veins imaged orthogonal to the long axis of the OR. These appear as white bands on R2* and HPF images (Figure A, F) and dark bands on the dSWI and T2* PD-weighted images (Figure D, E) cutting across the 5 bundles. 2) On the QSM and HPF phase images (Figure C, F), the ESS is the darkest band. Often the ISS and TAP cannot be identified clearly on these 2 images, and the medullary veins appear bright. 3) On the PD map, the 5 layers (WM, ESS, ISS, TAP, and WM) can be identified with the 3 OR bundles appearing as “dark–bright–dark” bands in the images as “ESS–ISS–TAP.” The adjacent subcortical WM is the 2 white bands outside the ESS and lateral to the tapetum. 4) On the T1 map and pure-PD map images, only the dark band representing ESS can be seen. Finally, 5) the dSWI and T2* PD-weighted images showed the best contrast depicting all 5 layers (Figure D, E). The dSWI provided the highest contrast between the 5 layers with the ESS being highlighted because of the intrinsic diamagnetic nature of the fiber bundles.

FIGURE.
  • Download figure
  • Open in new tab
  • Download powerpoint
FIGURE.

Example images used for evaluating the ORs from a representative case (a 32-year-old woman). A, R2* map. B, T1 map. C, QSM. D, dSWI. E, T2*-PD-weighted image. F, HPF phase image. The T2*-PD-weighted and dSWI show the best contrast for visualizing the ORs, in which the ESS and TAP (black arrows 2 and 4) and the ISS (arrow 3) can be identified. In D and E, one can see 5 bundles: the outer WM layer (arrow 1), the ESS (arrow 2), the ISS (arrow 3), the TAP (arrow 4), and the inner WM (arrow 5) layer. Also, for the T2*-PD-weighted (E), R2* (A), dSWI (D), and HPF phase data (F), there is evidence of veins cutting across the 5 bundles (arrow 6).

Our data show that tissues with the highest PD have the highest T1, lowest R2*, and susceptibility close to zero (Table). On the other hand, the most negative PD tissues (the ESS and tapetum) have the lowest T1, highest R2*, and most negative susceptibility (Table). Specifically, the WM had the highest T1 of 864.3 ± 23.4 (ms), the lowest R2* of 20.1 ± 1.3 (s−1), and a susceptibility of −3.1 ± 11.3 ppb (effectively zero). The 3 bundles of the ORs showed relative PD about 0.911, T1 of about 784 ms, and R2* values of about 28/s. All of these are significantly different from WM (P < .001 for 1-way ANOVA followed by the Tukey-Kramer post hoc test).

View this table:
  • View inline
  • View popup

Averaged results over all 10 participants showing the quantitative tissue properties of the 3 bundles of the ORs compared with adjacent WM

DISCUSSION AND CONCLUSIONS

In this work, the MR tissue properties of the layers of the OR bundles and the adjacent WM were quantitively analyzed using STAGE. We found that T1 and R2* for different tissues behave as expected relative to water content with the highest PD tissues having the highest T1, lowest R2* and close to zero susceptibility and the lowest PD tissues having the lowest T1 and highest R2*. As expected, the diamagnetic fiber tracts, especially the ESS, which has the highest density of fibers, had the most negative susceptibility. Using the T2*-PD-weighted image along with SWI processing for diamagnetic structures, the best contrast was shown for the dSWI data. Although the OR bundles have been difficult to differentiate on conventional MR imaging, we have shown here that SWI and dSWI can exquisitely delineate the separate layers of the OR bundles based on their differences in susceptibility (Fig).8,9

Compared with its neighboring fiber bundles, the ESS is the richest in myelin, demonstrating both the largest axons and thickest myelin sheaths.9 It is usually the easiest to visualize, but the ISS and TAP are often difficult to visualize. Not only does the diamagnetic susceptibility of the ESS help enhance its contrast, but it can also be used to predict the increase in R2*. Recent works have shown that changes in R2* (1/s) are roughly one-eighth changes in susceptibility (given in parts per billion) at 3T.10 With a change of roughly 30 ppb relative to WM in the ESS, this would predict a change of roughly 4/s in R2*, very close to the 5/s seen in our data. One could imagine using dSWI as a means to guide or constrain the fiber tracking in diffusion tensor imaging for the ORs.11

There are several limitations to this study. First, the sample size is small and does not capture the potential alterations in tissue properties with age. Second, higher resolution imaging could provide even better definition of the different layers of the ORs but requires longer scanning time.

In summary, whereas STAGE is best suited to quantify the tissue properties and delineate the OR bundles, dSWI provides high-contrast images of the ORs and the surrounding subcortical WM layers.

Footnotes

  • P.K.J. and Y.C. contributed equally.

  • Disclosures: Pavan Jella—UNRELATED: Employment: Wayne State University, Comments: I am an employee at Wayne State University, and I am paid for performing my responsibilities as a research assistant and MRI technologist. Charlie Chia-Tsong Hsu—UNRELATED: Employment: Gold Coast University Hospital. E. Mark Haacke—UNRELATED: Board Membership: SpinTech Inc, Comments: Chief Scientific Officer; Employment: Wayne State University; Grants/Grants Pending: Wayne State University.

References

  1. 1.↵
    1. Kitajima M,
    2. Korogi Y,
    3. Okuda T, et al
    . Hyperintensities of the optic radiation on T2-weighted MR images of elderly subjects. AJNR Am J Neuroradiol 1999;20:1009–14 pmid:10445436
    Abstract/FREE Full Text
  2. 2.↵
    1. Reich DS,
    2. Smith SA,
    3. Gordon-Lipkin EM, et al
    . Damage to the optic radiation in multiple sclerosis is associated with retinal injury and visual disability. Arch Neurol 2009;66:998–1006 doi:10.1001/archneurol.2009.107 pmid:19667222
    CrossRefPubMed
  3. 3.↵
    1. Steinsapir KD,
    2. Goldberg RA
    . Traumatic optic Neuropathies. In: Walsh and Hoyt’s Clinical Neuroophthalmology. 5th ed. Baltimore: Williams and Wilkins; 1998
  4. 4.↵
    1. Nooij R,
    2. Hoving E,
    3. van Hulzen A, et al
    . Preservation of the optic radiations based on comparative analysis of diffusion tensor imaging tractography and anatomical dissection. Front Neuroanat 2015;9:96 doi:10.3389/fnana.2015.00096 pmid:26300739
    CrossRefPubMed
  5. 5.↵
    1. Chen Y,
    2. Liu S,
    3. Wang Y, et al
    . STrategically Acquired Gradient Echo (STAGE) imaging, part I: Creating enhanced T1 contrast and standardized susceptibility weighted imaging and quantitative susceptibility mapping. Magn Reson Imaging 2018;46:130–39 doi:10.1016/j.mri.2017.10.005 pmid:29056394
    CrossRefPubMed
  6. 6.↵
    1. Penny WD,
    2. Friston KJ,
    3. Ashburner JT, et al
    . Statistical Parametric Mapping: The Analysis of Functional Brain Images. Elsevier; 2011
  7. 7.↵
    1. Haacke EM,
    2. Xu Y,
    3. Cheng YC, et al
    . Susceptibility weighted imaging (SWI). Magn Reson Med 2004;52:612–18 doi:10.1002/mrm.20198 pmid:15334582
    CrossRefPubMed
  8. 8.↵
    1. Ide S,
    2. Kakeda S,
    3. Korogi Y, et al
    . Delineation of optic radiation and stria of Gennari on high-resolution phase difference enhanced imaging. Acad Radiol 2012;19:1283–89 doi:10.1016/j.acra.2012.05.018 pmid:22854006
    CrossRefPubMed
  9. 9.↵
    1. Mori N,
    2. Miki Y,
    3. Kasahara S, et al
    . Susceptibility-weighted imaging at 3 Tesla delineates the optic radiation. Invest Radiol 2009;44:140–45 doi:10.1097/RLI.0b013e318193ff25 pmid:19151608
    CrossRefPubMed
  10. 10.↵
    1. Ghassaban K,
    2. Liu S,
    3. Jiang C, et al
    . Quantifying iron content in magnetic resonance imaging. Neuroimage 2019;187:77–92 doi:10.1016/j.neuroimage.2018.04.047 pmid:29702183
    CrossRefPubMed
  11. 11.↵
    1. Hofer S,
    2. Karaus A,
    3. Frahm J
    . Reconstruction and dissection of the entire human visual pathway using diffusion tensor MRI. Front Neuroanat 2010;4:15 doi:10.3389/fnana.2010.00015 pmid:20428499
    CrossRefPubMed
  • Received July 10, 2020.
  • Accepted after revision September 18, 2020.
  • © 2021 by American Journal of Neuroradiology
PreviousNext
Back to top

In this issue

American Journal of Neuroradiology: 42 (2)
American Journal of Neuroradiology
Vol. 42, Issue 2
1 Feb 2021
  • Table of Contents
  • Index by author
  • Complete Issue (PDF)
Advertisement
Print
Download PDF
Email Article

Thank you for your interest in spreading the word on American Journal of Neuroradiology.

NOTE: We only request your email address so that the person you are recommending the page to knows that you wanted them to see it, and that it is not junk mail. We do not capture any email address.

Enter multiple addresses on separate lines or separate them with commas.
Quantifying Tissue Properties of the Optic Radiations Using Strategically Acquired Gradient Echo Imaging and Enhancing the Contrast Using Diamagnetic Susceptibility Weighted Imaging
(Your Name) has sent you a message from American Journal of Neuroradiology
(Your Name) thought you would like to see the American Journal of Neuroradiology web site.
CAPTCHA
This question is for testing whether or not you are a human visitor and to prevent automated spam submissions.
Cite this article
P.K. Jella, Y. Chen, W. Tu, S. Makam, S. Beckius, E. Hamtaei, C.C.-T. Hsu, E.M. Haacke
Quantifying Tissue Properties of the Optic Radiations Using Strategically Acquired Gradient Echo Imaging and Enhancing the Contrast Using Diamagnetic Susceptibility Weighted Imaging
American Journal of Neuroradiology Feb 2021, 42 (2) 285-287; DOI: 10.3174/ajnr.A6897

Citation Manager Formats

  • BibTeX
  • Bookends
  • EasyBib
  • EndNote (tagged)
  • EndNote 8 (xml)
  • Medlars
  • Mendeley
  • Papers
  • RefWorks Tagged
  • Ref Manager
  • RIS
  • Zotero
0 Responses
Respond to this article
Share
Bookmark this article
Quantifying Tissue Properties of the Optic Radiations Using Strategically Acquired Gradient Echo Imaging and Enhancing the Contrast Using Diamagnetic Susceptibility Weighted Imaging
P.K. Jella, Y. Chen, W. Tu, S. Makam, S. Beckius, E. Hamtaei, C.C.-T. Hsu, E.M. Haacke
American Journal of Neuroradiology Feb 2021, 42 (2) 285-287; DOI: 10.3174/ajnr.A6897
del.icio.us logo Twitter logo Facebook logo Mendeley logo
  • Tweet Widget
  • Facebook Like
  • Google Plus One
Purchase

Jump to section

  • Article
    • Abstract
    • ABBREVIATIONS:
    • MATERIALS AND METHODS
    • RESULTS
    • DISCUSSION AND CONCLUSIONS
    • Footnotes
    • References
  • Figures & Data
  • Info & Metrics
  • Responses
  • References
  • PDF

Related Articles

  • No related articles found.
  • PubMed
  • Google Scholar

Cited By...

  • No citing articles found.
  • Crossref (1)
  • Google Scholar

This article has been cited by the following articles in journals that are participating in Crossref Cited-by Linking.

  • Advanced Neuro MR Techniques and Applications
    Sagar Buch, Yongsheng Chen, E. Mark Haacke
    2021 4

More in this TOC Section

Adult Brain

  • Diagnostic Neuroradiology of Monoclonal Antibodies
  • ML for Glioma Molecular Subtype Prediction
  • Segmentation of Brain Metastases with BLAST
Show more Adult Brain

Functional

  • Glutaric Aciduria Type 1: DK vs. Conventional MRI
  • Kurtosis and Epileptogenic Tubers: A Pilot Study
  • Choroid Plexus Calcification&Microglial Activation
Show more Functional

Similar Articles

Advertisement

Indexed Content

  • Current Issue
  • Accepted Manuscripts
  • Article Preview
  • Past Issues
  • Editorials
  • Editors Choice
  • Fellow Journal Club
  • Letters to the Editor

Cases

  • Case Collection
  • Archive - Case of the Week
  • Archive - Case of the Month
  • Archive - Classic Case

Special Collections

  • Special Collections

Resources

  • News and Updates
  • Turn around Times
  • Submit a Manuscript
  • Author Policies
  • Manuscript Submission Guidelines
  • Evidence-Based Medicine Level Guide
  • Publishing Checklists
  • Graphical Abstract Preparation
  • Imaging Protocol Submission
  • Submit a Case
  • Become a Reviewer/Academy of Reviewers
  • Get Peer Review Credit from Publons

Multimedia

  • AJNR Podcast
  • AJNR SCANtastic
  • Video Articles

About Us

  • About AJNR
  • Editorial Board
  • Not an AJNR Subscriber? Join Now
  • Alerts
  • Feedback
  • Advertise with us
  • Librarian Resources
  • Permissions
  • Terms and Conditions

American Society of Neuroradiology

  • Not an ASNR Member? Join Now

© 2025 by the American Society of Neuroradiology All rights, including for text and data mining, AI training, and similar technologies, are reserved.
Print ISSN: 0195-6108 Online ISSN: 1936-959X

Powered by HighWire