
Abstract
BACKGROUND: Previous studies reported that the ADC values of recurrent head and neck cancer lesions are lower than those of posttreatment changes, however, the utility of ADC to differentiate them has not been definitively summarized and established.
PURPOSE: Our aim was to evaluate the diagnostic benefit of ADC calculated from diffusion-weighted imaging in differentiating recurrent lesions from posttreatment changes in head and neck cancer.
DATA SOURCES: MEDLINE, Scopus, and EMBASE data bases were searched for studies.
STUDY SELECTION: The review identified 6 prospective studies with a total of 365 patients (402 lesions) who were eligible for the meta-analysis.
DATA ANALYSIS: Forest plots were used to assess the mean difference in ADC values. Heterogeneity among the studies was evaluated using the Cochrane Q test and the I2 statistic.
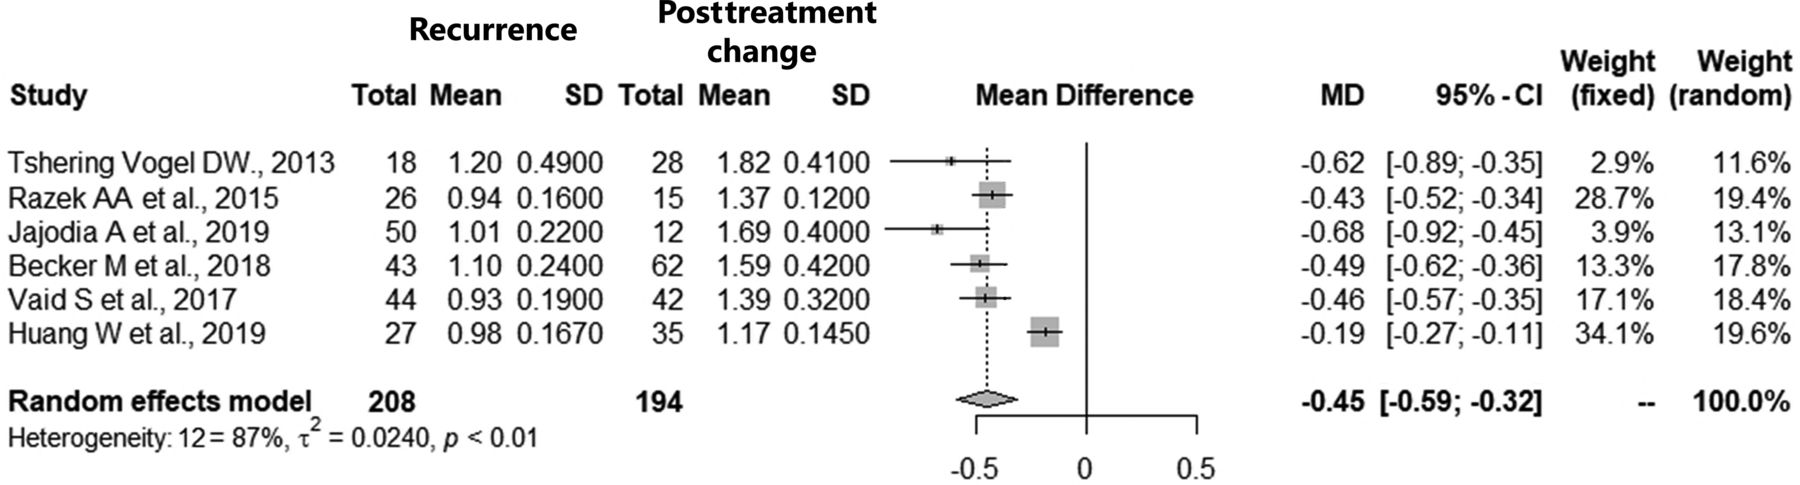
DATA SYNTHESIS: Among included studies, the overall mean of ADC values of recurrent lesions was 1.03 × 10⁻³mm2/s and that of the posttreatment changes was 1.51 × 10⁻³mm2/s. The ADC value of recurrence was significantly less than that of posttreatment changes in head and neck cancer (pooled mean difference: −0.45; 95% CI, −0.59–0.32, P < .0001) with heterogeneity among studies. The threshold of ADC values between recurrent lesions and posttreatment changes was suggested to be 1.10 × 10⁻³mm2/s.
LIMITATIONS: Given the heterogeneity of the data of the study, the conclusions should be interpreted with caution.
CONCLUSIONS: The ADC values in recurrent head and neck cancers are lower than those of posttreatment changes, and the threshold of ADC values between them was suggested.
The purpose of imaging evaluation in head and neck cancer follow-up after surgery, radiation therapy, and chemoradiation therapy is to determine the response to therapy, assess disease control, and detect locoregional recurrence; in particular, the detection of recurrent lesions subsequently leads to curative salvage therapy. Posttreatment changes in anatomic architecture due to edema, inflammation, and fibrosis occur frequently and can mimic recurrent lesions. Thus, differentiation between recurrent lesions and posttreatment changes can be difficult, making the interpretation of follow-up imaging after treatment of head and neck cancer difficult,1⇓-3 sometimes necessitating tissue biopsies for pathologic confirmation. PET/CT and contrast-enhanced CT are the primary imaging modalities for posttreatment head and neck cancer,4 though MR imaging is sometimes performed in cases that are difficult to differentiate between recurrence and posttreatment changes. DWI is included in one of the MR imaging sequences, is used to visualize changes in microscopic water molecular motion, and is considered a surrogate marker of cell density.
Previous studies have shown that the ADC values of recurrent head and neck cancer lesions are lower than those of posttreatment changes.5⇓⇓⇓⇓⇓⇓⇓⇓-14 However, due to the small sample size of most previously published series, the utility of ADC to differentiate recurrent lesions from posttreatment changes after treatment of head and neck cancer has not been definitively summarized and established. Therefore, this systematic review and meta-analysis aimed to summarize the existing data and evaluate the utility of ADC in this application. Our secondary aim was to evaluate whether a threshold numeric value for ADC could be calculated for this differentiation.
MATERIALS AND METHODS
Study Selection
This study was performed in accordance with the Preferred Reporting Items for Systematic Reviews and Meta-Analyses (PRISMA) 2020 statement.15 MEDLINE via PubMed, Scopus, and EMBASE data bases were screened using the following search terms on July 7, 2021 without any date limits:
(“DWI” or “diffusion weighted imaging” or “diffusion-weighted imaging” or “ADC” or “apparent diffusion coefficient”) and (“head and neck” or “neck carcinoma” or “neck cancer” or “neck neoplasm” or “neck tumor”) and (“recurrence” or “recurrent” or “residual” or “posttreatment” or “post-treatment”) for MEDLINE and Scopus.
(“DWI” or “diffusion weighted imaging” or “ADC” or “apparent diffusion coefficient”) and (“head and neck” or “neck carcinoma” or “neck cancer” or “neck neoplasm” or “neck tumor”) and (“recurrence” or “recurrent” or “residual” or “posttreatment”) for EMBASE.
Inclusion criteria for this evaluation were as follows:
Prospective studies focused on local head and neck cancer recurrence
Data regarding the mean and SD of ADC derived from echo-planar DWI being available at least 3 months after treatment
Original studies that investigated findings in humans
Written in English.
The exclusion criteria were as follows:
Studies including lymph node recurrence/neck relapse
Studies involving malignant lymphoma or melanoma
The full-text unavailable
Studies with incomplete data
Review, case report, and systematic review/meta-analysis articles
Books and conference proceedings only, which lacked an associated a peer-reviewed full-fledged publication.
We searched the Cochrane data base and confirmed that there were no reviews/meta-analyses similar to the present research design.
Data Extraction
Two board-certified radiologists with 13 and 6 years of experience in neuroradiology reviewed the full text of the eligible studies and extracted the following information from the included studies by consensus. We collected the first author’s name, study location, publication year, study design, number of patients, age, sex, tumor subsite, pathology, treatment method, MR imaging device, Tesla strength, DWI sequence, DWI b-value, information about the ROI, MR imaging period from therapy, mean (SD) of ADC values of recurrence and posttreatment changes of head and neck cancer, and threshold ADC values. Any disagreements were resolved by another board-certified radiologist with 9 years of experience in neuroradiology.
Quality and Risk Assessment
The Newcastle-Ottawa scale was used to assess the quality of the included studies in accordance with the Cochrane Handbook for Systematic Reviews of Interventions for included nonrandomized studies.16,17 The scale rates the following 3 factors: selection (1–4 points), comparability (1–2 points), and exposure (1–3 points), with total scores ranging from 0 (lowest) to 9 (highest). Studies with scores of >6 were identified as high-quality choices.
Statistical Analyses
Forest plots were used to assess the mean differences and summarize them to describe the relationships between recurrence and posttreatment changes. Heterogeneity among the outcomes of included studies in this meta-analysis was evaluated using Cochrane Q test and the I2 statistic. Significant heterogeneity was indicated by a P < .05 in the Cochrane Q tests and a ratio of >50% in I2 statistics. We used random-effects models for calculation of the pooled mean difference for heterogeneous results. Publication bias was assessed using funnel plots. We calculated the cutoff value of the ADC value from data of the ADC mean in included studies between recurrence and posttreatment change using the Youden index from the receiver operating characteristic curve. A P value < .05 indicated statistical significance. All statistical analyses were performed using R statistical and computing software, Version 3.6.1 (http://www.r-project.org/).
RESULTS
Study Selection and Characteristics
Our initial search identified 906 records, and after we removed those that were duplicates and/or conference proceedings and book chapters, 405 remained (Fig 1). In the next screening, 152 non-English language reports, review articles, case reports, systematic review/meta-analyses, and nonhuman studies were excluded. After applying the selection criteria, we identified 6 articles with 365 patients (402 lesions) for the systematic review and meta-analysis.5,7,10,11,13,14 The extracted data from the 6 studies are outlined in the Table and the Online Supplemental Data.

The PRISMA 2020 flow chart for the article-selection process. After applying the selection criteria, we identified 6 articles for the systematic review and meta-analysis.
Characteristics of 6 studies
All were published between 2013 and 2019, with 4 and 2 studies coming from Asia and Europe, respectively. The studies had a median Newcastle-Ottawa scale score of 4 (range, 4−5). The 5 studies for which sex and age were available included 210 men and 53 women (male/female ratio = 4:1), with an age range of 49.5−63 years and a median age of 61 years. The primary tumor subsites in the studies included the nasopharynx, oropharynx, hypopharynx, larynx, oral cavity, sinonasal cavity, orbit, salivary gland, infratemporal fossa, and thyroid. The pathology of the primary tumors was mostly squamous cell carcinoma; however, 4 articles lacked further pathologic details. The treatment methods included in the 6 studies were radiation therapy, chemoradiotherapy, surgery, surgery + radiation therapy, and surgery + chemoradiotherapy.
The ROI was set by 2 radiologists in 3 studies, and the statistically tested interobserver agreement was 72.8%–81%. The ROI was analyzed by volume in 1 study and by the axial section in the other 5 studies. In 5 studies, the ROI was set by excluding the cystic/necrotic area. All the MRIs were obtained >3 months after completion of therapy. In the reference standard, histology was mostly used for the assessment of recurrent lesions, while posttreatment changes included more follow-up than recurrence. There were 208 recurrent lesions and 194 posttreatment changes in the 6 studies. Among all studies, the mean ADC values of recurrent lesions ranged from 0.93 to 1.20, with an overall mean of 1.03 × 10⁻³mm2/s, and the mean ADC of the posttreatment changes among all studies ranged from 1.17 to 1.82 × 10⁻³mm2/s with an overall mean of 1.51 × 10⁻³mm2/s. The extracted MR imaging data from the 6 studies are outlined in the Online Supplemental Data. Variable MR imaging vendors and models were used, and none were the same among the studies. A field strength of 1.5T was used in 3 studies, and 3T, in 3 studies. The high b‐values varied across studies and included at least 1000 or 800 s/mm2. The low b-values in 5 studies included 0 s/mm2, and there was no description of a low b-value in 1 study.
Meta-analysis
Six studies including 365 patients (402 lesions) provided data on the association of ADC values with recurrent disease and posttreatment changes after treatment for head and neck cancer. The forest plot (Fig 2) revealed that the ADC values of recurrence were significantly less than those of posttreatment changes in head and neck cancer (pooled mean difference: −0.45; 95% CI, −0.59–0.32; z = −6.42, P < .0001). The Cochrane Q test (χ2 = 37.3, P < .0001) and I2 test (I2 = 86.6%) revealed significant heterogeneity. The funnel plot identified 2 studies over the pseudo 95% CI (Fig 3).

Forest plot (association of ADC values between recurrence and posttreatment change). The ADC value of recurrence was significantly smaller than that of posttreatment changes in head and neck cancer.

Funnel plot (association of ADC value between recurrence and posttreatment change). The funnel plot identified 2 studies over the pseudo 95% CI.
ADC Value Threshold between Recurrence and Posttreatment Change in Head and Neck Cancer
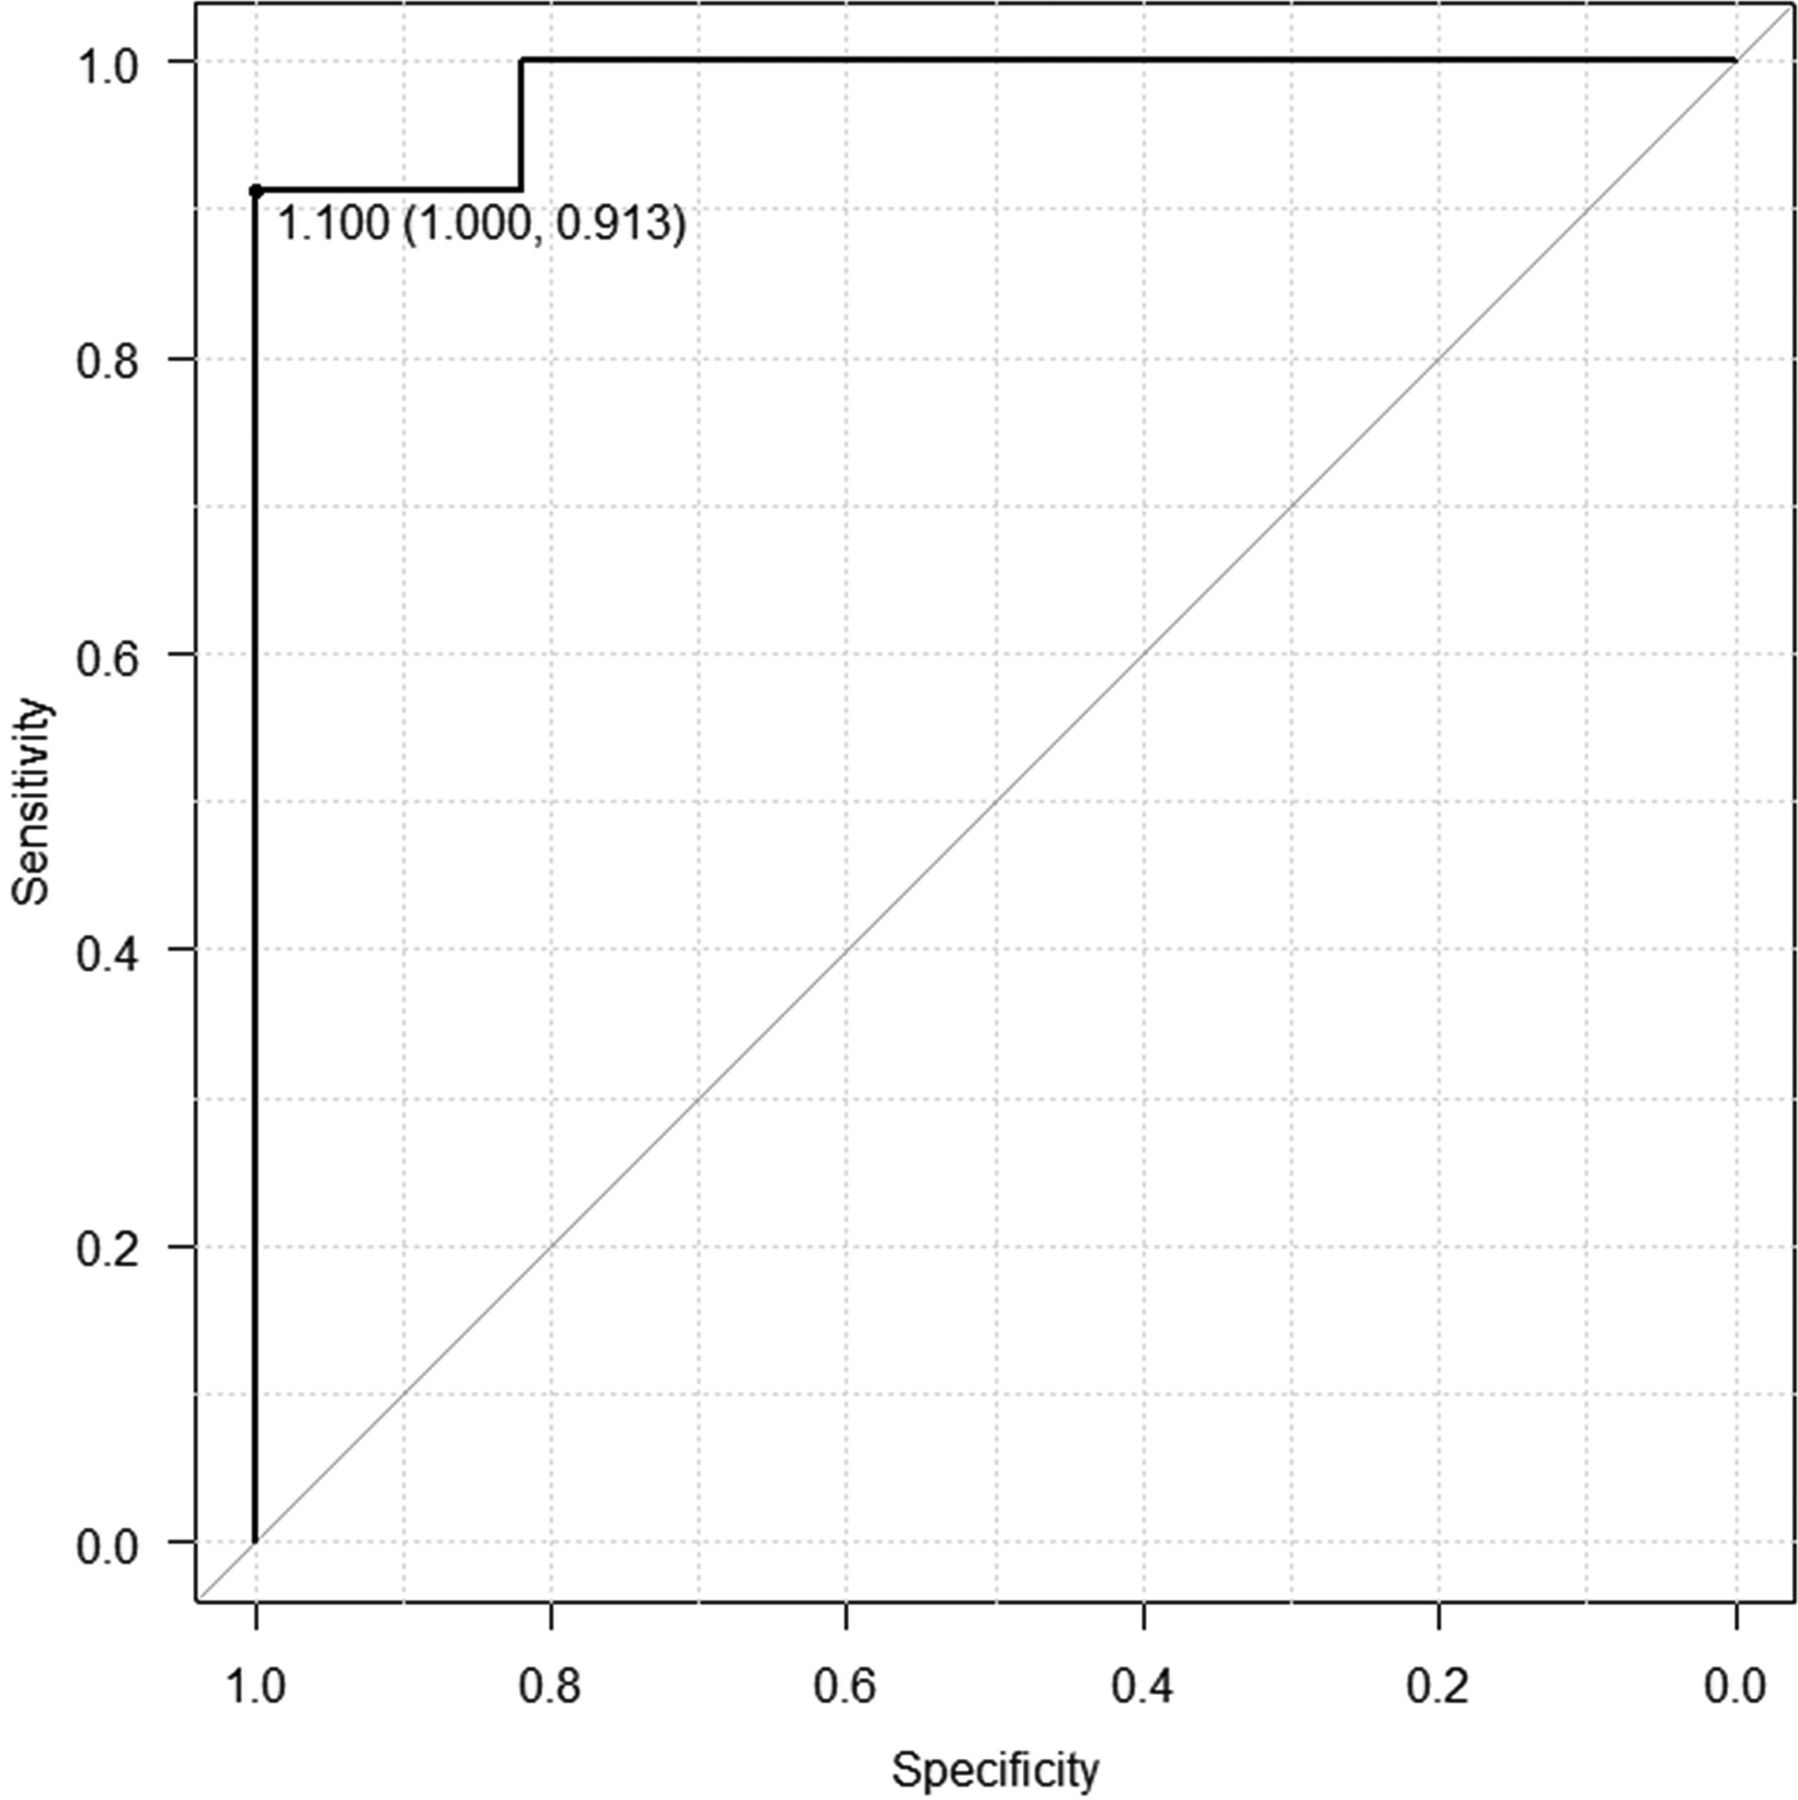
The threshold between recurrent lesions and posttreatment change in the 6 included studies ranged from 0.86 to 1.30, with a mean of 1.16 × 10⁻³mm2/s. The optimal threshold for the mean ADC value of recurrence and posttreatment change in the 6 studies was 1.10 × 10⁻³mm2/s, with sensitivity of 0.91, specificity of 1.00, and area under the curve of 0.98 by the receiver operating characteristic curve (Fig 4). The mean thresholds of the mean ADC in the studies using 1.5T and 3T scanners were 1.22 × 10⁻³mm2/s and 1.09 × 10⁻³mm2/s, respectively.

Receiver operating characteristic curve of the cutoff of ADC values between recurrence and posttreatment change.
DISCUSSION
We performed this systematic review and meta-analysis to investigate the diagnostic value of ADC values from MR images in differentiating recurrence from posttreatment changes in head and neck cancer. The results showed that recurrent lesions of head and neck cancer were associated with smaller ADC values compared with posttreatment changes. In addition, the threshold of ADC values between recurrent lesions and posttreatment changes was suggested to be 1.10 × 10⁻³mm2/s, which can be a useful tool for daily interpretations.
DWI shows the degree of water diffusion in the extracellular, intracellular, and intravascular spaces of a tumor. Most cancer lesions, including head and neck tumors, have a greater water diffusion restriction than normal tissues and benign structures, resulting in higher signal intensity on high-b-value images and lower signal intensity on ADC maps. Thus far, ADCs have been reported to differentiate among benign and malignant head and neck tumors,18,19 lymph node metastases, and benign lymph nodes,20⇓-22 to determine and predict the response to treatment of head and neck cancer23⇓-25 and to differentiate between recurrence and posttreatment changes,5⇓⇓⇓⇓⇓⇓⇓⇓-14 the main focus of this study.
CT, MR imaging, and [18F] FDG-PET/CT are the main diagnostic imaging modalities used during follow-up after treatment of head and neck cancer, primarily to detect recurrent lesions and differentiate them from posttreatment changes.4 Although there have been publications on imaging findings that can help distinguish posttreatment recurrence from posttreatment changes in head and neck cancer,1⇓-3 anatomic and radiologic modifications associated with treatment can sometimes make image interpretation difficult in clinical practice. CT is the standard imaging technique for follow-up evaluation in many institutions because of its better accessibility, ability to provide a broader imaging range, efficiency, and higher temporal sensitivity profile. However, this method tends to have lower sensitivity and specificity compared with [18F] FDG-PET.26 In addition, CT commonly depicts recurrent lesions as bulging soft-tissue-density masses, and because posttreatment changes sometimes mimic such findings, they are sometimes difficult to differentiate from one another. Although [18F] FDG-PET/CT has very high specificity and sensitivity in distinguishing lesions of recurrent head and neck cancer from posttreatment changes,27 it has several restrictions, including the high cost, institutional limitations, radiation exposure, and many false-positive and false-negative findings.
Although MR imaging is not an inexpensive diagnostic technique, it is widely available and has many advantages compared with other imaging techniques for anatomic assessment in the management of head and neck cancer. Therefore, the determination of recurrence and posttreatment changes by ADC has great clinical applicability, practicality, and potential importance. ADC is not only a valuable complement to [18F] FDG-PET, but it is also known to further enhance the diagnostic performance when combined with [18F] FDG-PET. Becker et al10 reported that DWI ADC and [18F] FDG-PET were fairly comparable as predictors of local recurrence of squamous cell carcinoma of the head and neck after radiotherapy and chemotherapy, and the diagnostic performance of combined FDG-PET and mean ADC (area under the curve, 0.939) was higher than that of the individual use of the mean standard uptake value (area under the curve, 0.846; cutoff value, 3.361) and ADC (area under the curve, 0.855; cutoff value, 1.208 × 10⁻³mm2/s), respectively.10
The Neck Imaging Reporting and Data System (NI-RADS) was recently introduced as a guideline for follow-up after head and neck cancer treatment. The American College of Radiology has proposed that the NI-RADS accurately reports radiologic assessment of recurrence or residual of head and neck cancer, which is evaluated by [18F] FDG-PET/CT or contrast-enhanced CT,4,28,29 and it has been reported that diagnostic accuracy is improved when qualitative MR imaging findings such as DWI and T2-weighted images are incorporated.30 Future studies are likely needed to evaluate the benefits of incorporating the quantitative ADC value into NI-RADS.
The data of one of the articles included in this study were analyzed by volumetry, while that in the others were analyzed by axial section. In radiology, more consistent and diverse approaches have become available to quantitatively assess biomarkers, with volumetry having become the mainstream of measurement for quantitative imaging research.31⇓⇓-34 To seek a more applicable ADC value, one must pursue more studies that use volumetric data.
This meta-analysis showed that the ADC values of recurrent lesions were lower than those of posttreatment changes. However, the Cochrane Q test and I2 test revealed significant heterogeneity for ADC values. Thus, while the random-effects model was used to analyze the overall effects, this heterogeneity may limit the value of the results of the current study. The optimal threshold considered in the receiver operating characteristic curve using the data of the mean ADC values in the 6 studies was identified as 1.10 × 10⁻³mm2/s, which is expected to be useful as a clinically required threshold for distinguishing between recurrent lesions and posttreatment changes in head and neck cancer.
There are several potential limitations in this study. The total number of patients is somewhat limited. The Newcastle-Ottawa scale scores of all studies were low. Furthermore, differences that exist among the included studies in the type of MR imaging vendor, model, field strength, b-value, and sequence settings may have impacted reported outcomes. In some studies, especially when using single-shot EPI DWI, ADC measurements in laryngeal or hypopharyngeal lesions with air or motion artifacts could be unreliable. In addition, subsites and stages of head and neck tumors, time between treatment and MR imaging, pathology, and reference standards varied among articles, possibly leading to heterogeneous results. Such heterogeneity across studies must be considered a potential limitation when assessing the significance of this analysis of differences in ADC values between recurrent tumors and posttreatment anatomic changes. Although we could not find any evidence suggesting that the differences in ADC values of cancer recurrence and posttreatment changes were influenced by treatment method, the heterogeneity of the treatment methods among the included studies might have affected ADC values.
Regarding other types of ADC analysis, Becker et al10 reported that not only the mean ADC but also the minimum ADC was significantly lower in the recurrence group compared with ADCs found in posttreatment changes in head and neck cancer. However, because this result was only reported by Becker et al, further studies are needed to determine the utility of the minimum ADC values. Although the random-effects model was used to address heterogeneity among studies, our conclusions should still be interpreted with caution. A properly designed, prospective, large-scale trial is required to validate the results of the current study.
CONCLUSIONS
This meta-analysis revealed that ADC values in recurrent head and neck cancers are lower than those seen in posttreatment changes. Therefore, the ADC value may have the potential to serve as a criterion to assist patients and physicians in selecting appropriate treatment strategies by differentiating recurrent lesions from posttreatment changes in the clinical follow-up of head and neck cancer. However, given the study limitations including the heterogeneity of the data, one should use caution in translating them into clinical practice. The results of this study need to be tested in an external cohort for further validation.
Acknowledgment
We gratefully acknowledge Mr Mark MacEachern (Taubman Health Sciences Library, University of Michigan), Dr Keiichiro Mori, Dr Takafumi Yanagisawa (Department of Urology, Medical University of Vienna), Mr Hisashi Kitagawa, and Mr Tomoki Natsuizaka (Department of Radiology, The Jikei University Hospital) for their advice.
Footnotes
Disclosure forms provided by the authors are available with the full text and PDF of this article at www.ajnr.org.
References
- Received October 11, 2021.
- Accepted after revision December 31, 2021.
- © 2022 by American Journal of Neuroradiology


Jump to section
Related Articles
Cited By...
- Performance of Neck Imaging Reporting and Data System (NI-RADS) for Diagnosis of Recurrence of Head and Neck Squamous Cell Carcinoma: A Systematic Review and Meta-analysis
- Dynamic Contrast-Enhanced MRI Parameters and Normalized ADC Values Could Aid Differentiation of Skull Base Osteomyelitis from Nasopharyngeal Cancer
- Normalized Parameters of Dynamic Contrast-Enhanced Perfusion MRI and DWI-ADC for Differentiation between Posttreatment Changes and Recurrence in Head and Neck Cancer