
Abstract
BACKGROUND AND PURPOSE: High-resolution MR imaging allows the identification of culprit symptomatic plaques after the administration of gadolinium. Current high-resolution MR imaging methods are limited by 2D multiplanar views and manual sampling of ROIs. We analyzed a new 3D method to objectively quantify gadolinium plaque enhancement.
MATERIALS AND METHODS: Patients with stroke due to intracranial atherosclerotic disease underwent 7T high-resolution MR imaging. 3D segmentations of the plaque and its parent vessel were generated. Signal intensity probes were automatically extended from the lumen into the plaque and the vessel wall to generate 3D enhancement color maps. Plaque gadolinium (Gd) uptake was quantified from 3D color maps as gadolinium uptake = (µPlaque T1 + Gd −µPlaque T1/SDPlaque T1). Additional metrics of enhancement such as enhancement ratio, variance, and plaque-versus-parent vessel enhancement were also calculated. Conventional 2D measures of enhancement were collected for comparison.
RESULTS: Thirty-six culprit and 44 nonculprit plaques from 36 patients were analyzed. Culprit plaques had higher gadolinium uptake than nonculprit plaques (P < .001). Gadolinium uptake was the most accurate metric for identifying culprit plaques (OR, 3.9; 95% CI 2.1–8.3). Gadolinium uptake was more sensitive (86% versus 70%) and specific (71% versus 68%) in identifying culprit plaques than conventional 2D measurements. A multivariate model, including gadolinium uptake and plaque burden, identified culprit plaques with an 83% sensitivity and 86% specificity.
CONCLUSIONS: The new 3D color map method of plaque-enhancement analysis is more accurate for identifying culprit plaques than conventional 2D methods. This new method generates a new set of metrics that could potentially be used to assess disease progression.
ABBREVIATIONS:
- Gd
- gadolinium
- HR
- high-resolution
- ICAD
- intracranial atherosclerotic disease
- IPH
- intraplaque hemorrhage
- PB
- plaque burden
- RI
- remodeling index
- SI
- signal intensity
Intracranial atherosclerotic disease (ICAD) can account for 10% of TIAs and 30%–50% of ischemic strokes.1 The main criterion for diagnosing and monitoring ICAD relies on luminal stenosis. More accurate methods of detecting the presence of atherosclerotic plaques and monitoring disease progression are needed. There is growing evidence that high-resolution MR imaging (HR-MR imaging) can be used to better characterize atherosclerotic plaques than current luminal imaging modalities. HR-MR imaging can be used to determine plaque burden (PB) and the remodeling index (RI) and detect plaque enhancement after the administration of gadolinium (Gd) contrast. Two meta-analyses of biomarkers of symptomatic ICAD have shown that plaque enhancement has the strongest association with the presence of culprit symptomatic plaques.2,3
Different biologic processes lead to plaque enhancement, including neovascularizaion, inflammation, and endothelial dysfunction. The analysis of atherosclerotic carotid plaques has shown a correlation between these histopathologic changes and plaque enhancement.4 Plaque enhancement is highly suggestive of an “active” plaque that might be symptomatic.5 Moreover, strong plaque enhancement suggests greater neovascularization and increased endothelial permeability. Hence, the exact quantification of plaque enhancement could potentially provide an insight into the biology of intracranial atherosclerosis, by detecting changes such as wall thickening and hemorrhage.6 Accurately quantifying plaque enhancement also has the potential of identifying ICAD mimics such as venous plexus contamination and thrombus recanalization, among others.7
Current analyses of plaque enhancement are based on 2D imaging sampling and manual determination of ROIs.8,9 This approach is limited by sampling errors and the plane of view chosen to draw the ROIs. We describe a new 3D method of plaque sampling that captures the entire plaque and parent artery. This method generates hundreds of data points to determine the level of plaque enhancement, overcoming the limitation of restricting the analysis to a specific plane of view that might not represent the enhancement of the entire plaque. We hypothesize that this new method of 3D plaque enhancement color mapping will lead to better identification of symptomatic atherosclerotic plaques.
MATERIALS AND METHODS
Image Acquisition
After approval from the institutional review board (University of Iowa) and obtaining informed consent, patients with stroke attributable to ICAD underwent 7T MR imaging. The ICAD stroke etiology was adjudicated on the basis of Trial of Org 10172 in Acute Stroke Treatment (TOAST) and ASCOD (A, atherosclerosis; S, small-vessel disease; C, cardiac pathology; O, other causes; and D, dissection) criteria.10,11 Patients were excluded if they had any contraindication to 7T MR imaging, were medically unstable, or had a glomerular filtration rate of <45 mL/min per 1.73 m2. Images were obtained between August 2018 and July 2021.
HR-MR imaging was acquired with a MR950 7T scanner (GE Healthcare) using an 8-channel head coil. 3D T1-weighted FSE (Cube; GE Healthcare) images were acquired both before and 5 minutes after the administration of Gd. Technical parameters for acquisition are described in the Online Supplemental Data. Images were analyzed in at least 3 planes to identify the presence of atherosclerotic plaques using the PACS. Plaque presence was defined as wall thickening of a vessel segment compared with the proximal and/or normal vessel segment.9 A senior investigator analyzed the following arterial segments in each subject to identify the presence of plaques: supraclinoid internal carotid arteries, MCAs, anterior cerebral arteries, V4 segments of the vertebral arteries, basilar artery, and posterior cerebral arteries. The specific stroke mechanism due to ICAD was also adjudicated by the senior investigator on the basis of previously described criteria.12 The Warfarin-Aspirin Symptomatic Intracranial Disease (WASID)-based degree of stenosis, RI, and the area degree of stenosis were manually calculated in several planes, as previously described.13-15 PB was calculated with the following formula: [(Area of the Vessel Wall at Maximal Stenosis – Area of the Lumen at Maximal Stenosis/Area of the Vessel Wall at Maximal Stenosis) × 100].15
Plaque Characterization
Plaques were detected by a senior investigator, and culprit status was adjudicated by 2 investigators with extensive experience in the analysis of plaques using HR-MR imaging. If there was disagreement, the senior investigator adjudicated the culprit status. Generally, a culprit plaque was defined as a lesion in the ipsilateral vascular territory of an area of infarction accompanied by clinical symptoms. If >1 plaque was present in the same vascular territory, the most stenotic lesion was selected for analysis. Areas of cerebral infarction related to the presence of culprit plaques were identified in DWI. Other plaques in the same vascular territory of culprit plaques were excluded from the analysis. Plaques located in other vascular territories were considered asymptomatic or nonculprit. Disagreements were resolved by consensus and after reviewing additional images and clinical data. The morphologic characteristics and enhancement patterns of culprit plaques were compared with those of nonculprit plaques. Additionally, the presence of intraplaque hemorrhage (IPH) was assessed by 2 investigators (S.S. and E.A.S.) by identifying T1 hyperintensity within the plaque.16
3D Plaque Analysis
We modified a previously described semiautomated method of analyzing Gd enhancement in the wall of brain aneurysms to study plaques and their parent arteries.17 Luminal segmentations in the vascular territory of the plaque were created manually using 3D Slicer (http://www.slicer.org) on T1 and T1 + Gd images.18 The diseased arterial segment containing the plaque was segmented at the plaque and extended approximately 5 mm beyond the plaque boundaries so that the plaque and the contiguous parent artery were included. Segmentations were performed by 2 investigators with at least 1 year of experience (S.S. and A.R.). In case of disagreement, the senior investigator adjudicated the proper parent vessel and plaque boundaries.
Signal intensity (SI) probes were orthogonally extended from the lumen into the plaque and arterial wall (Fig 1). The high spatial resolution of 7T imaging made it possible to accurately estimate the arterial wall and plaque thickness. For parent vessel analysis, SI probes were extended 0.5 mm into the arterial wall of the parent vessel, which is the average wall thickness used in our analysis and has been reported by others in ex vivo samples.19 For plaque analysis, the length of the probe was customized on the basis of detailed measurements of plaque thickness obtained on 7T MR images (Fig 2). SI color maps were generated through an automated process using image-processing tools and custom scripts in Matlab 2020b (MathWorks). The SI of the plaque and arterial wall was mapped from T1 and T1 + Gd images separately (Fig 3). The SI of the genu of the corpus callosum was used to obtain a normalized mean enhancement ratio. In addition, conventional 2D CRStalk was calculated for comparison.9

Generation of 3D enhancement maps. A, The SI sampled in high-resolution 7T MR imaging imaging is almost the same as that generated with 3D mapping: 1517 and 1502, respectively. B, SI probes (arrows) extend from the arterial lumen to the plaque and contiguous vessel wall. An average of 125 probes or data points were generated per plaque, and 858, per arterial segment. This technique makes it possible to generate a detailed color map of Gd enhancement.

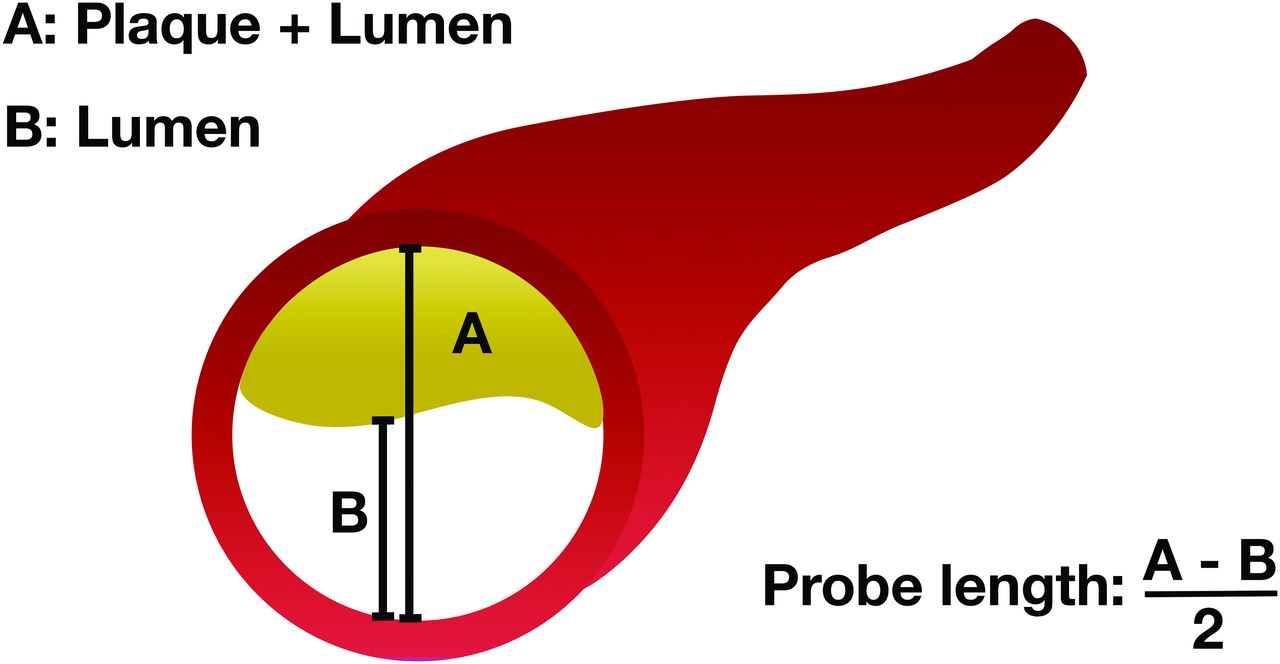
Schematic representation of how the SI probe length was determined. The plaque thickness was estimated using the sum of the diameter of the plaque and the lumen minus the diameter of the lumen, divided by 2. Measurements were obtained at the most stenotic segment. Thus, the probe did not extend beyond the plaque.

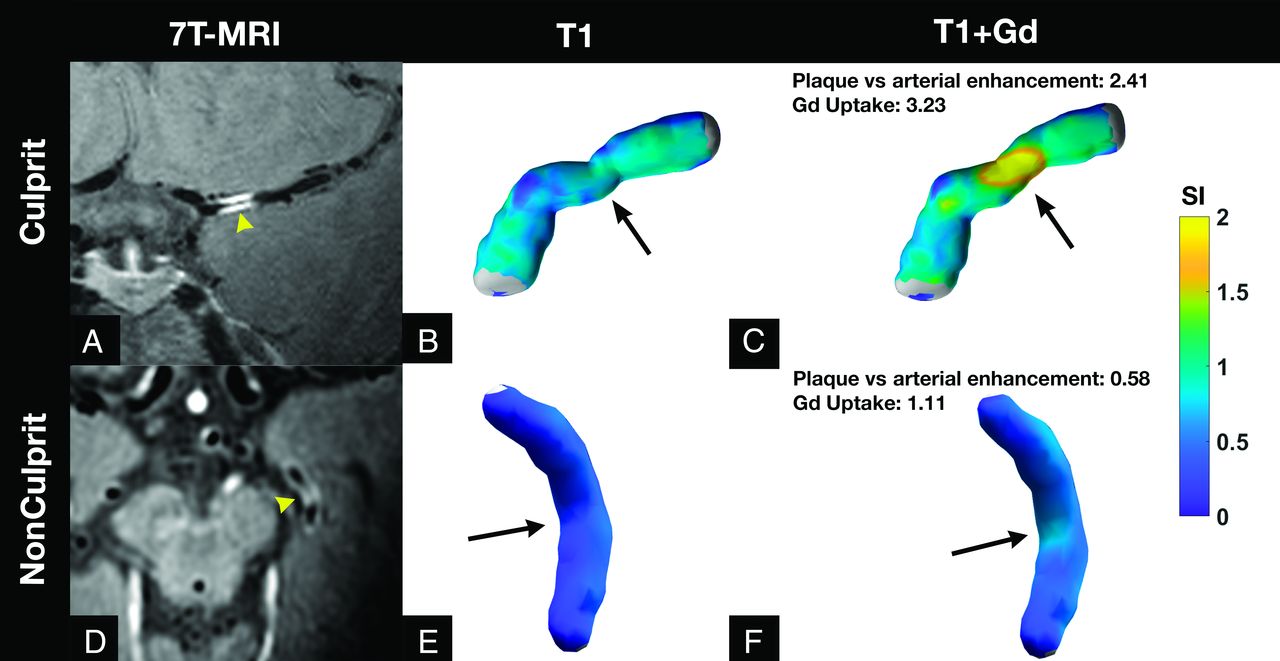
3D enhancement maps of culprit and nonculprit plaques. Upper row: A, A left MCA culprit plaque is seen in a 7T MR imaging coronal view (yellow arrowhead). The 3D reconstruction color maps of this MCA plaque in T1 (B) and T1 + Gd images (C) show a high concentration of plaque enhancement (black arrow). Lower row: D, A nonculprit area of enhancement is seen in the left posterior cerebral artery on 7T MR imaging (yellow arrowhead). The 3D color map is depicted in T1 (E) and T1 + Gd (F) images. D, On 7T MR imaging, this arterial segment appears highly enhancing (yellow arrowhead). F, However, the 3D color map does not show avid enhancement (black arrow). Moreover, this arterial segment has lower Gd uptake and plaque versus arterial enhancement than the culprit plaque.
3D Analysis of Plaque Enhancement
The highest SI of each probe on the T1 and T1 + Gd images was obtained for the analysis. The mean (µ) SI and SD of each plaque and parent artery were calculated. These values were then divided by the SI of the corpus callosum to obtain a normalized ratio that could be used to compare among subjects. We studied the following enhancement metrics:
1) Mean enhancement ratio = mean SI on T1 + Gd images normalized to the corpus callosum. This is the standard measurement of contrast enhancement.
2) Plaque enhancement variance = SD2 of the SI values measured by the probes on T1 + Gd images. This measurement was used to analyze the dispersion of enhancement within the plaque.
3) Gd-uptake, which measured the amount of Gd absorbed by the plaque compared with T1, using the following equation:

Previous studies have shown that culprit plaques had higher SDs in T1 images compared with nonculprit plaques.20 To account for this baseline variation, we decided to include SD as a normalization factor in our analysis.
4) Plaque versus arterial enhancement, which measured the difference in the mean enhancement of the plaque compared with the parent artery.

Because we analyzed plaques in different arteries, the SD of the arterial SI was used for normalization and to perform standardized comparisons of plaques in different territories.20
Statistical Analysis
Various statistical analyses were conducted using SPSS Statistics 27.0 (IBM). Interrater reliability in the identification of culprit plaques was calculated with a Cohen κ coefficient. Categoric variables are presented as frequency and percentage, and continuous variables are described as mean (SD). Shapiro-Wilk tests were used to evaluate normality for variables of interest within our sample, with P values of <.05 considered non-normally distributed variables. A Student t test was used to compare the means between normally distributed variables, and a Mann-Whitney U test was used to compare the distributions between non-normally distributed variables. χ2 tests were used to compare categoric variables. Univariate logistic regressions were performed to analyze relevant demographic, morphologic, and SI variables. An α threshold of .05 was used to assess significance for all hypothesis tests.
The multivariate model in this analysis was constructed through an Akaike information criterion–based forward selection procedure. All variables of interest in the data set were initially considered candidates for the multivariate model. The variable that reduced the Akaike information criterion of the model the most when added was included in the model. Other variables were included in the model only if they had a correlation of <0.5 with each variable that was already added to the model. Once there were no remaining variables that reduced the Akaike information criterion value of the multivariate model or had correlations of <0.5 with each variable present in the multivariate model, the algorithm was terminated, and the resulting model was selected.
Receiver operator characteristic metrics, including sensitivity and specificity, were calculated for each variable of interest (including the predictions output from the multivariable model) at its optimal threshold value, as determined by the Youden J statistic. Area under the curve values for each variable were also computed.
RESULTS
Patients and Plaque Characteristics
Thirty-six patients with a total of 80 plaques were included in the analysis. Approximately 47.2% were men, and the mean age was 59 (SD, 12) years. The mean NIHSS score at admission was 2.5 (SD, 3). Additional demographics are described in the Online Supplemental Data. Areas of cerebral infarction with DWI findings are reported in the Online Supplemental Data. The agreement in the identification of culprit plaques was high (κ = 0.8). Culprit plaques had a higher degree of stenosis, PB, and RI than nonculprit plaques. In addition, culprit plaques more frequently had a concentric morphology than nonculprit plaques (Table 1).
Plaque characteristics
3D Enhancement Characterization
A mean of 125 (SD, 79) probes per plaque were generated. Culprit plaques had a higher mean enhancement ratio than nonculprit plaques (µ = 0.80 [SD, 0.30] versus 0.61 [SD, 0.17]; P = .004). This enhancement was more heterogeneous in culprit plaques than in nonculprit plaques (SD2 = 0.33 [SD, 0.13] versus 0.26 [SD, 0.08]; P = .041). Culprit plaques with IPH were also more heterogeneous in T1 than culprit plaques without IPH (SDPlaque T1 = 0.20 ± 0.03 versus 0.15 ± 0.04; P = .03). Culprit plaques took up significantly more Gd than nonculprit plaques (2.01 [SD, 0.91] versus 1.06 [SD, 0.76]; P < .001) (Fig 3).
In univariate logistic regressions, several metrics were used to identify culprit plaques (Table 2). We used the following variables to generate a multivariate logistic regression model of culprit plaque identification: PB (OR, 3.7, 95% CI, 1.6–10; P = .004); Gd-uptake (OR, 2.3; 95% CI, 1.1–5.3; P = .033); and stenosis (OR, 1.3; 95% CI, 0.7–2.7; P = .4). The combined receiver operating characteristic analysis of this model had a sensitivity of 83% and a specificity of 86% (area under the curve = 0.87).
Univariate and multivariate logistic regression
The conventional 2D method to quantify plaque enhancement with a CRstalk of ≥0.56 had a sensitivity of 70% and a specificity of 68% in detecting culprit plaques (area under the curve = 0.68). In contrast, a Gd-uptake threshold of ≥1.23 had a sensitivity of 86% and a specificity of 71% (area under the curve = 0.81) in detecting culprit plaques with the new 3D method (Online Supplemental Data).
Parent Arteries of Culprit and Nonculprit Plaques
A mean of 858 (SD, 564) probes per arterial segment were generated. There was no statistical difference of enhancement between parent arteries of culprit and nonculprit plaques (µ = 0.59 [SD, 0.20] versus 0.62 [SD, 0.14]; P = .62).
DISCUSSION
Identifying symptomatic plaques will improve the diagnosis of ICAD as a stroke etiology and may guide targeted endovascular interventions such as angioplasty and stent placement.21 In this report, we describe a new method to quantify plaque enhancement, which generates 3D enhancement maps from hundreds of data points. Several enhancement metrics generated through this method enable detailed analysis of plaque and its parent artery enhancement. This new method was more accurate in detecting and quantifying plaque enhancement than the conventional 2D multiplanar method.
Gd uptake was the most accurate enhancement metric in detecting culprit plaques (OR, 3.9; 95% CI, 2.1–8.3). This metric quantifies the difference of enhancement between T1 and T1 + Gd images. It is similar to the “enhancement ratio,” which has been shown in other studies to be an independent identifier of stroke in patients with ICAD.22 One key difference is that Gd uptake accounts for the inherent heterogenicity of enhancement on T1 images. This metric analyzes plaques individually. Other metrics such as mean plaque enhancement ratio, plaque versus arterial enhancement, and plaque enhancement variance were also significant in detecting culprit plaques. This last parameter was also described by Shi et al20 as a strong identifier of culprit plaques. The signal dispersion detected in the analysis of histograms in their study was confirmed in our study. This heterogeneity in the distribution of enhancement can be seen in the 3D color maps of the plaque and parent vessel (Figs 1 and 3). Subtle color differences along the diseased arterial segment reflect different enhancement patterns, which ultimately suggest different biologic processes and stages of disease progression.6 IPH is a strong identifier of culprit plaques.16,20 The new method of plaque-enhancement analysis captured an increased SI dispersion in T1 due to IPH. Detailed quantification of plaque enhancement has the potential of identifying IPH and, in some instances, even determining the response to medical therapy.23
3D methods of vessel analysis have been used previously to visualize morphologic features such as vessel caliber and angulation.14 The analysis of vessel wall geometries has been shown to influence the effectiveness of endovascular interventions.21 Volumetric 3D maps of ICAD provide a more detailed characterization of PB, RI, and subtle differences in plaque morphology within different vascular territories. Qiao et al14 showed that posterior circulation arteries have a greater capacity for positive remodeling than anterior circulation arteries. Their 3D volumetric map made it possible to quantify the wall thickness and lumen area of the entire vessel segment. Similarly, our 3D analysis provides an objective survey of enhancement of the target arterial segment. Although our analysis is not focused on plaque geometry, it has the potential to generate vessel wall metrics that are not limited to plaque enhancement. Quantifying enhancement through 3D analysis allows easier identification of potential culprit plaques.
Identifying symptomatic plaques through HR-MR imaging could lead to the diagnosis of stroke etiology. Fakih et al9 reported that an analysis of a cryptogenic stroke cohort showed that approximately 73% of patients had an underlying atherosclerotic plaque that most likely was the cause of the stroke. A recent review showed that more than half of patients without significant luminal stenosis might have a culprit intracranial plaque identified on HR-MR imaging.24 Generating 3D enhancement color maps for detailed analysis of vessel segments could increase the detection of atherosclerotic changes in patients with cryptogenic stroke. In this study, we found that objectively quantifying Gd uptake combined with PB achieved a sensitivity of 83% and specificity of 86% in detecting culprit plaques. Moreover, when the new 3D method was compared with previous work that used 2D measurements of enhancement,9 it proved to be more sensitive and specific.
This was an exploratory pilot study testing a new method to quantify plaque enhancement; therefore, it has several limitations. First, a total of 80 plaques were analyzed, which is standard for 7T MR imaging studies. However, a larger study would be optimal for defining better thresholds of culprit plaque detection. Generating precise segmentations can be time-consuming and requires several quality checkpoints. Each plaque and vessel segmentation requires approximately 60 minutes. Future studies should focus on accurate automated segmentation to reduce the processing time. In some cases, our registration pipeline did not coregister T1 and T1 + Gd sequences well due to image distortion. T1 and T1 + Gd images were segmented individually, increasing the overall analysis time to limit this artifact. Processing time could be shortened if one segmentation is performed in coregistered T1 and T1 + Gd reconstructions. Co-registration may be better implemented using 3T HR-MR imaging, which has fewer challenges for image registration than 7T HR-MR imaging. Once segmentation processing has been completed, generating 3D color maps is automatic and the quantification of plaque enhancement is highly reliable (Fig 1). A second limitation is that although the software was engineered for plaque-enhancement quantification, other metrics such as PB, RI, and area of stenosis were obtained manually from source images.
CONCLUSIONS
Detecting and quantifying plaque enhancement through 3D color maps are promising for characterizing ICAD. This new method is more accurate than current methods that rely on 2D multiplanar analysis.
Footnotes
This study was funded by a Pilot Research Grant from the Society of Vascular and Interventional Neurology granted to Dr Edgar Samaniego. Statistical analysis for this study was supported by the Clinical and Translational Science Award Grant funded from the National Institutes of Health (UL1TR002537). Image and data acquisition was performed using an MR imaging instrument funded by 1S10RR028821-01.
Disclosure forms provided by the authors are available with the full text and PDF of this article at www.ajnr.org.
Indicates open access to non-subscribers at www.ajnr.org
References
- Received January 27, 2022.
- Accepted after revision June 24, 2022.
- © 2022 by American Journal of Neuroradiology


