
Abstract
BACKGROUND AND PURPOSE: Anecdotally, postcontrast FLAIR images of vestibular schwannomas can show peritumoral hyperintense signal, hypothesized to represent gadolinium extravasation. This study assessed the incidence of this phenomenon in a cohort of patients with treatment-naïve sporadic vestibular schwannomas.
MATERIALS AND METHODS: A retrospective review of 20 patients with presumed vestibular schwannoma based on characteristic imaging findings and with dedicated internal auditory canal imaging, including postcontrast T1W1 and postcontrast FLAIR, was performed. Tumor size and location were recorded, as was the presence or absence of a fundal fluid cleft. Images were reviewed for the presence of peritumoral hyperintense signal on FLAIR images (a “halo”) and for both subjectively and objectively elevated signal in the ipsilateral cochlea and fundus.
RESULTS: Patients were randomly selected from an institutional vestibular schwannoma registry. Eleven (55.0%) were women. A peritumoral halo was present in 90% of patients, averaging 1.0 (SD, 0.2) mm in thickness. The maximum mean FLAIR signal in the ipsilateral fundus (205.9 [SD, 110.2]) was significantly greater than on the contralateral side (121.6 [SD, 27.8]) (P = .02). Maximum mean ipsilateral intracochlear signal (167.8 [SD, 104.5]) was also significantly greater than on the contralateral side (113.4 [SD, 40.1]) (P = .04).
CONCLUSIONS: A peritumoral halo on postcontrast FLAIR images was present in 90% of our cohort with randomly selected, treatment-naïve sporadic vestibular schwannomas. Although its mechanism is unknown, this signal is hypothesized to represent gadolinium extravasation, given an ipsilateral increased signal in the adjacent internal auditory canal fundus and cochlea.
ABBREVIATIONS:
- CPA
- cerebellopontine angle
- IAC
- internal auditory canal
- VS
- vestibular schwannoma
Vestibular schwannomas (VSs) are benign nerve sheath neoplasms that account for approximately 80% of cerebellopontine angle (CPA) tumors in adults.1 The lifetime prevalence of developing a VS is 1 in 500.2 Even small tumors may lead to ipsilateral nonfunctional hearing and tinnitus, while medium and large-sized vestibular schwannomas may result in additional symptoms such as trigeminal neuropathy or neuralgia or brainstem compression with attendant hydrocephalus.3 VSs that grow with time have been shown to exhibit higher levels of intratumoral inflammation.4 Although physical compression from a growing tumor adequately explains the mechanism of trigeminal symptoms and noncommunicating hydrocephalus, even very small tumors that do not fill the cross-diameter of the internal auditory canal (IAC) (ie, do not compress the cochlear nerve) are often associated with progressive sensorineural hearing loss. Moreover, many studies indicate that the degree of hearing loss is poorly associated with tumor size at diagnosis,5 and progressive hearing loss is expected to occur even in tumors that do not exhibit growth.6
The imaging appearance of VSs has been extensively reported. In general, the tumors tend to extend from the IAC into the CPA, often with an “ice cream cone” configuration.7 VSs typically demonstrate homogeneous tumoral enhancement, though 5%–15% may have intratumoral cystic changes.8 Intratumoral hemorrhage, too, may be present; one study found microhemorrhages on T2*-weighted imaging in >90% of tumors.9 Compressive edema of the brachium pontis, cerebellum, and/or brainstem is observed in 5% of cases.10 In the past decade, there has been growing interest in changes of fundal fluid and labyrinthine fluid signal in association with vestibular schwannomas.11 Previous studies have demonstrated that increased FLAIR signal and decreased T2 signal occur in many cases and correlate with the development of progressive hearing loss.12 There are also studies examining early and delayed gadolinium signal in the fundus and labyrinth.13 The mechanisms behind this phenomenon remain unknown but may include buildup of endogenous proteins and metabolites (“biologic pollution”) from trapped CSF, increased permeability of the blood-labyrinthine barrier, activation of an inflammatory cascade, and/or tumor “shedding” or “leaking.”
Anecdotally, peritumoral signal has been observed around VSs on postcontrast 3D FLAIR imaging. The incidence and characterization of this finding have not yet been assessed in a systematic study, however, and the mechanism for this finding also remains unexplored. This study sought to further define this radiologic finding by evaluating peritumoral FLAIR signal in a cohort of patients with treatment-naïve sporadic vestibular schwannomas.
MATERIALS AND METHODS
Patient Selection
This study was performed following approval by the local institutional review board. A retrospective radiologic review was completed of a random sample of 20 patients diagnosed with a presumed vestibular schwannoma (based on imaging findings). The size of the patient cohort (n = 20) was chosen as a number deemed sufficient to achieve the goal of this study: to confirm anecdotal evidence of the presence of peritumoral post-FLAIR signal in patients with treatment-naïve VSs to establish it as a potential biomarker for future study. Neither the size nor the appearance of VSs was used as an inclusion criterion for the studied cohort.
All patients underwent dedicated IAC MR imaging between October 11, 2017, and November 23, 2021. No examinations required exclusion for artifacts such as motion. In addition, to assess precontrast FLAIR images in the same patient cohort, we completed a review of MR imaging performed before the included study with precontrast FLAIR images performed through the IAC. As noted in the results, precontrast FLAIR images were available for evaluation in 16/20 patients. Demographic information was assessed using a review of the electronic medical record.
MR Imaging Parameters
A 3T Siemens scanner (Magnetom Prisma) with multichannel phased array coils was used to image all patients (with either a 32- or a 64-channel head coil). Dedicated IAC imaging was performed using axial 3D T1 sampling perfection with application-optimized contrasts by using different flip angle evolution (SPACE sequence; Siemens) (TR = 600 ms, TE = 32 ms, data matrix = 192 × 192, acquisition time = 4 minutes 0 second), axial 3D T2 SPACE (TR = 1300 ms, TE = 184 ms, data matrix = 320 × 320, acquisition time = 3 minutes 55 seconds), axial 3D fat-saturated postcontrast T1 SPACE (TR = 600 ms, TE = 32 ms, data matrix = 192 × 192, acquisition time = 4 minutes 0 second), and axial 3D postcontrast FLAIR (TR = 5000 ms, TE = 379 ms, data matrix = 192 × 192, acquisition time = 4 minutes 29 seconds). The FOV for each sequence was 150 mm.
Imaging Review
A blinded retrospective review was performed by 2 Certificate of Added Qualification–certified neuroradiologists (J.C.B., J.I.L.). All VSs were evaluated for laterality, location, and size. Location was categorized as being completely within the IAC, completely in the CPA, or in both the IAC and CPA. Size was based on the largest single axial dimension. For VSs located in both the IAC and CPA, only the largest dimension of the CPA component was measured, in accordance with reporting guidelines.14 Fundal cleft size was assessed by measuring between the lateral-most aspect of the VS and the IAC fundus. Obstruction of the fundus from the remainder of the IAC and/or CPA by the VS was assessed using axial T2 SPACE images; obstruction was defined as a region of complete occlusion of the IAC by the tumor.
The presence or absence of peritumoral signal on FLAIR images (here referred to as the peritumoral “halo”) was assessed by fusing and overlaying axial postcontrast FLAIR images with both axial fat-saturated postcontrast T1W1 and axial T2 SPACE images using the institutional PACS system. The difference in tumor size between these images was used to measure the thickness of the halo, if present. Image subtraction was also used to better define the differences between both the tumor margins and the halo. Only 1 MR imaging examination was assessed per patient; changes across serial examinations were not evaluated as part of this study.
In addition, the maximum signal intensity of specified areas was measured on postcontrast FLAIR images: the ipsilateral fundus (if a cleft was present) and the ipsilateral cochlea. Free-form ROIs were used for each measurement to precisely outline these anatomic structures. The contralateral fundus and cochlea were also measured to provide internal reference. The ipsilateral and contralateral signal intensities were compared using the statistical methods outlined below. Each measurement was obtained using our institution’s PACS system.
Any interobserver disagreements regarding the presence or absence of a halo or abnormal signal in the fundus were resolved by consensus. For the measured thickness of the halo, the average measurement between observers was used.
Statistical Analyses
Means and SDs were calculated for all continuous variables. Statistical calculations were performed using BlueSky Statistics software (https://www.blueskystatistics.com/). The Student t test was used to calculate statistical differences among continuous variables. The Cohen κ was used to calculate interobserver agreement with categoric variables, and Bland-Altman plots were used to calculate interobserver agreement with continuous variables. The threshold for statistical significance was set at P < .05.
RESULTS
Twenty patients were included; 11/20 (55.0%) were women, and the average age was 69.5 years (SD, 10.2). Eleven VSs (55.0%) were located on the right; 16/20 tumors (80.0%) were located entirely within the IAC, while 4 exhibited CPA extension of the tumor. None of the observed VSs were isolated to the CPA. The average size of all tumors was 5.8 (SD, 3.1) mm (Table). A fundal cleft was present in 16 patients (80.0%). The average size of the fundal cleft, when present, was 2.3 (SD, 1.8) mm. Of the patients with a fundal cleft, the VS obstructed the fundus in 5 patients (38.5%). In patients with a nonobstructed fundus, the tumor was either smaller than the diameter of the IAC or the tumor was centered along one wall of the IAC with a patent CSF cleft on the other side.
Sizes and incidence of multiple imaging findings
Hyperintense peritumoral signal (halo) was present on postcontrast FLAIR images in 90% of patients. In general, the observed halo was nonuniform in thickness around the circumference of the tumors (Fig 1). The halo itself was difficult to confirm as being outside the tumor borders without the use of overlay/fused images in the PACS system. The average maximum thickness of the halo in the axial plane was 1.0 (SD, 0.2) mm. Interobserver agreement regarding the presence or absence of a halo was nearly perfect (κ = 0.95), while the interobserver correlation coefficient of the halo thickness was 0.38.

Example of a peritumoral halo on postcontrast FLAIR images. Postcontrast fat-saturated T1-weighted image (A) demonstrates a vestibular schwannoma extending from the right IAC into the CPA. Postcontrast FLAIR image (B) shows a discontinuous peritumoral hyperintense halo that extends beyond the tumor margins on postcontrast T1-weighted images (arrows). Corresponding subtraction FLAIR image (C) confirms the presence of a halo (arrows).
Regarding the 2 tumors that lacked a halo, one was 14 mm and the other was 8 mm. The 14-mm tumor lacked a fundal cleft, potentially affecting the ability to visualize a peritumoral halo. Both fusion and subtraction on the 8-mm tumor were somewhat difficult, possibly affecting the ability to visualize a halo in that lesion.
Sixteen patients had prior MR imaging with precontrast FLAIR imaging of the IAC available for review (the average time between prior and current MR imaging was 62.9 [SD, 24.6] months). None of these studies (0%) showed abnormal peritumoral signal on precontrast FLAIR images.
Of patients with a fundal cleft, hyperintense signal was observed in the fundus on postcontrast FLAIR images in 13 of 16 (82.3%). Ten of those 13 patients had tumoral obstruction of the fundus. Interobserver agreement for observation of a fundal cleft signal was moderate (κ = 0.46). On average, the maximum signal in the ipsilateral fundus on postcontrast FLAIR images was 205.9 (SD, 110.2), which was significantly greater than the average signal in the contralateral fundus (121.6 [SD, 27.8]) (P = .02).
Pathologically increased FLAIR signal was subjectively observed in the ipsilateral cochleae structures in 10 patients (50.0%) (Fig 2). Of those 10 patients, the fundal cleft was obstructed in 6. On postcontrast FLAIR images, the mean measured maximum intracochlear signal (167.8 [SD, 104.5]), on average, was greater than contralateral cochlear signal (113.4 [SD, 40.1]) (P = .04).

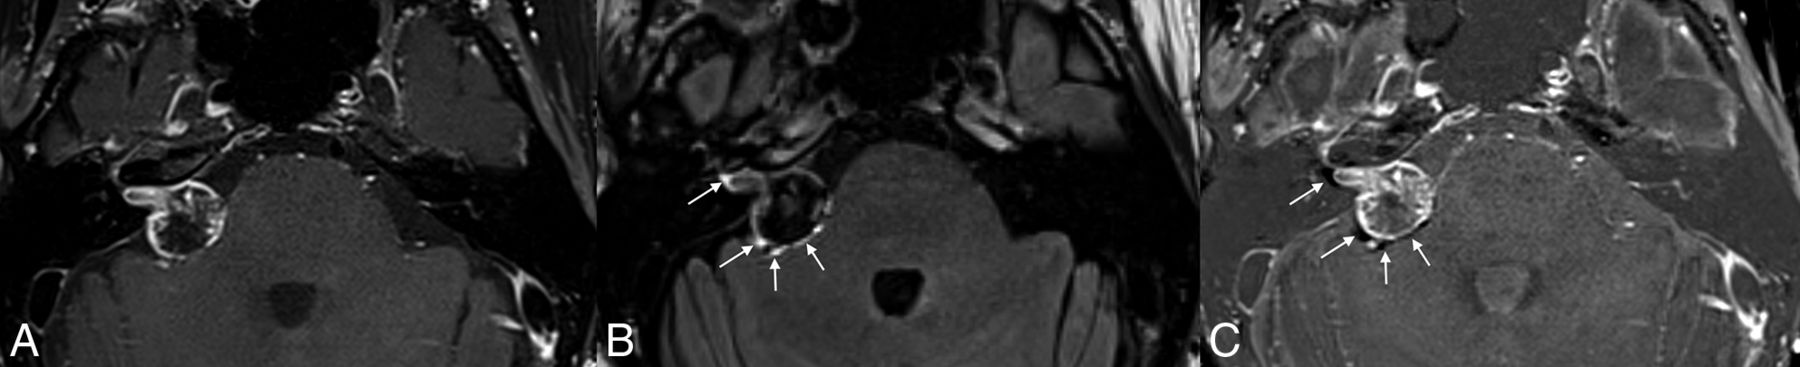
Multiple findings of possible gadolinium leakage from a vestibular schwannoma. Fused axial T2 SPACE and postcontrast T2 FLAIR image (A) shows a vestibular schwannoma centered in the left porus acusticus with a peritumoral halo (arrows) that extends past the solid tumor borders. Hyperintense signal was observed in the ipsilateral IAC fundus and asymmetrically elevated signal in the ipsilateral cochlea on the postcontrast T2 FLAIR image (B). Noncontrast FLAIR image on a prior study (C) does not show abnormal peritumoral signal, indicating that this finding should not represent peritumoral edema.
DISCUSSION
This study assessed the incidence of peritumoral signal on postcontrast FLAIR images in a cohort of patients with vestibular schwannoma. We found that a previously undescribed peritumoral halo was observed in a high proportion of cases, typically measuring about 1 mm in maximum thickness. This halo is difficult to detect without the use of coregistered/fused images or image subtraction. Asymmetrically elevated postcontrast FLAIR signal was also present in both the fundus and ipsilateral cochlea, confirming the findings of prior studies.
The most logical explanation for the observed findings is that the hyperintense halo represents extratumoral leakage of gadolinium, because it was not demonstrated on any precontrast FLAIR images. The presence of halos on postcontrast FLAIR images, but not postcontrast T1WI, could be due to ≥1 factor. It is possible that leakage is better visualized on FLAIR images because of superior sensitivity to the T1-shortening effect of gadolinium.15,16 It is also possible that the FLAIR images better depicted gadolinium leakage because they were acquired later in the imaging protocol, allowing interval leaching of contrast into the peritumoral space.
Because the halos were nonuniform in appearance and not circumferential peritumoral rings, we hypothesize that the early gadolinium leakage becomes trapped in a peritumoral space created by the enveloping arachnoid or within cysts and/or adhesions. As seen during microsurgical tumor dissection, VSs are surrounded by a thin, irregular, arachnoid layer that is variably adherent to the tumor surface. Additionally, peritumoral cysts have been well-documented previously,17 and vestibular schwannomas specifically are known to exist in an inflammatory microenvironment.18 Thus gadolinium may have become caught in the veil of the peritumoral arachnoid or peritumoral cysts before leaking further into the adjacent CSF. Elevated signal in the ipsilateral fundus and cochlea suggests that additional leakage does occur, possibly in a more diluted manner than the halo effect.
It is not clear why the leaked contrast seems to be locally transported and/or resorbed in the ipsilateral cochlea, even in cases in which the IAC is not occluded. It is possible that even partial occlusion of the IAC (or underlying anatomic constraints of the IAC structure) leads to somewhat stagnant flow of leaked gadolinium into the adjacent CSF, which then, preferentially, is concentrated in the adjacent cochlea rather than diffusing more broadly into the CSF. Altogether, the precise pathophysiology of the observed findings is likely even more complex than what we have outlined, and it is possible that the halo sign is not specific to VS. Further studies using larger cohorts and a greater variety of tumors should help to develop a more comprehensive model.
The concept of VS contrast extravasation is not new. VSs have previously been hypothesized to leak gadolinium into the adjacent structures, most notably the ipsilateral cochlea. Yamazaki et al,19 for example, found that ipsilateral cochleae have higher signal intensity on postcontrast FLAIR. In that study, the authors demonstrated a convincing increase in intracochlear signal intensity on postcontrast FLAIR images compared with precontrast images, and gadolinium leakage into the IAC fundus. This increased ipsilateral cochlear signal on postcontrast FLAIR signal has been assessed elsewhere.20 The authors contended that the intracochlear signal was suggestive of increased permeability of the blood-labyrinthine barrier in the setting of a VS.19 Most interesting, Fig 3 in the article of Yamazaki et al also seems to show a peritumoral halo on postcontrast FLAIR images, though neither fused nor subtraction images were shown. The finding was not discussed by the authors.
Pathologically elevated signal is known to be present in the ipsilateral cochlea of patients with VSs on precontrast FLAIR imaging. Unlike the cochlear enhancement observed by Yamazaki et al,19 this intrinsic T2/FLAIR hyperintensity in the cochlea is attributed to elevated well-documented protein in the perilymph.21,22 Historically, labyrinthine taps to test for proteinaceous fluid were used as a diagnostic test for VSs.23 Although the cause of increased perilymphatic protein remains unknown, the mechanism favored by many authors is the blockage of neuroaxonal protein transportation, related to compression of the vestibulocochlear nerve.21
Conceivably, the detection of elevated protein seen on FLAIR and gadolinium in the fundus and labyrinth may be related to the tumor obstructing the IAC and creating a relatively stagnant small reservoir of CSF. In this setting, low levels of leached protein or contrast from the tumor may accumulate to sufficient levels to be detected. This possibility may explain the relative gradient seen in FLAIR and gadolinium, with higher concentrations often occurring in the fundus adjacent to the tumor compared with the labyrinth. In contrast, any tumor or contrast leaked medially into the relatively large CPA cistern will naturally dilute and recirculate in the ∼125 mL of CSF in the remaining subarachnoid space, which turns over approximately 3 times daily. Prior literature has identified elevated levels of circulating CSF protein in individuals with small vestibular schwannomas and associated communicating hydrocephalus, implicating protein sludging as a mechanism for reduced CSF resorption.24
Finally, a very recent publication proposed that peritumoral “rim” enhancement on FLAIR could help differentiate meningiomas from malignant dural-based tumors.25 The rim of peritumoral contrast shown in that study is very similar to the halo we describe in the current findings. The authors of that study opined that the observed findings were due to the dual blood supply (meningeal and pial) of meningiomas. This supply led to relative intratumoral signal loss on FLAIR (due to T2 shortening in the setting of high gadolinium concentrations) and relatively hyperintense signal in the pial-supplied tumor capsule. The results of the current study, however, seem to refute the findings of this recent publication. Most important, vestibular schwannomas are nonencapsulated tumors and do not have a dual blood supply.26 Also, as previously stated, the halos observed in the current study are irregular and do not appear to conform to a smooth capsule. Last, enhancement of a tumor capsule would not explain the more diffuse gradient that seems to occur in our cohort, in which gadolinium appears to accumulate in the fundus and cochlea. Together, we believe that these findings are evidence of gadolinium leakage, as stated above.
The results of this current study leave many questions unanswered, and future studies will be needed for further exploration. For example, the incidence and/or appearance of peritumoral halos may vary among patients with sporadic VSs compared with VSs related to neurofibromatosis type 2, or in untreated-versus-treated tumors. It may also be useful to determine whether the presence of a peritumoral halo predicts the stability or growth of a tumor. At present, these topics are outside of the scope of the current study.
This study has several limitations, including being a retrospective review. The goal of defining the radiologic finding of a peritumoral halo is somewhat limited in scope, and the results of this study are preliminary and based on a small cohort. Additional studies using large sample sizes will be needed to confirm these findings, as well as to assess the clinical relevance. In addition, many of the VSs analyzed in this study were relatively small. Future studies will also be needed to address whether tumor size has an impact on the thickness and/or appearance of a peritumoral halo. Also, the precontrast FLAIR images that were available for review were part of separate MR imaging examinations. Thus, no precontrast FLAIR imaging was available for direct comparison with postcontrast FLAIR in this study. Finally, the proposed mechanisms for the observed peritumoral halo are hypothetical and based on limited prior studies. It is possible that the peritumoral signal on postcontrast FLAIR images simply represents an imaging artifact. Also, because the average halo thickness was around 1 mm, the precision of the reported measurements may be questionable, given the pixel size on standard PACS calipers.
CONCLUSIONS
A peritumoral halo on postcontrast FLAIR images was observed in nearly all vestibular schwannomas in our cohort of 20 patients, usually measuring about 1 mm in thickness. Although the pathophysiologic mechanism of this finding is uncertain, we hypothesize that this halo may represent local leakage of gadolinium into the peritumoral space.
Footnotes
Disclosure forms provided by the authors are available with the full text and PDF of this article at www.ajnr.org.
References
- Received May 15, 2023.
- Accepted after revision August 3, 2023.
- © 2023 by American Journal of Neuroradiology


Jump to section
Related Articles
Cited By...
- Vestibular Schwannoma-Related Increased Labyrinthine Postgadolinium 3D-FLAIR Signal Intensity and Association with Hearing Impairment
- The "Outline Sign": Thin Hyperenhancing Perimeter as an MR Imaging Feature of Meningioma. A Useful Tool in the Temporal Bone Region for Differentiating Meningiomas from Schwannomas and Paragangliomas
- Imaging Findings Post-Stereotactic Radiosurgery for Vestibular Schwannoma: A Primer for the Radiologist