
Abstract
BACKGROUND AND PURPOSE: Superagers are defined as older adults with episodic memory performance similar or superior to that in middle-aged adults. This study aimed to investigate the key differences in discriminative networks and their main nodes between superagers and cognitively average elderly controls. In addition, we sought to explore differences in sensitivity in detecting these functional activities across the networks at 3T and 7T MR imaging fields.
MATERIALS AND METHODS: Fifty-five subjects 80 years of age or older were screened using a detailed neuropsychological protocol, and 31 participants, comprising 14 superagers and 17 cognitively average elderly controls, were included for analysis. Participants underwent resting-state-fMRI at 3T and 7T MR imaging. A prediction classification algorithm using a penalized regression model on the measurements of the network was used to calculate the probabilities of a healthy older adult being a superager. Additionally, ORs quantified the influence of each node across preselected networks.
RESULTS: The key networks that differentiated superagers and elderly controls were the default mode, salience, and language networks. The most discriminative nodes (ORs > 1) in superagers encompassed areas in the precuneus posterior cingulate cortex, prefrontal cortex, temporoparietal junction, temporal pole, extrastriate superior cortex, and insula. The prediction classification model for being a superager showed better performance using the 7T compared with 3T resting-state-fMRI data set.
CONCLUSIONS: Our findings suggest that the functional connectivity in the default mode, salience, and language networks can provide potential imaging biomarkers for predicting superagers. The 7T field holds promise for the most appropriate study setting to accurately detect the functional connectivity patterns in superagers.
ABBREVIATIONS:
- ASSET
- array spatial sensitivity encoding technique
- BOLD
- blood oxygen level–dependent
- DMN
- default mode network
- ECN-L
- executive control network left
- ECN-R
- executive control network right
- EN
- elastic net
- ICA
- independent component analysis
- IPAT
- integrated parallel acquisition technique
- rs-fMRI
- resting-state fMRI
- OLS
- ordinary least squares
- SN
- salience network
Aging is an increasingly global phenomenon, usually accompanied by cognitive decline, with direct implications for the health care system and individuals’ lives.1 In this setting, subjects with superior memory performance in late life (80 years of age or older) stand out because they have a model capable of clarifying the brain mechanisms underlying cognitive resilience. These subjects have been identified as “superagers” in the literature.2 To date, it is known that superagers show selective cortical preservation in particular regions of the default mode network (DMN) and salience network (SN), overlapped by stronger functional connectivity, highlighting possible key hubs for memory and cognition.3⇓-5 However, these studies included subjects from 60 years of age, which may be biased to obtain meaningful assertions about “youthful” memory performance in late life (80 years of age and older).6
Cognitive maintenance in older adults may reflect intrinsic functional integrity as a neurobiologic substrate.7 fMRI can play an important role in detecting key brain hubs sustaining youthful cognition, thereby contributing to understanding the most resilient brain areas in superagers. Moreover, alterations in the brain functional connectome were previously reported to provide biomarkers for age-related cognitive decline and Alzheimer disease.8
Resting-state fMRI (rs-fMRI) focuses on the temporal characteristics and spatial organization of spontaneous fluctuations of the blood oxygen level–dependent (BOLD) signal and is powerful for characterizing brain organization and its abnormalities. Because the discrepancies between superagers and cognitively average elderly controls may be modest-but-important to detect early changes in brain function, using an ultra-high-field rs-fMRI with increased spatial and temporal resolution may allow study of more subtle disruption.9 This is the first time that older adults with superior memory performance have been investigated at a 7T field.
In this study, we compared the differences in the resting-state functional connectivity between superagers and cognitively average elderly controls (elderly controls) in a range of neural networks with the aim of identifying the most discriminative networks and within-network nodes for predicting superagers. We additionally examined differences in the prediction probability of being a superager between the rs-fMRI data at 3T and 7T magnetic fields. We hypothesized that hub regions are critical to predicting youthful cognitive function in superagers, and the measurements of functional connectivity would be improved at a higher magnetic field.
MATERIALS AND METHODS
Selection of Participants
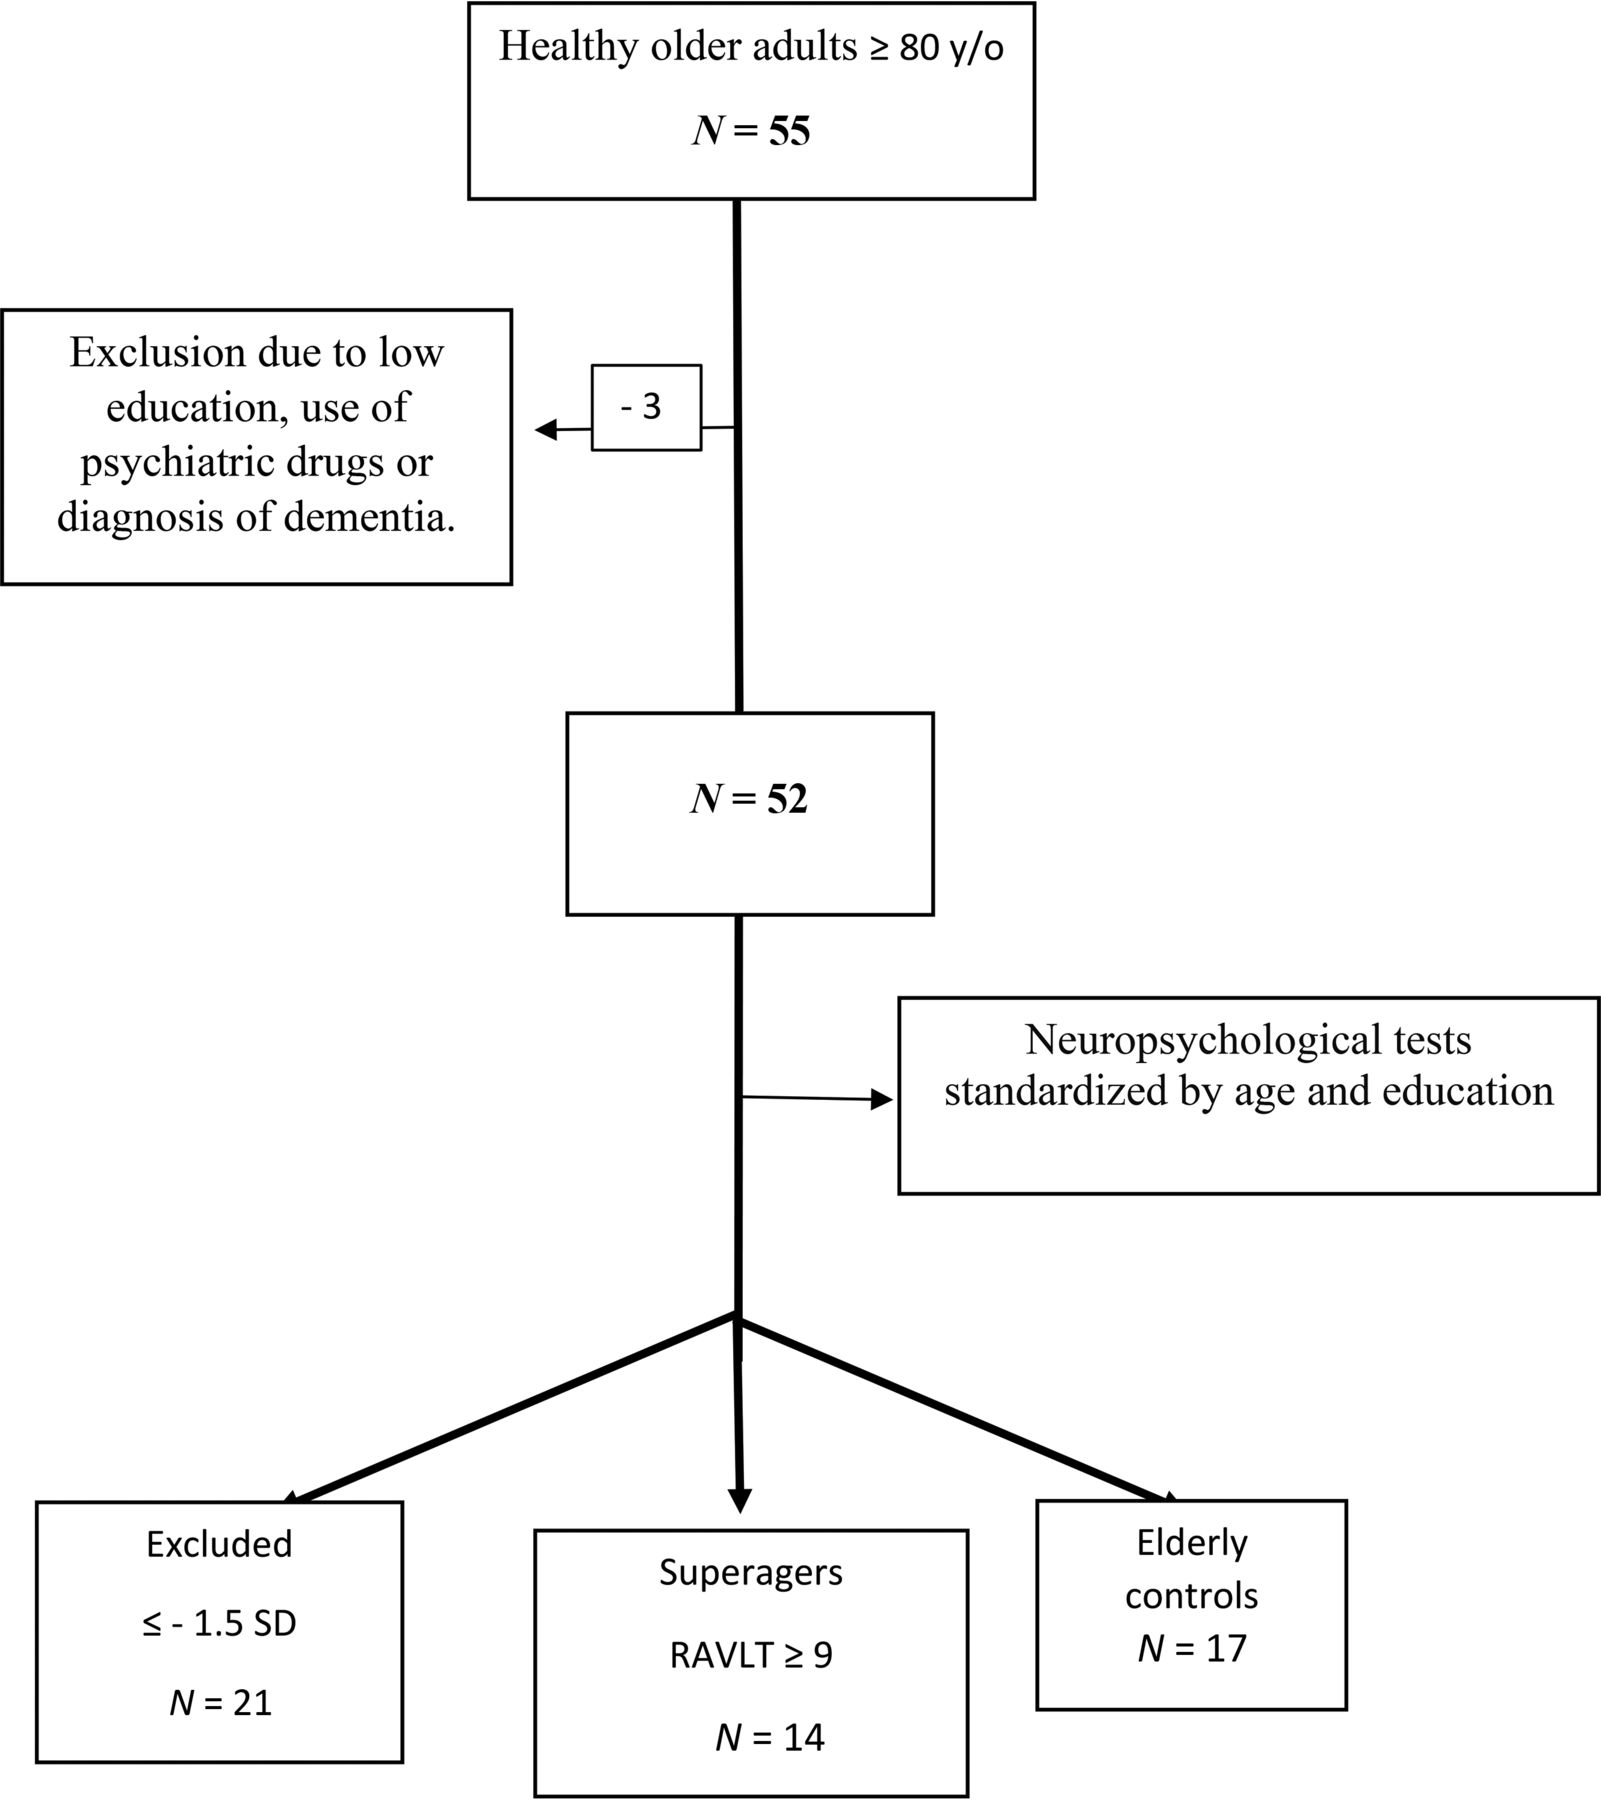
Initially, 55 participants were recruited from different centers in the city of Sao Paulo, Brazil, as detailed previously by de Godoy et al,10 and the neuropsychological tests were performed at the Department of Neurology of Hospital das Clinicas (Medical School of the University of Sao Paulo). Informed consent was obtained from each participant and the research project was approved by the Ethics Committee of the University of Sao Paulo (#62047616.0.0000.0068). The study was designed and conducted according to the Declaration of Helsinki.
The inclusion criteria for the participants were the following: 1) 80 years of age and older; 2) education of ≥ 4 years; 3) Mini-Mental State Examination scores normal for the individuals’ education;11,12 4) Functional Activity Questionnaire score of ≤ 4;13 5) Clinical Dementia Rating score equal to zero; and 6) a result of the 15-question version of the Geriatric Depression Scale of ≤5.
The exclusion criteria included the following: 1) a diagnosis of dementia or mild cognitive impairment according to the National Institute on Aging and Alzheimer’s Association criteria;14,15 2) a diagnosis of a major psychiatric disorder by the Diagnostic and Statistical Manual of Mental Disorders, Fifth Edition; 3) a history of alcohol or psychoactive drug abuse; 4) current or previous diagnosis of diseases of the CNS (ie, stroke or seizure); 5) the presence of structural lesions in the CNS on imaging that could distort the brain parenchyma (ie, tumor or brain malformation); and 6) visual and/or auditory limitations that impair the performance of cognitive tests.
The flow charts of participant selection and the neuropsychological tests performed are shown in Fig 1 and the Online Supplemental Data, respectively.

Flow chart of participant selection. RAVLT indicates the Rey Auditory Verbal Learning Test; y/o, years of age.
Neurocognitive Screening
The first assessment consisted of a semistructured interview with the collection of sociodemographic data; cognitive assessment using the Mini-Mental State Examination, Montreal Cognitive Assessment, and the Brief Cognitive Screening Battery;16 screening for depressive symptoms and anxiety using the Geriatric Depression Scale-15 and the Geriatric Anxiety Inventory, respectively; and functional assessment with the Functional Activity Questionnaire and Clinical Dementia Rating.
Subsequently, the subjects who met the inclusion criteria underwent neuropsychological tests. The tests included the Forward and Backward Digit Span, Trail-Making A and B, Verbal Fluency (animals) and Letter Verbal Fluency tests, Rey-Osterrieth Complex Figure (copy and delayed recall), Logical Memory of the Wechsler Memory Scale, Rey Auditory Verbal Learning Test, 60-item version of the Boston Naming Test, and Estimated Intelligence Quotient measured with the Wechsler Adult Intelligence Scale, Third Edition. Those who performed equal or less than −1.5 SDs from average normative values adjusted by age and education for any cognitive test aforementioned were excluded.
Healthy Older Adult Grouping
Participants were separated into 2 groups: superagers (n = 14; mean age, 82.93 [SD, 3.47] years) and cognitively average elderly controls (n = 17; mean age, 84.47 [SD, 4.29] years). Superagers were defined as the participants who presented with a delayed recall score (30 minutes) in the Rey Auditory Verbal Learning Test, used as a measure of episodic memory, equal to or greater than average normative values for individuals 50–60 years of age (≥9 words), according to the criteria established by the Northwestern SuperAging research program.2 In addition, to conform with these criteria, they had to perform at or above 1 SD of the average for their age and demographics for cognitive function in the nonmemory domains tests, including Forward and Backward Digit Span, 60-item version of the Boston Naming Test, Trail-Making A, Trail-Making B, Rey-Osterrieth Complex Figure, and Verbal Fluency (animals) and Letter Verbal Fluency tests.17,18 The cognitively average elderly controls performed in memory and nonmemory domains within 1 SD of the average range for their age and demographics, which means that they were average-performing older adults according to their cognitive status.
Imaging Data Acquisition
We acquired MR imaging data of 31 participants (14 superagers and 17 elderly controls) on a 3T scanner, whereas 21 of them (12 superagers and 9 elderly controls) were also imaged on a 7T scanner. The fewer subjects scanned at the 7T field were due to MR imaging safety concerns (eg, the presence of ferromagnetic aneurysm clips, pacemakers, and stents)19 and the safety measures in place during the coronavirus disease 2019 (COVID-19) pandemic.
The 3T MR imaging session was scheduled <1 month after the clinical and neuropsychological assessments. We used a Signa PET/MR imaging 3T scanner (GE Healthcare) with a 32-channel head coil. An anatomic whole-brain 3D T1-weighted scan was acquired with the parameters as follows: TR = 8 ms, TE = 3.2 ms, flip angle = 80°, array spatial sensitivity encoding technique (ASSET) factor = 1.5, FOV = 240 × 240, matrix = 240 × 240, and 180 slices of 1 mm each yielding a voxel size = 1 × 1 × 1 mm during 5 minutes 16 seconds. rs-fMRI was acquired with a T2*-weighted echo-planar imaging sequence with the following parameters: TR = 2000 ms, TE = 30 ms, flip angle = 90°, FOV = 240 × 240, matrix = 80 × 80, section thickness = 3.6 mm (voxel size = 3 × 3 × 3.6 mm), number of slices = 36, gap = 0.4 mm, ASSET factor = 2.5. Although 208 volumes were acquired during 6 minutes 56 seconds, the first 4 volumes were discarded, so we had 204 volumes per subject.
The 7T MR imaging was performed after acquiring all the data on the 3T scanner and within 6 months after the clinical evaluation. We used a Magnetom 7T scanner (Siemens) with a 32-channel coil (Nova Medical). The 3D T1 image was acquired by the MP2RAGE technique with the following parameters: TR = 6000 ms, TE = 2.25 ms, flip angle = 4°/5°, TI = 800/2700 ms, integrated parallel acquisition technique (IPAT) = 3, FOV = 240 × 240, matrix = 320 × 320, and 256 slices, yielding an isotropic voxel size of 0.75 mm3 during 9 minutes 36 seconds. rs-fMRI was acquired with a T2*-weighted EPI multiband sequence, provided by the Center for Magnetic Resonance Research, with the following parameters: TR = 1500 ms, TE = 24 ms, flip angle = 70°, FOV = 210 × 210, matrix = 120 × 120, section thickness = 1.75 mm (isotropic voxel size = 1.75 mm3), number of slices = 81, no gap, multiband accel factor 3, IPAT = 2, and 250 volumes were acquired in 6 minutes 38 seconds.
During the rs-fMRI at 3T and 7T, participants were told to keep their eyes open while looking at a fixation cross. No cognitive tasks or tests were administered before the MR imaging session.
Brain Connectivity Analysis
rs-fMRI Preprocessing.
The MR imaging DICOM files were entered into an automatic pipeline in GraphICA (https://www.brainet.ca/) (Online Supplemental Data).20 Anatomic and functional images were kept in native space and preprocessed using FSL 6.03 (http://www.fmrib.ox.ac.uk/fsl).21 Preprocessing steps of the T1-weighted anatomic images included bias field correction, brain extraction, tissue-type segmentation (CSF, gray matter, white matter), and subcortical segmentation. On the functional data, we performed skull stripping, motion correction, section-timing correction, spatial smoothing (ceiling of 1.5 × voxel size), independent component analysis (ICA)-based Automatic Removal Of Motion Artifacts, high-pass filtering of 100 seconds, and nuisance regression of white matter and CSF.
Extraction of the Functional Networks.
Graphica performs ICA with dual regression implemented in FSL.21 As a part of this process, a set of independent component maps were identified for each network, and dual regression was implemented to identify subject-specific spatial maps using 11 resting-state network masks: auditory, DMN, executive control network left (ECN-L), executive control network right (ECN-R), hippocampal, language, SN, sensorimotor, visual lateral, visual medial, and visual occipital.
Regional Parcellation.
Each subject’s T1-weighted image was automatically segmented with a pipeline implemented in FreeSurfer (Version 7.1.0; http://surfer.nmr.mgh.harvard.edu). Further parcellation was performed with Graphica using a gradient-weighted Markov Random Field Model procedure described in Schaefer et al.22 The procedure yielded 832 parcellated brain regions, which were included as network nodes for further analyses.
Functional Network Construction and Thresholding.
After we coregistered each of the functional resting-state networks to the subject, a mean z value was calculated by averaging the scalar map values of the voxel belonging to each one of the 832 ROIs. The resulting z-standardized correlation coefficients describe the loading of each nodal time course on the respective resting-state networks. To remove spurious or weak z values, for instance, due to noise, the loadings were thresholded with a data-driven mixture modeling approach at a single-subject level.23
Global Properties.
Global properties include the number of found, missing, and extra regions. These properties were calculated on the basis of template masks created and separated by sex for each one of the functional networks using healthy controls to create a baseline for the quality index and to exclude or keep the subjects on the basis of their motion. The data from healthy controls came from the Human Connectome Project24 and Openneuro,25 comprising 319 female subjects (mean age , 22.18 [SD, 25.19] years) and 482 male subjects (mean age, 25.05 [SD, 28.26] years). The number of found regions was defined as the regions with z values different from zero that survived the thresholding process. Missing regions were defined as the regions that have not been identified but do belong to the specific functional template mask. The number of extra regions was defined as regions that do not belong to the respective functional network template mask but were found.

Statistical Analysis
Classification Analysis.
The whole-brain connectivity parcellation comprises 832 ROIs. To avoid overfitting in the regression model, we selected 6 key networks for successful aging,3⇓-5 encompassing 397 distinct ROIs, with some ROIs overlapping the networks, including the DMN, SN, ECN-L, ECN-R, hippocampal, and language networks. Penalized regression analysis used these networks and within-network nodes to determine brain regions with statistical differences between superagers and cognitively average elderly controls.
Each of the ROIs, grouped within the specific 6 networks, was considered as a covariate in the penalized regression modeling in the following way: For a set of predictors  with
p measurements taken on each, and the response variable
y, regression allows estimation of the coefficients
with
p measurements taken on each, and the response variable
y, regression allows estimation of the coefficients  in the following linear regression model:

The ordinary least squares (OLS) regression finds a set of  that minimize the sum-squared approximation error
  . However, in general, OLS solutions are often unsatisfactory because there is not a unique solution when
  , and it is difficult to pinpoint which predictors are most relevant to the response. Various regularization approaches have been proposed in order to handle “large-
 , small-
n” data sets and to avoid overfitting, such as LASSO (Least Absolute Shrinkage and Selection Operator) and ridge regression, or a combination of both. Elastic Net (EN) addresses these shortcomings since variable selection is embedded into their model-fitting process. These methods were previously applied to a similar problem, with results suggesting that the EN regression was a more robust approach to extreme correlations among the predictors.26 Briefly, sparse regularization methods include the L1-norm regularization on the coefficients, which is known to produce sparse solutions, ie, solutions with many zeros, thus eliminating predictors that are not essential.
, small-
n” data sets and to avoid overfitting, such as LASSO (Least Absolute Shrinkage and Selection Operator) and ridge regression, or a combination of both. Elastic Net (EN) addresses these shortcomings since variable selection is embedded into their model-fitting process. These methods were previously applied to a similar problem, with results suggesting that the EN regression was a more robust approach to extreme correlations among the predictors.26 Briefly, sparse regularization methods include the L1-norm regularization on the coefficients, which is known to produce sparse solutions, ie, solutions with many zeros, thus eliminating predictors that are not essential.
For the analysis here, we used the EN regression that finds an optimal solution to the OLS problem objective, augmented with additional regularization terms that include the sparsity-enforcing. Specifically, there are 2 types of regularizations that EN allows: L1-norm constraint on the regression coefficients that penalizes the absolute size and “shrinks” some coefficients to zero, and a “grouping” L2-norm constraint, which penalizes the squared size of the coefficients and enforces similar coefficients on predictors that are highly correlated with each other, which L1-constraint alone does not provide. Formally, EN regression optimizes the following function,
 where
where is L1-penalty term and
  is the quadratic penalty term.
In our case, for each of the networks, we let
y be a binary outcome of either being a superager or an elderly control and
X consisted of 397 covariate measurements representing the regions (nodes) across the 6 neural networks. We modeled the relationship as,

Model Prediction and Classification.
Using these models, we calculated the expected probabilities of an individual being a superager predicted from the penalized regression model using the measurements of the network and plotted this as an outcome (on the y-axis) versus the binary observed values of the individual being either an elderly control or superager to evaluate the prediction performance of the model (Fig 2). The diagonal lines in Fig 2 represent the mean difference between predicted probabilities for superagers and elderly controls. The prediction model can be thought of as an OLS linear regression,
 where s is the observed data superager indicator variable,
  is the mean predicted probability of being a superager for the observed group (either control or superager), and
  is the slope of the line, which indicates the discriminatory ability of the model. Larger values demonstrate better performance (steeper lines), and zero corresponds to no predictive ability with a horizontal line for that network.

Plots showing the classification results for superagers across several networks examined on 3T and 7T fields. These plots show the observed superager status for each participant (blue and red dots) plotted against the probability of being a superager predicted from the fitted model. The diagonal lines represent the mean difference between predicted probabilities for superagers and elderly controls. The steeper the gradient of the lines, the higher the superagers’ prediction.
Quantification of Regression Analysis Results.
We used the regression models in Equation  to infer the ORs describing the difference between the odds of exposure in each network and region (node) among superagers and elderly controls. In our study, they can be interpreted as a measure of the relative influence of a network and region within on the likelihood of being a superager. We obtained the ORs using the fitted models to give an average comparison between individuals with or without a unit increase in a particular region
j; if
p is the probability of being a superager then,
to infer the ORs describing the difference between the odds of exposure in each network and region (node) among superagers and elderly controls. In our study, they can be interpreted as a measure of the relative influence of a network and region within on the likelihood of being a superager. We obtained the ORs using the fitted models to give an average comparison between individuals with or without a unit increase in a particular region
j; if
p is the probability of being a superager then,

We used the ORs to quantify the influence of each region within each of the 6 networks. We identified the regions with the ORs that are >1 to be the regions that are most differentiable/discriminative between superagers and elderly controls. If the OR values were equal to 1 (OR = 1), there was no discrimination in the examined regions between groups. Finally, if the OR values were <1, the regions negatively discriminated the examined region as characteristic for a superager. We noted that the P value was not generated from this analysis but the significance of the influence from a network/region could be inferred from the 95% CI for an OR.27
Because the number of variables in the model was very large, the maximum number of nonzero variables was limited to 10. For the analyses, we used the statistical programming language R (https://cran.r-project.org/web/packages/glmnet) and the package glmnet.26
RESULTS
Demographics and Neuropsychological Performance Scores
Superagers and elderly controls did not differ in terms of age (P = .304), education (P = .299), or sex distribution (P = .224). Superagers had statistically significantly better performance compared with elderly controls in the Montreal Cognitive Assessment (P = .003) and some episodic memory tests, including the Delayed-Recall Brief Cognitive Screening Battery (P = .036), Delayed-Recall Rey Auditory Verbal Learning Test (P < .001), and Logical Memory Delayed-Recall (P = .01) (Online Supplemental Data).
Discriminative Networks and Brain Nodes for Predicting Superagers
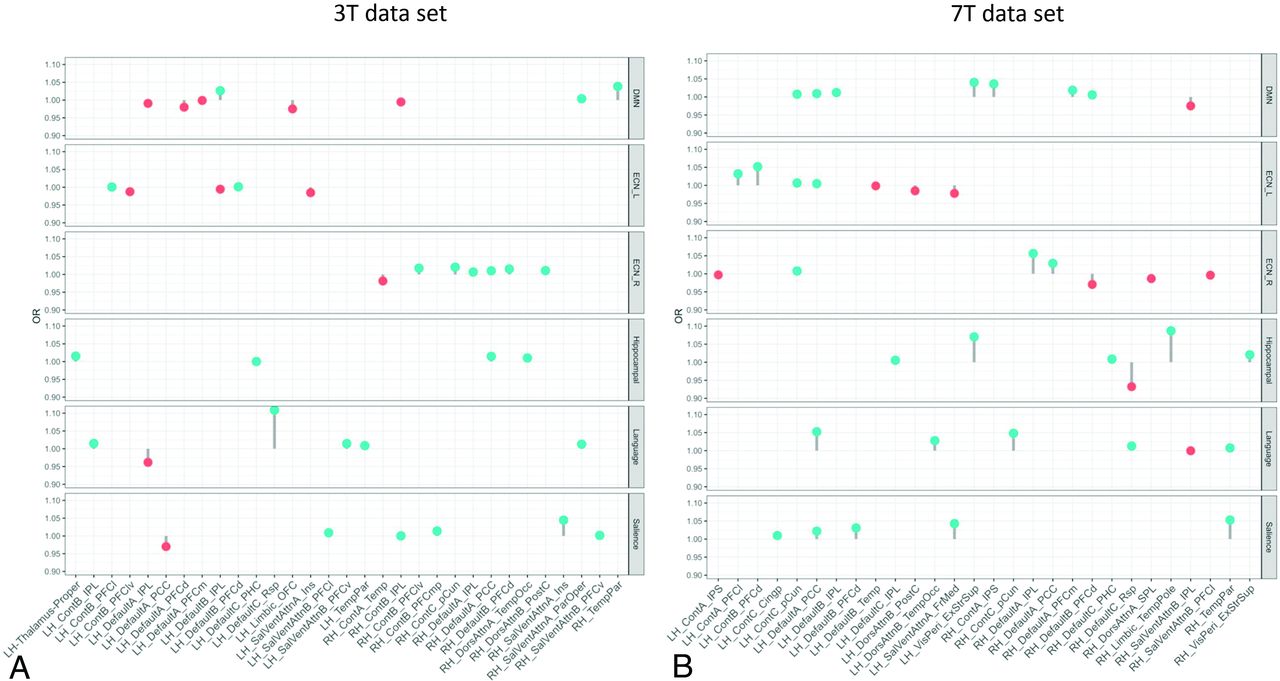
The lollipop plots (as an alternative to bar charts) in Fig 3 show the magnitude (dot) and the range (line) of the nodes within each network that are discriminative between superagers and elderly controls. Here ORs > 1 suggest nodes that are more likely to be different in superagers (ie, larger influence on the predicted probability of being a superager) and are illustrated by lollipops in green. Conversely, nodes with ORs < 1 are less likely to be different in superagers (ie, these regions are negatively discriminated as a characteristic of a superager) and are illustrated by lollipops in red.

The lollipop plots in the 3T data set (A) and the 7T data set (B) indicate the nodes within networks that can differentiate superagers from elderly controls. Within the plots, we show the magnitude (dot) and the range (line) of the difference between superagers and elderly controls. ORs of >1 (OR > 1) suggest a larger influence on the predicted probability of being a superager (lollipops in green). ORs of < 1 indicate regions negatively discriminated as characteristic of a superager (lollipops in red). Cingp indicates posterior cingulate cortex; ContA, control A; ContB:, control B; ContC, control C; DorsAttnA, dorsal attention A; DorsAttnB, dorsal attention B; ExStrSup, extrastriate superior cortex; FrMed, frontal medial cortex; Ins, insula; IPL, inferior parietal lobule; IPS, intraparietal sulcus; LH, left hemisphere; OFC, orbital frontal cortex; ParOper, parietal operculum; PCC, precuneus posterior cingulate cortex; pCun, precuneus; PHC, parahippocampal cortex; PFCd, dorsal prefrontal cortex; PFCl, lateral prefrontal cortex; PFClv, lateral ventral prefrontal cortex; PFCm, medial prefrontal cortex; PFCmp, medial posterior prefrontal cortex; PFCv, ventral prefrontal cortex; PostC, postcentral cortex; RH, right hemisphere; Rsp, retrosplenial cortex; SalVentAttnA, salience/ventral attention A; SalVentAttnB, salience/ventral attention B; SPL, superior parietal lobule; Temp, temporal cortex; TempPar, temporoparietal junction; TempPole, medial temporal pole; TempOcc, temporo-occipital junction; VisPeri, peripheral visual.
When we used the 3T and 7T data sets, though all networks were overall distinct in superagers compared with elderly controls (Fig 2), some of them were more differentiable and predictive of superagers than others. For example, for the 3T data (Fig 3A), the ORs for the SN and language networks were >1 across some regions, with relatively good predictive performance (Fig 2), suggesting that these regions were discriminative in superagers. In contrast, the ECN-L presented only a few regions of ORs > 1 and others with ORs < 1, showing a poor predictive performance. For the 7T data analysis (Fig 3B), the lollipop plots in most networks had ORs > 1 across several nodes and great predictive performance, characterized by a steeper slope of the diagonal lines in Fig 2. The DMN, SN, hippocampal, and language networks were the most discriminative networks in our model prediction classifier for the 7T data set. In addition, for the 7T magnetic field, we had improved sensitivity in detecting a higher number of essential regions within each network. Therefore, on the basis of the classification algorithm, when differentiating superagers from elderly controls, we were more confident using the model fit from the 7T rather than the 3T scanner.
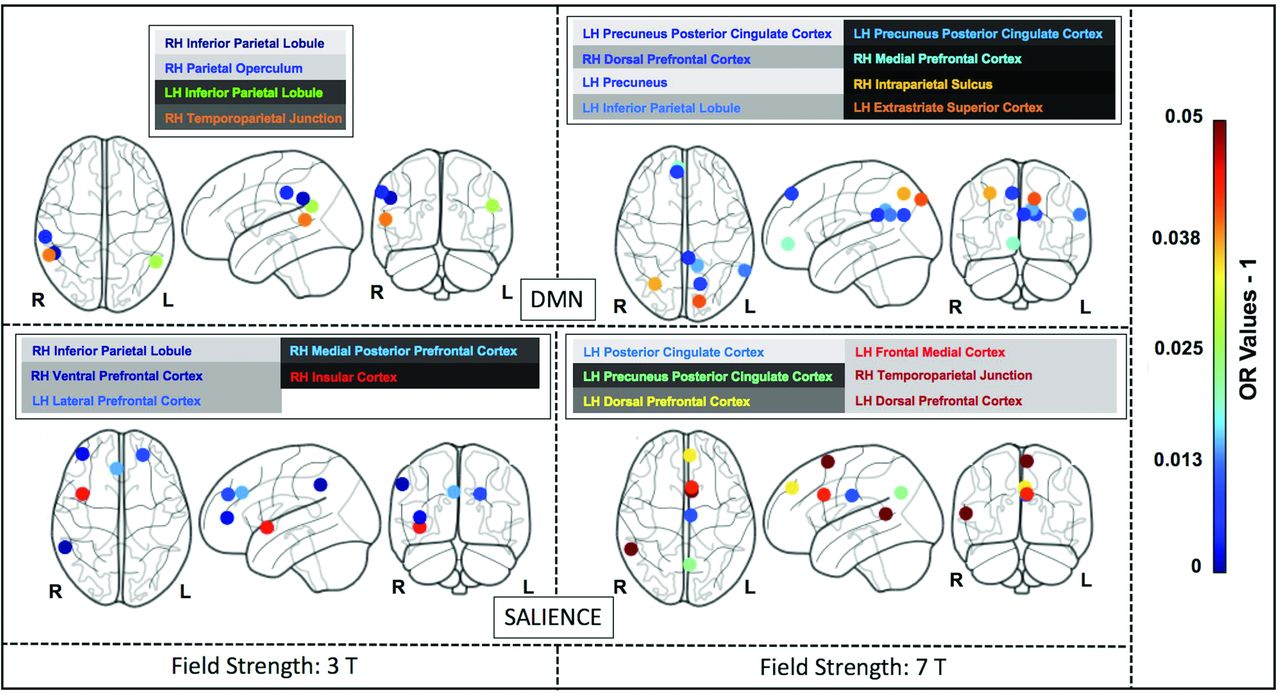
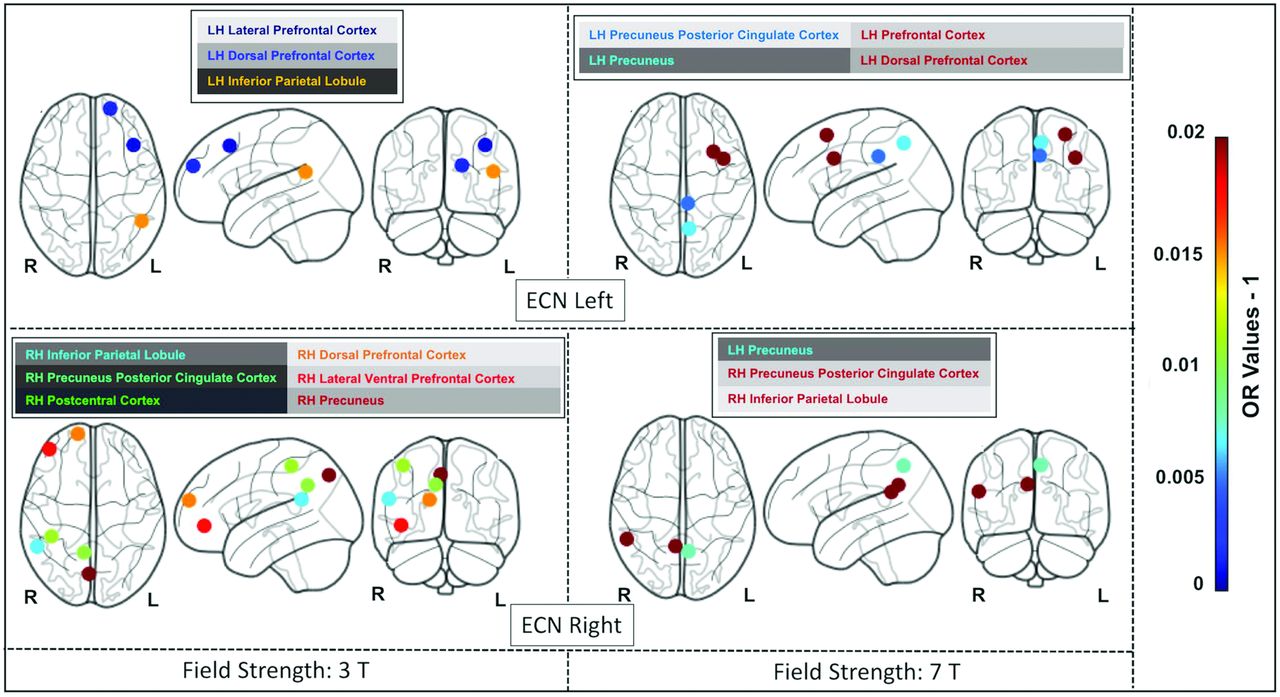
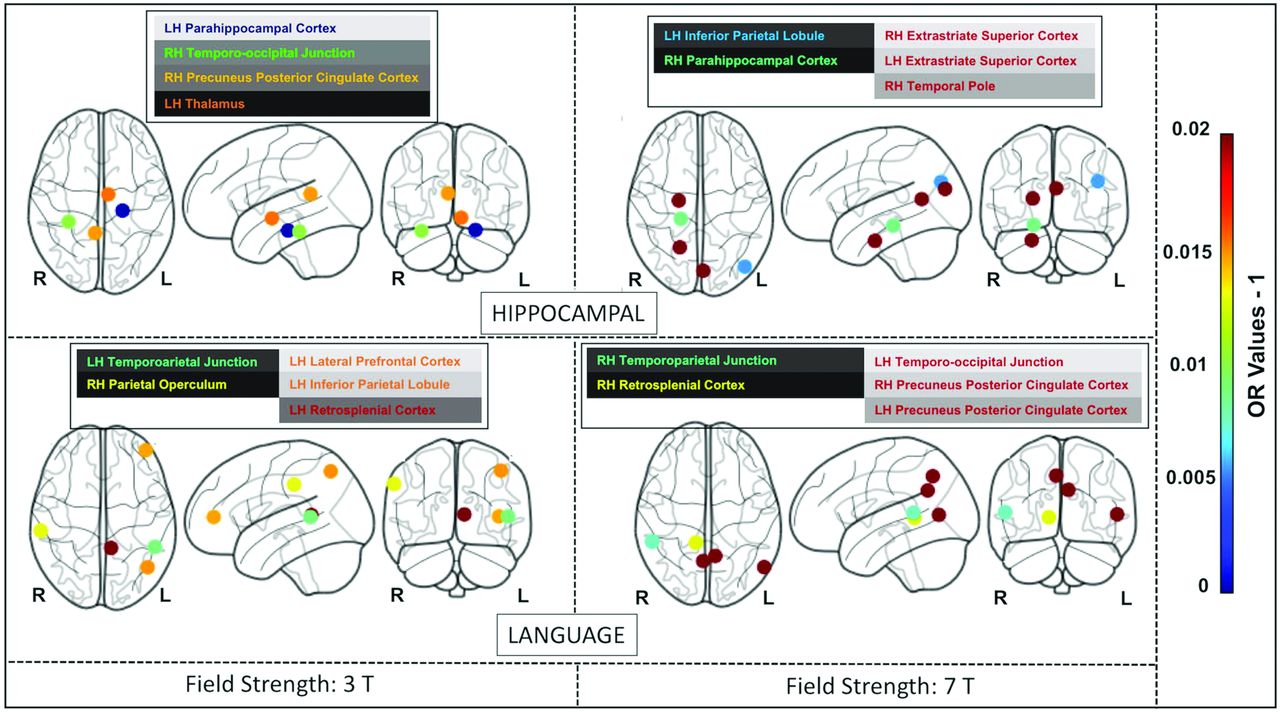
The Online Supplemental Data delineate the anatomic space of each network studied (networks masks). Figures 4, 5, and 6 illustrate the nodes within each network in brain maps, with OR values > 1, which predict superagers for the 3T and 7T data sets (Online Supplemental Data). We used Montreal Neurological Institute coordinates to plot the nodes and heatmaps, varying from dark blue to dark red (OR values furthest away from 1 have higher superager prediction), to demonstrate the discriminative power of each node. The Online Supplemental Data show the elastic model results for the 3T and 7T data sets for all ROIs included.

The most discriminative nodes among the DMN and SN in superagers compared with elderly controls. The heatmap varies from dark blue to dark red (denoting a higher prediction rate for classification as a superager using ORs). RH indicates right hemisphere; LH, left hemisphere; L, left; R, right.

The most discriminative nodes among the ECN-L and ECN-R in superagers compared with elderly controls. The heatmap varies from dark blue to dark red (denoting a higher prediction rate for classification as a superager using ORs). RH indicates right hemisphere; LH, left hemisphere; L, left; R, right.

The most discriminative nodes among the hippocampal and language networks in superagers compared with elderly controls. The heatmap varies from dark blue to dark red (denoting a higher prediction rate for classification as a superager using ORs). RH indicates right hemisphere; LH, left hemisphere; L, left; R, right.
DISCUSSION
In this study, we identified functional networks showing that superagers exhibited distinct intrinsic connectivity compared with elderly controls in a range of brain networks and the core networks predicting a superager were the DMN, SN, and language. Areas in the precuneus posterior cingulate cortex, prefrontal cortex, temporoparietal junction, temporal pole, extrastriate superior cortex, and insula were the most discriminative nodes within these networks. By exploring the 7T and the 3T data sets separately, we could demonstrate higher prediction task confidence in rs-fMRI data sets acquired with the 7T rather than with the 3T scanner.
During the past years, clinical fMRI at 7T has gained traction28 because it offers a beneficial increased SNR and BOLD contrast over conventional 1.5T and 3T MR imaging scanners,29,30 translated into a greatly enhanced spatial resolution of functional activity, the main clinical advantage of 7T fMRI.31,32 A prior study33 demonstrated up to 300% improvement in the temporal SNR and resting-state functional connectivity coefficients provided by ultra-high-field 7T fMRI compared with 3T, indicating enhanced power for the detection of functional neural architecture. We have shown that the higher BOLD contrast-to-noise ratio available at 7T yielded improved sensitivity in detecting differences in the activity across all networks compared with the 3T field, reflected by a steeper gradient of the lines in the prediction classification algorithm. Moreover, higher ORs (OR > 1) were observed across several nodes for the 7T compared with the 3T data set. These differences imply that 7T scanners may facilitate high-quality connectivity measurements capturing stronger evoked rs-fMRI responses, hence offering potentially greater group-level power. This possibility raises our confidence for the results of the within-network nodes and overall model fit from the 7T scanner. Therefore, in the discussion below, the discriminatory nodes for identifying superagers at the 7T data set are emphasized more.
In line with previous studies including successful agers from 60 years of age,4,34 we have found important features for predicting superagers in the DMN and SN. The DMN is implicated in memory encoding, storage, and retrieval, while the SN is believed to be associated with executive processes and detecting emotionally relevant stimuli, as well as alerting.5 In parallel, normal aging is associated with decreased signal complexity within the DMN and SN nodes,35 and there is a disrupted variability in these networks in mild cognitive impairment and Alzheimer disease.36 It stands to reason that the DMN and SN hubs may potentially provide valid and reliable biomarkers for early age-related cognitive decline.
Beyond the classic hubs of the DMN and SN, we also found discriminative nodes within the ECN-L/R, language, and hippocampal networks for predicting a superager among elderly controls. The ECN is generally involved in tasks relying on executive functions, such as the control process and working memory.37 The hippocampal network plays an important role in the consolidation of short-term memory and spatial memory.38 The language network, a critical connectome in our model, encompasses regions of the Broca (inferior frontal) and Wernicke (superior temporal with extension into the inferior parietal cortex) areas39 and has not been previously investigated in understanding the superior preservation of cognitive abilities. Although our groups did not show significant differences in verbal fluency tests, modifications in the language functional connectivity may anticipate changes in language performance in healthy older adults. Moreover, it is well-known that the language network can accurately discriminate patients with mild cognitive impairment from healthy controls40 and is also known to demonstrate weaker functional connectivity in Alzheimer disease.41
The nodes with superior importance for predicting superagers encompassed areas in the extrastriate superior cortex, precuneus posterior cingulate cortex in both hemispheres; inferior parietal lobule, the temporoparietal junction, intraparietal sulcus, insula, and medial temporal pole in the right brain hemisphere; and the prefrontal/dorsal prefrontal cortex, temporo-occipital junction, and retrosplenial cortex in the left hemisphere. Most interesting, most of these cortical nodes presented with stronger intrinsic functional connectivity4,34 and volumetric preservation,5,42,43 akin to features of younger adults in previous studies.3 These nodes also have been considered as key brain functional hubs for diverse cognitive functions and information integration among segregated functional networks.44
Our results indicate that the posterior cingulate cortex, a region mainly engaged in episodic memory,45 plays a crucial role. Our previous study on superagers10 showed a higher total NAA concentration in superagers than in elderly controls in the posterior cingulate cortex, reflecting a metabolically active brain region contributing to superior cognition in late life. Therefore, the functional and metabolic features of this structure observed in our cohort may underlie the superagers’ significantly higher scores in the episodic memory tests. The prefrontal cortex, one of the most discriminative nodes in our cohort, is known to be associated with executive functions (planning, decision-making) and social-cognitive processes.46 Another powerful discriminatory node, the right temporoparietal junction, is engaged in the social domain (empathy, sympathy) and self-evaluating behavior.47 It was previously observed that superagers present with an increased level of positive relations with others, defined by truthfulness and satisfaction, and they manage stress better.48
Among the discriminative nodes from the classifier, the inferior parietal cortex is known to be involved in semantic processing and attention.49 The insula contributes to various brain functions through the integration of sensory, emotional, and cognitive information.50 Moreover, the extrastriate superior cortex, involved in visual-processing information, plays an important role in the DMN and hippocampal networks.51 These nodes highlight how structures not directly involved with memory can contribute to superior memory performance.
Our study has a number of limitations. Our cohort was small due to the constraints in data collection and for prioritizing a rigorous selection protocol, preventing splitting the data set into training and validation samples. Also, the individuals scanned at 7T were a subset of those scanned at 3T due to patient contraindication heightened at 7T. Because for each individual, there were hundreds of measurements introducing a risk of overfitting, the penalized regression methodology was selected. The results should be seen as a contribution to the field and not definitive, because we aimed to investigate the signal that can be found in the data set in the presence of a low number of subjects and possible measurement error. The regression method used did not generate significant P values; however, even if we used standardized methodologies, these would have to be caveated. Moreover, we compared superagers with cognitively healthy older adults, reflecting early and subtle age-related cognitive functional changes; therefore, remarkable differences would not be expected.
The increased spatial resolution of BOLD on 7T and secondary higher detection of intrasubject variability can overestimate the intragroup differences in a small sample size.52 There are also problems concerning B0 and B1 inhomogeneity created by higher field strengths, resulting in geometric distortion and drop-out, respectively, demanding advanced shimming and specialized pulse sequence designs.53 The shorter TE (7T: 24 ms versus 3T: 30 ms), thinner slices (7T: 1.75 mm versus 3T: 3.6 mm), and parallel imaging can avoid some of these issues by reducing intravoxel inhomogeneity and through-plane dephasing.53,54 The present study also had constraints regarding differences in acquisition protocols between the 3T and 7T scanners. First, the voxel size was different in 7T (isotropic voxel size = 1.75 mm3) compared with 3T (voxel size = 3 × 3 × 3.6 mm). The precision of the whole-brain functional connectivity maps shown in this study may have been impacted by the smaller voxel size of the 7T protocol compared with 3T.55 The TR was also longer at 3T (TR = 2000 ms) compared with 7T (TR = 1500 ms), indicating that the number of frames was higher for 7T for the same scan time. The higher number of frames is expected to improve the temporal resolution of the 7T scan compared with 3T. Ultimately, the acceleration factor was higher at 7T (multiband acceleration factor 3, IPAT 2) compared with 3T (ASSET factor 2.5), which can reduce signal distortion, signal drop-out, and partial volume effects but can also increase motion sensitivity and reduce the SNR.29,56 Even though we highlight advancements in numerous metrics, including temporal SNR, sensitivity to detect connectivity measurements, and whole-brain connectivity maps for the data set at 7T compared with 3T, some results may be affected by differences in acquisition protocols and different scanners.
CONCLUSIONS
Our findings indicated that rs-fMRI may be a useful technique in assessing youthful memory performance in late life and identifying potential superagers, particularly in nodes among the DMN, SN, and language network. Our results highlight the benefit of 7T over the 3T magnetic field scanners for this diagnostic and classification task and warrant further validation in larger prospective studies.
Acknowledgments
We thank Camila de Godoi Carneiro, MSc; Artur M. Coutinho, MD, PhD; and Carlos A. Buchpiguel, MD, PhD, for the collaboration in the development of this project.
Footnotes
Sotirios Bisdas, Andrea Soddu, and Jasmina Panovska-Griffiths contributed equally to this work.
Disclosure forms provided by the authors are available with the full text and PDF of this article at www.ajnr.org.
References
- Received July 28, 2022.
- Accepted after revision February 19, 2023.
- © 2023 by American Journal of Neuroradiology


Jump to section
Related Articles
Cited By...
- No citing articles found.