
Abstract
BACKGROUND AND PURPOSE: An early and accurate diagnosis of multiple sclerosis remains challenging in clinical neurology. Established diagnostic methods have less than desirable sensitivity and specificity. An accurate, noninvasive diagnostic test for MS could have a major impact on diagnostic criteria. We compared the frequency of detection of the central vein sign (CVS) in white matter lesions of MS and controls on 7T T2*-weighted and SWI to 3T SWI. Additionally, we assessed the diagnostic performance of 7T T2*, 7T SWI, and 3T SWI for MS.
MATERIALS AND METHODS: A retrospective case-control study was performed of patients with MS having both 7T MRI and 3T MRI. A control group of patients without MS was selected. Diagnosis of MS was established by board-certified neurologists with fellowship training in autoimmune neurology in line with the 2017 McDonald criteria. Percentage of lesions with a CVS was blindly measured for each technique. Diagnostic performance was computed by sensitivity, specificity, and positive and negative likelihood ratios (LRs).
RESULTS: Sixty-one patients with MS (903 lesions) and 39 controls (1088 lesions) were included. 7T T2* showed significantly more CVS (87%) than both 7T SWI (73%) and 3T SWI (31%) (all P < .001). CVS was identified in the control group in ≤6% of lesions on all sequences. Using a threshold of >40% of lesions with CVS on 7T T2* and >15% on 7T SWI, both sequences had an accuracy = 100%, sensitivity = 100%, specificity = 100%, infinite positive LR, and zero negative LR. Using an optimal threshold of >12%, 3T SWI had an accuracy = 96.0%, sensitivity = 93.4%, specificity = 100%, infinite positive LR, and negative LR = 0.066.
CONCLUSIONS: 7T MRI had 100% sensitivity and specificity for the diagnosis of MS and is superior to 3T. Future revisions to MS diagnostic criteria may consider recommendations for 7T MRI and inclusion of CVS as a biomarker.
ABBREVIATIONS:
- AUC
- area under the curve
- CVS
- central vein sign
- DIR
- double inversion recovery
- ROC
- receiver operating characteristic
- T2*WI
- T2*-weighted imaging
Multiple sclerosis is one of the most common and debilitating autoimmune conditions of the central nervous system.1 With continued evolution of biomarkers, the ability to accurately diagnose MS has improved, yet there remains a gap in early diagnosis for subsets of patients.1 MRI is one of the primary diagnostic tools, as outlined in the McDonald criteria of the International Panel on Diagnosis of MS,2 but many patients may lack the fully defined MRI features for diagnosis, particularly at initial presentation or early in the disease course. Nonspecific, nonenhancing WM lesions are frequently the only finding, which have broad overlap with other causes, such as small-vessel ischemic demyelination, migraine, or other etiologies. Unfortunately, this overlap also commonly leads to the erroneous diagnosis of MS, highlighting the need for a biomarker with both high negative and positive predictive value. One of the more commonly studied imaging biomarkers has been the central vein sign (CVS). Given the promise of CVS in MS, the North American Imaging in Multiple Sclerosis Cooperative recently issued a consensus statement calling for further research on this topic.3
The perivenular relationship of MS demyelinating plaques has been known from histologic literature for decades4 and is thought to represent one of the most histologically specific features of MS. The identification of CVS on MRI would therefore be a potentially powerful biomarker for the diagnosis of MS. Recent studies have reported the potential value of CVS to differentiate MS from other WM lesions, with a recent meta-analysis showing a pooled sensitivity and specificity of 95% and 92%, respectively.5 However, there was a wide range of reported sensitivity and specificity, with variations in definitions, MRI sequences, MRI field strength, and many other factors. While 3T MRI was significantly better at identifying CVS compared with 1.5T,5 there has been increased interest in even higher field MRI, such as 7T. To date, several smaller studies have shown the ability of 7T to detect CVS in MS lesions;6⇓⇓⇓⇓⇓⇓⇓⇓-15 however, a meta-analysis failed to show a significant advantage over 3T.5 Additionally, only a few, small studies have compared MS to other WM lesions to determine the accuracy of 7T in diagnosing MS.8,11,15 There are also very limited data directly comparing the accuracy of 3T to 7T and only in a small number of patients.10,16
There have also been a variety of sequences used in identification of CVS. At 1.5 and 3T, SWI has been the most commonly reported study due to its sensitivity to susceptibility with increased visibility of veins.5 At 7T, T2*-weighted imaging (T2*WI) has also been frequently reported and offers some advantages at 7T.7,12,14 While no 7T studies have directly compared these approaches, studies using these sequences have reported mixed results with varying percentages of lesions with CVS.6⇓⇓⇓⇓⇓⇓⇓⇓-15 To date, there is no clear consensus on the optimal imaging sequence for CVS detection at 7T.
In this retrospective study, we directly compare the utility of 3T SWI, 7T SWI, and T2*WI in detecting CVS. In addition, we assess the ability of CVS to differentiate MS from nonspecific WM lesions in patients without MS (presumed vascular origin) in a large cohort of patients. We hypothesize that 7T is superior to 3T in detecting CVS and has greater accuracy in diagnosing MS. We also hypothesize that 7T T2*WI, configured with a higher in-plane resolution and longer TE, is superior to 7T SWI in detecting CVS and diagnosing MS.
MATERIALS AND METHODS
Patient Selection
This retrospective study was approved by Mayo Clinic Institutional Review Board. Search of an institutional database was performed covering the period from 2021–2023 to identify patients who had undergone a 7T brain MRI imaging with both 3D SWI and 2D gradient-echo T2*WI sequences.
The MS group was retrospectively selected from consecutive patients >18 years of age who were evaluated at the Mayo Clinic neurology department for possible MS. Patients were included if they were determined to have a final diagnosis of MS after evaluation by 1 of 2 board-certified neurologists who specialize in MS and completed fellowship training in autoimmune neurology. The patient's clinical history, physical examination, and results of standard testing were all used to arrive at a final diagnosis in line with the 2017 revisions to the McDonald criteria.2 Inclusion criteria also included having a 3T MRI with SWI, which is the most commonly utilized clinical sequence in the literature. A control group was selected from patients who had no history, physical examination, or laboratory findings that suggested an inflammatory demyelinating disorder and had WM lesions of presumed vascular origin (eg, patients imaged with a wide range of non-MS disorders, including migraine, small-vessel vascular disease, epilepsy, etc). Images were manually assessed for quality, and patients were excluded if any of the 3 sequences had excessive motion artifacts. Pertinent clinical data were collected.
MRI Data Acquisition
The 7T 3D SWI and double inversion recovery (DIR) scans and 2D T2*WI scans were performed on a Magnetom Terra (Siemens) equipped with a 8-channel transmit 32-channel receive head coil (Nova Medical) under “TrueForm” B1 transmit mode. The 3T SWI and FLAIR scans were performed on Prisma, Vida or Skyra (Siemens) machines equipped with a 64-, 32-, or 20-channel receive head coil. Sequence parameters are listed in Table 1. The product SWI sequence and inline processing were used to create SWI, with 4 times of phase mask multiplication, consistent with standard reported practice.17
7T and 3T sequence parameters
Image Analysis
All SWI was independently reviewed in conjunction with coregistered (affine registration with 6 degrees of freedom) DIR for 7T or FLAIR images for 3T to identify WM lesions. The T2*WI allowed adequate visualization of lesions due to its greater T2 weighting. Only lesions that were present on both the 7T and 3T examinations were evaluated for CVS. Lesions were counted for subcortical (<5 mm from cortex), deep (>5 mm from cortex and not contacting the ventricle margin), and periventricular locations and assessed for the presence or absence of CVS.3 Lesions in the posterior fossa and cortical lesions were excluded from the analysis. We excluded confluent periventricular WM lesions where round/ovoid borders of individual lesions were not discriminated, which limits determination of CVS. In contrast to prior guidelines derived for 1.5 and 3T MRI,3 all lesions were included with no restrictions on minimum lesion size. The images were retrospectively reviewed by a board-certified neuroradiologist (8 years of experience and >2 years of experience reading a high volume of clinical 7T MRI cases) who was blinded to the clinical diagnosis.
To assess interrater reliability, 3 board-certified neuroradiologists (13 and 14 years of experience) with clinical 7T MRI experience each rated 60 randomly selected lesions (randomization constrained to select 30 lesions from patients with MS and 30 from controls, with 20 lesions each from 3T SWI, 7T SWI, and 7T T2*WI sequences).
Statistical Analysis
We refer to each combination of magnetic field strength and imaging sequence as a “technique”; these are 3T SWI, 7T SWI, and 7T T2*WI and serve as the independent variables in our analyses. In each subject, for each technique, we computed the fraction of lesions exhibiting the CVS, and this served as the dependent variable in our analyses. We first examined the ability of each technique to distinguish between patients with MS and controls by using independent-samples t-tests (the Mann-Whitney U test was substituted when analyzing the 3T SWI technique because the outcome variable was found to be not normally distributed in control subjects). We then evaluated whether the 3 techniques were equivalent in their ability to detect the CVS in the MS population by using 1-way repeated-measures ANOVA. As that null hypothesis was rejected, we further compared the 3 techniques pair-wise by using paired t-tests to determine exactly which techniques were significantly different (corrected P < .05).
To evaluate the performance of the techniques in evaluating MS cases, we plotted receiver operating characteristic (ROC) curves generated by computationally varying the diagnostic threshold for the fraction of lesions exhibiting CVS. We computed the area under the curve (AUC) for each ROC plot. For the point on each ROC curve corresponding to the highest test accuracy, we also computed the test sensitivity, specificity, and positive and negative likelihood ratios. AUCs were statistically compared by using the DeLong nonparametric technique. Interrater reliability was calculated as Fleiss κ statistic. The statistic was computed for all lesions in aggregate as well as stratified by imaging technique.
RESULTS
Clinical Data
Of 161 screened patients, we identified 61 patients with MS meeting inclusion criteria. A control group of 39 patients was also identified meeting inclusion criteria. A total of 903 lesions were detected in patients with MS versus 1088 in the control group. Demographic and lesion data are shown in Table 2.
Study group demographic and lesion data
Identification of CVS by MRI Field Strength
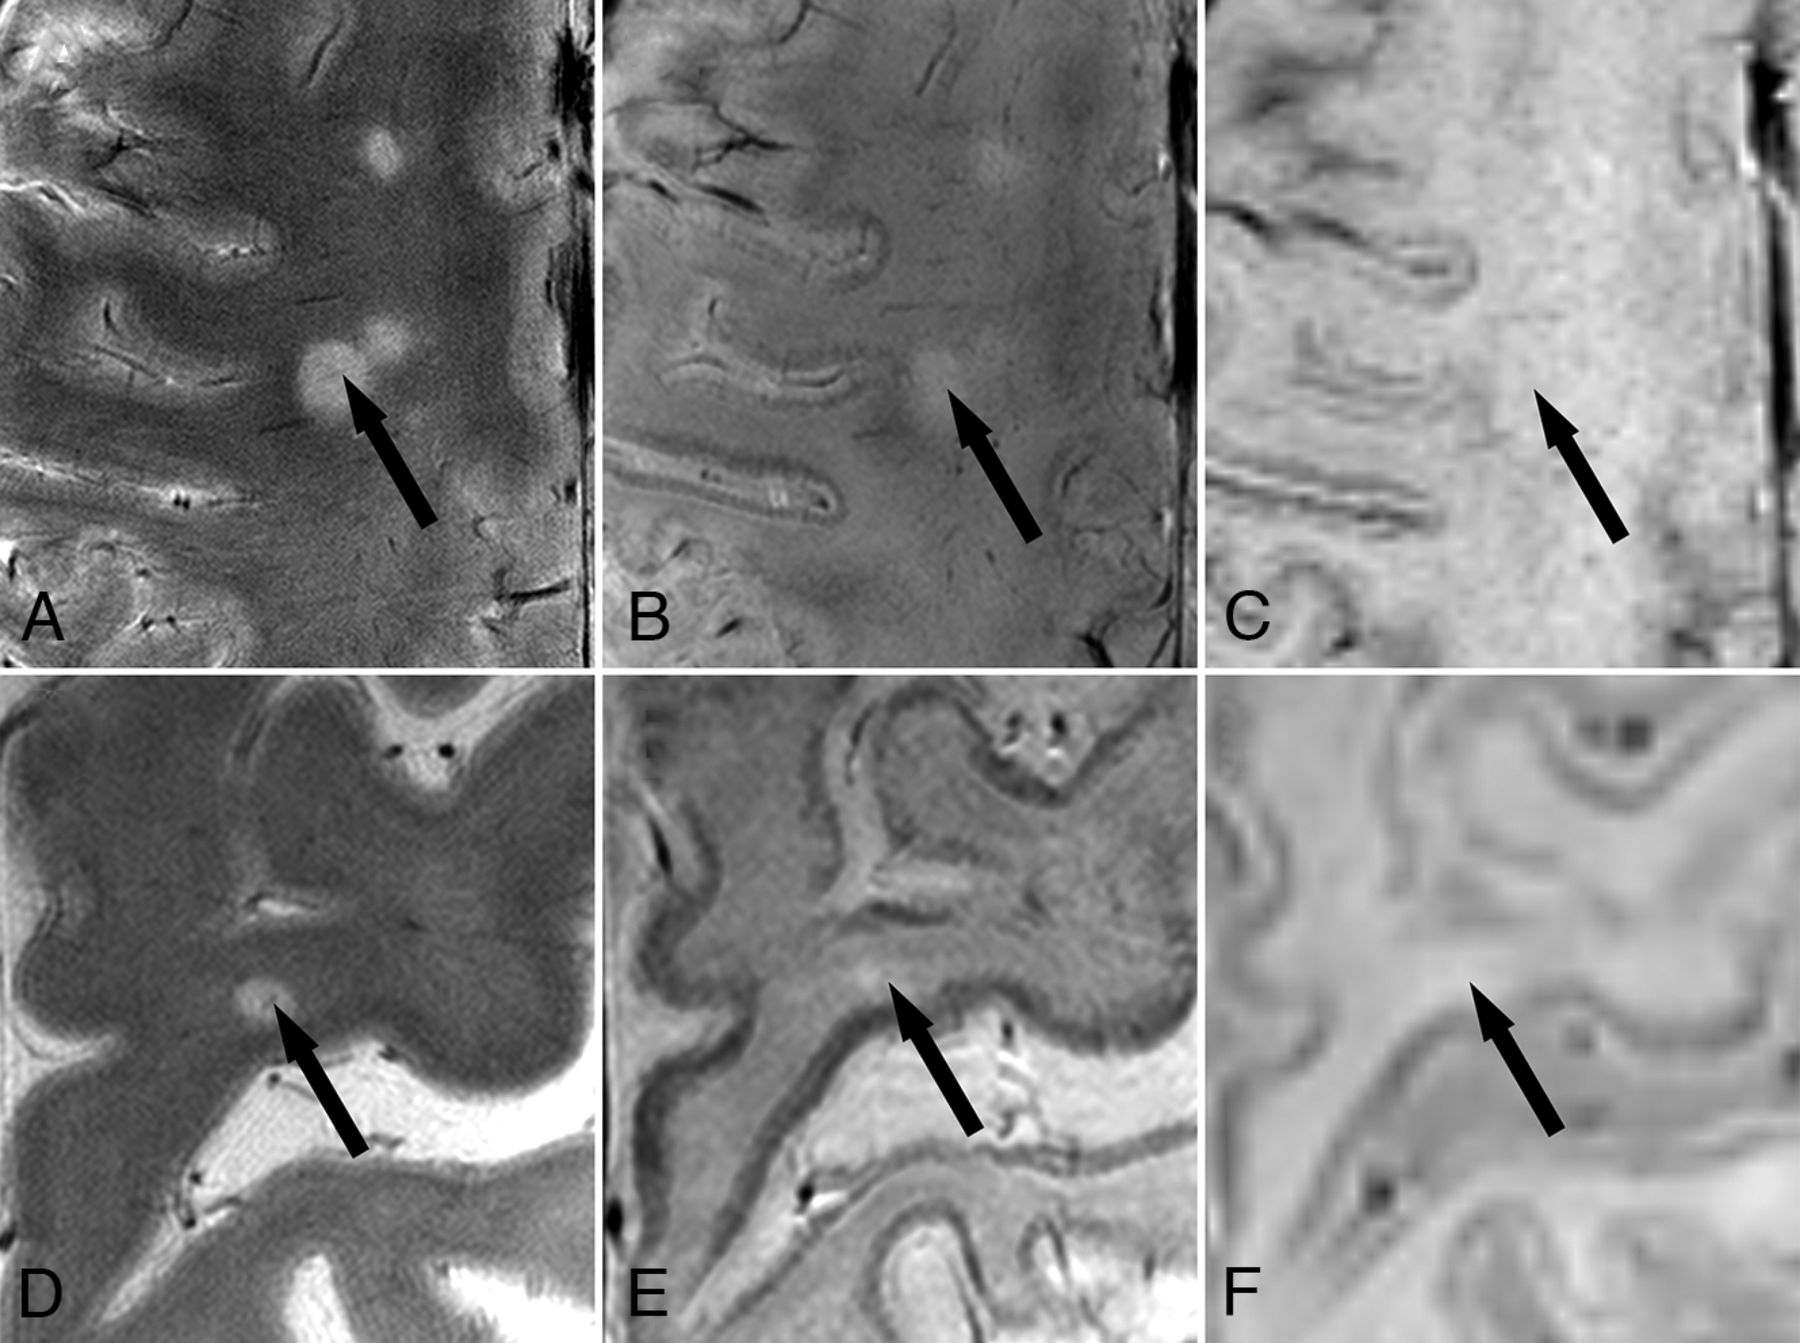
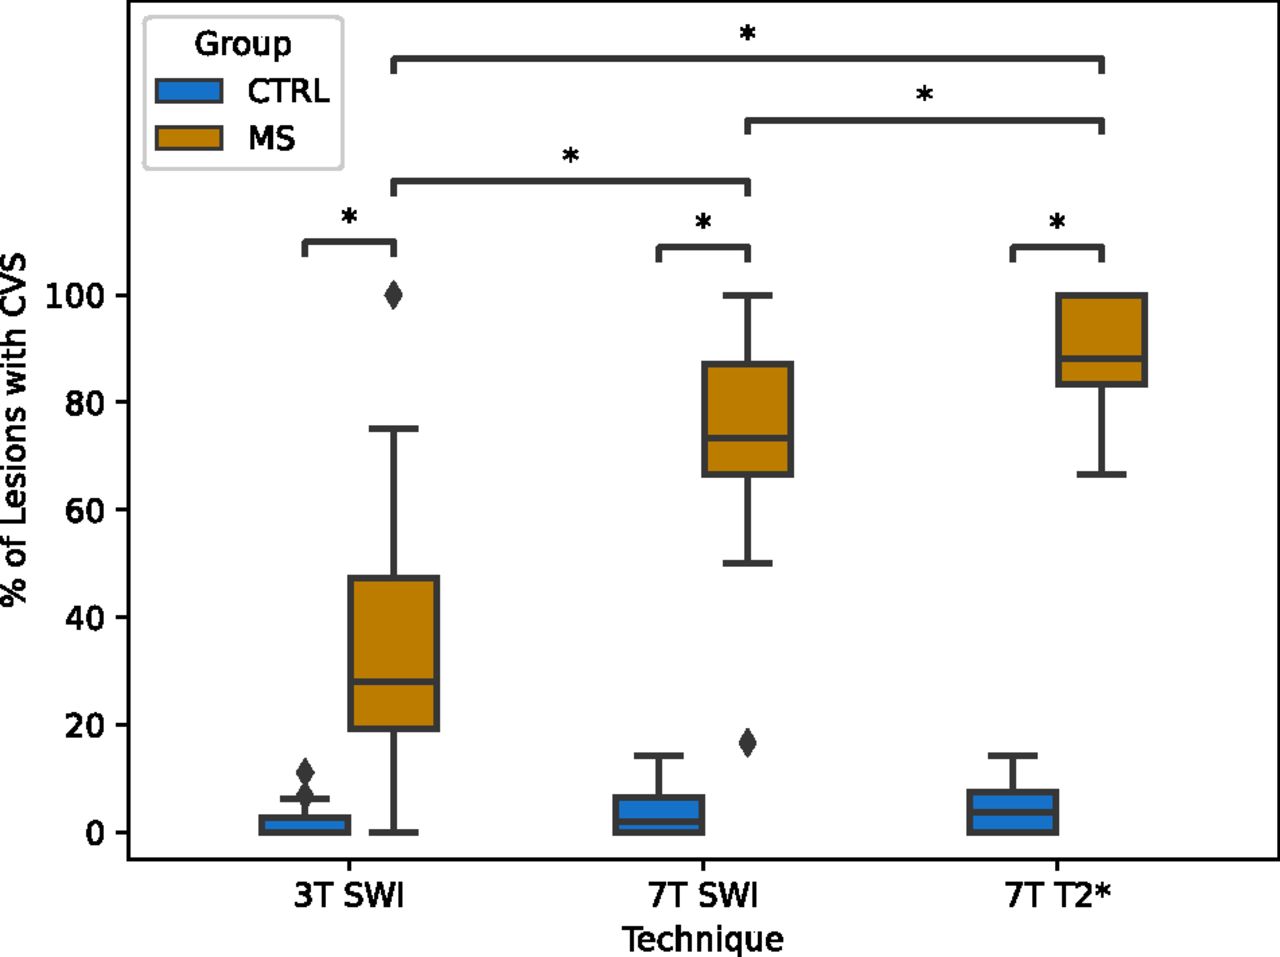
One-way repeated-measures ANOVA established nonequivalence of the 3 techniques with regards to the fraction of lesions exhibiting CVS in patients with MS (P < .001; Fig 1). Further pair-wise testing revealed that 7T SWI demonstrated CVS significantly more often than 3T SWI (73% versus 31% of lesions, respectively; P < .001). 7T T2*WI showed the CVS even more frequently than 3T SWI (87% versus 31%, respectively; P < .001). In contrast, CVS was not commonly identified in the control group, with only 2%, 5%, and 6% of lesions having CVS on 3T SWI, 7T SWI, and 7T T2*WI, respectively (Figs 1 and 2).

CVS by MRI field strength. A, 7T T2* shows a subtle central vein (arrow) that is not well seen on (B) 7T SWI or (C) 3T SWI. D, 7T T2* shows a central vein (arrow) in a small subcortical lesion that is not well seen on (E) 7T SWI or (F) 3T SWI.

Fraction of WM lesions exhibiting the CVS by MR technique. Regardless of MR technique, a significantly greater proportion of lesions in patients with MS exhibit the CVS compared with those in control subjects. Additionally, in patients with MS, the 7T T2* technique reveals a greater proportion of lesions with CVS compared with 7T SWI, which in turn depicts the CVS more often than 3T SWI.
CVS in WM Lesions of Patients with MS versus Controls
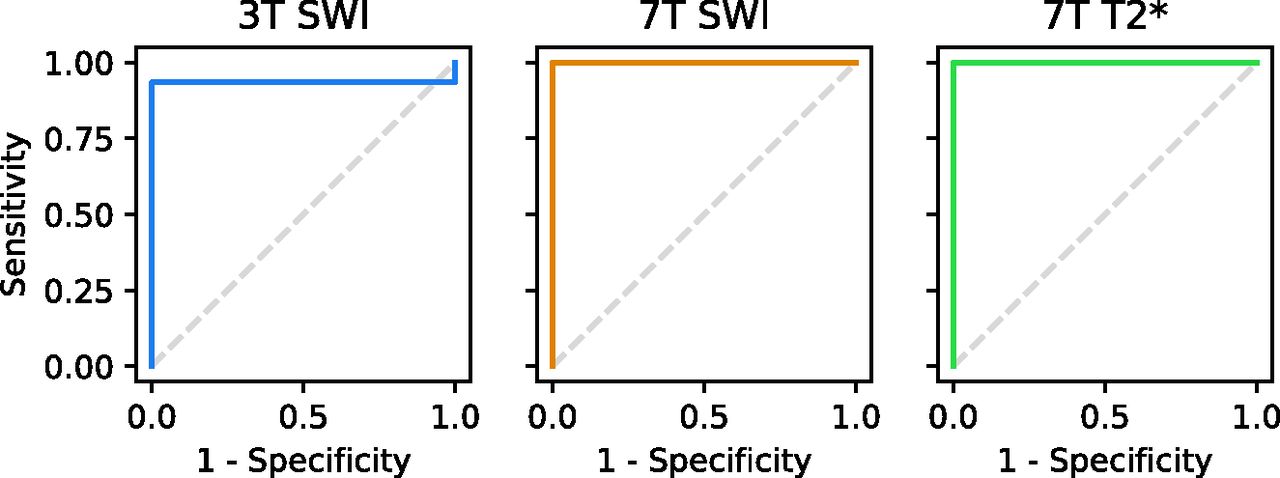
For all techniques, we found that a statistically greater fraction of WM lesions demonstrated a CVS in patients with MS relative to controls (P < .001 in each case) (Figs 2 and 3). ROC curves for each technique are provided in Figure 4. The ROC curve for the 3T SWI technique had an AUC = 0.975. The best diagnostic accuracy for the 3T SWI technique was achieved by using a threshold of >12% of lesions demonstrating CVS. At this threshold, the 3T SWI technique provided an accuracy of 96.0%, sensitivity of 93.4%, specificity of 100%, infinite positive likelihood ratio, and negative likelihood ratio of 0.066. ROC curves for both the 7T SWI and 7T T2*WI techniques had an AUC = 1.0, indicating the presence of perfect discrimination thresholds for the separation of our population of MS and control cases based on the fraction of lesions demonstrating the CVS. The best diagnostic accuracy for the 7T SWI technique was achieved by using a threshold of >15% of lesions demonstrating CVS, while a cutoff of >40% provided the greatest separation for the 7T T2*WI technique. As expected from the ROC analysis, at these thresholds, the ultra-high-field methods had accuracies, sensitivities, and specificities of 100%, infinite positive likelihood ratios, and zero negative likelihood ratios. AUCs for both the 7T SWI and 7T T2*WI techniques were statistically greater than the AUC for 3T SWI (P = .0415 in both cases).

A, Axial 7T T2* in a patient with WM lesions of presumed vascular origin shows no CVS in any of the lesions. B, Axial 7T T2* image in a patient with MS showing CVS in all visible lesions.

ROC curves for discriminating MS from non-MS cases based on fraction of lesions exhibiting the CVS. In our cohort, 3T SWI achieved accuracy of 96% at the optimal threshold, while both 7T SWI and 7T T2* techniques provided perfect separation of MS and non-MS cases.
Performance of 7T SWI versus 7T T2*WI
The 7T T2*WI was significantly superior to 7T SWI for detection of CVS, with 87% of lesions having CVS on T2*WI versus 73% on 7T SWI (P < .001). The difference in CVS detection rates between 7T T2*WI and 7T SWI for both MS and control groups led to differences in the optimal cutoff threshold of >40% versus >15%, respectively. Nevertheless, the diagnostic performance for both sequences was identical with an AUC = 1.0, accuracy = 100%, sensitivity = 100%, specificity = 100%, infinite positive likelihood ratios, and zero negative likelihood ratios.
Impact of Lesion Location on CVS
In the MS group, lesions were most commonly periventricular in location with subcortical lesions being least common (Table 3). In contrast, the control group most frequently had deep lesions with periventricular lesions being least common. Percentages of lesions with CVS for each region are shown in Table 3. For the MS group, the percentage of lesions with CVS was greatest in periventricular lesions followed by deep then subcortical lesions across all techniques.
Number of WM lesions with CVS for each technique relative to lesion location
Interrater Reliability in CVS Detection
Interrater reliability for CVS detection between 3 neuroradiologists was very high in our data set. Across all assessed lesions, Fleiss κ for CVS presence was 0.887. Agreement remained high when each imaging technique was considered separately, with Fleiss κ 1.000 for 3T SWI, 0.794 for 7T SWI, and 0.859 for 7T T2*WI (P < .001 in all cases).
DISCUSSION
To our knowledge, our study is the largest cohort of patients with MS versus controls that have been evaluated for CVS at 7T. Likewise, our study is unique in directly comparing 2 of the most common 7T imaging sequences, SWI and T2*WI. Our results show that 7T SWI and T2* (73% and 87% of lesions, respectively) showed significantly more CVSs than 3T (31%). Additionally, comparing the T2*WI and SWI sequences used in this study, we found that the T2*WI sequence was superior to the SWI sequence in detecting CVS at 7T, as configured in our study. Despite the increased detection of CVS, both 7T techniques were 100% accurate (AUC = 1.0) for diagnosing MS from WM lesions of presumed vascular origin, which was superior to 3T (AUC = 0.975). CVS is a useful biomarker for the diagnosis or exclusion of MS. While 3T had good sensitivity, 7T was superior in both detection of CVS and in accuracy of identifying patients with MS.
Despite advances in laboratory biomarkers and multiple revisions to diagnostic criteria, the diagnosis or exclusion of MS remains a frequent clinical challenge. Compared with the 2010 version, the revised McDonald criteria in 2017 were shown to have a higher sensitivity (increased from 41% to 85%), but lower specificity (decreased from 85% to 63%).18 Additionally, common laboratory biomarkers also have trade-offs in diagnostic accuracy, such as κ free light chain index (88% sensitivity; 83% specificity) and oligoclonal bands (82% sensitivity; 92% specificity).19 Given the need for better biomarkers, there has been increasing interest in MRI morphologic characteristics. Among these, CVS has been one of the more promising biomarkers, with a recent meta-analysis showing a pooled sensitivity of 95% and specificity of 92%.5 However, small 7T studies in this pooled analysis were major drivers of the increased performance, with many 3T studies showing poorer sensitivity and specificity. Despite this, the meta-analysis failed to show a significant advantage of 7T over 3T in detecting CVS, which likely reflects a lack of power or lack of direct comparison studies.5 However, there are a number of inherent biases in the studies included in the meta-analysis. Many 3T studies that reported a wide range of CVS limited their assessment of CVS to only larger lesions, which likely inflated the percentage of lesions reported to have CVS at 3T.5 Such size criteria have been arbitrarily applied based on expert opinion, but largely from data at 1.5T or 3T. While CVS detection is higher in larger lesions, this does not equate to histopathology where small lesions possess a CVS. Indeed, more than one-half of lesions with no CVS identified on ultra-high-resolution ex vivo scanning had a CVS histologically, and these lesions had a smaller mean lesion size.20 When not reporting a size limit, CVS detection at 3T was similar to our results suggesting that many studies have an overestimation of CVS by restricting to only larger lesions.7 By directly comparing 3T and 7T, we show that 7T is not only superior in detecting CVS but also outperforms 3T in diagnosing MS from WM lesions of presumed vascular origin. In our ROC analysis, at the optimal CVS prevalence threshold, up to 6.6% of patients with MS were classified as false-negatives with 3T imaging. Given the potential for disease progression and disability associated with untreated MS, we believe it is worthwhile to pursue 7T imaging in uncertain cases with negative 3T MRI, or even as the initial imaging if local availability permits.
Interestingly, we found an identical optimal threshold value (>40% of lesions with CVS) for 100% sensitivity and specificity in the 7T T2*WI as one of the few prior studies assessing CVS in diagnosing MS in a cohort of 28 patients with MS.11 In a smaller cohort of 13 patients, Mistry et al8 attempted to replicate this threshold value of >40% of lesions having CVS by using T2*WI and also found 100% sensitivity and specificity. However, Kilsdonk et al15 used T2*WI in a cohort of 16 patients with MS and found a cutoff of >52% of lesions with CVS with a sensitivity and specificity of only 88%. Notably, their CVS detection rate was much lower (74%) than our cohort and the studies by Tallantyre et al11 and Mistry et al,8 suggesting that the imaging methods may vary. The cutoff of >40% was also independently found in a pooled meta-analysis of 3T and 7T T2*WI.5 There are limited data on optimal cutoffs for 7T SWI, and we show that these optimal values differ depending on the technique used. While >40% of lesions with CVS appears to be optimal for T2*WI in multiple studies, the SWI threshold was lower at >15% for 7T and >12% for 3T. The difference in cutoff thresholds between T2*WI and SWI techniques at 7T could be related to the differences in pulse sequence parameters. Dixon et al16 have shown that vessel orientation and various acquisition settings (eg, spatial resolution, TE, and application of phase mask) can affect the sensitivity to smaller veins. The higher cutoff with T2*WI sequence suggests a higher sensitivity to small veins compared with SWI used in this study for the given imaging parameters.
Our results also show that the ability to detect CVS varies by lesion location, with all techniques showing a fewer percentage of subcortical lesions with CVS. There were a greater number of lesions with CVS on T2*WI versus SWI, which may be in part due to technique, such as the longer TE for the T2*WI sequence, higher in-plane spatial resolution, lower pixel bandwidth, and smaller imaging slab. Nevertheless, there were fewer subcortical lesions with CVS even on 7T T2*WI compared with deep and periventricular lesions. Tallantyre et al12 and Hosseini et al14 also found similar results with subcortical lesions being least likely to have CVS on T2*WI. It is possible that even at 7T with higher in-plane resolution, the more peripheral medullary veins remain too small to visualize. Alternatively, because there is a higher incidence of WM lesions of presumed vascular origin in the subcortical regions,21,22 there may be a coexistence of MS-related demyelinating plaques and other causes of WM lesions in patients with MS. Hosseini et al14 suggested that their multiecho SWI technique with a maximum TE of 26.22 ms and an in-plane resolution of 0.5 mm was superior to prior T2*WI studies at 7T in detecting small CVS. Meanwhile, in this study, the 7T T2*WI sequence with a TE of 20.8 ms and higher in-plane resolution was superior to the 7T SWI (TE =14 ms) as well as the results reported by Hosseini et al,14 with CVS detected in 94% of periventricular, 90% of deep, and 73% of subcortical lesions. This highlights the role of higher in-plane spatial resolution and better T2* weighting in detecting CVS. The detection of CVS in these small subcortical lesions is critical because smaller lesions are significantly less likely to have a central vein detected on MRI.10 Because many studies at 1.5T and 3T MRI restricted their analysis only to large lesions (often >3 mm) due to limited sensitivity and specificity at lower field strength, the sensitivity may be reduced because many patients with MS may present with only smaller lesions.5
We suggest that 7T should be preferred for evaluation of MS, particularly when combined with other advantages, such as increased prevalence of paramagnetic rim sign23 and improved detection of cortical lesions.24 In this study, the used T2*WI was preferable to SWI due to better CVS detection, but both were 100% accurate. However, the used T2*WI protocol was advantageous by its better inherent depiction of the WM lesion compared with SWI due to the longer TE and better in-plane resolution. To enhance lesion visibility, others have proposed fused techniques, such as FLAIR*:15 however, this approach is dependent on additional image processing and may be vulnerable to inaccuracies in registration at 7T due to differences in susceptibility-induced distortions between T2*WI/SWI and 3D turbo spin-echo sequences, such as FLAIR. 7T T2*WI has also been shown to be a highly reliable technique with perfect interrater agreement (mean [SE] Cohen κ coefficient, 1.000 [0.000]).8
Our study does have several limitations. First, we restricted the analysis to patients with a confirmed diagnosis of MS, which may have excluded patients with less typical presentations or other autoimmune demyelinating conditions. Further studies will be needed to assess the role of 7T in differentiating other autoimmune demyelinating disorders. Second, due to the retrospective nature of the study, a direct comparison with various other biomarkers is difficult due to the heterogeneity of available data.
CONCLUSIONS
In a large cohort of patients with MS, we show that 7T is superior to 3T in the detection of CVS and more accurate in diagnosing patients with MS. With 100% sensitivity and specificity for the diagnosis of MS, 7T is a powerful biomarker in the evaluation of patients with possible MS. In addition, we show that the 7T T2*WI sequence with higher in-plane resolution and T2* weighting is superior to the 7T SWI sequence used in this study in detecting CVS; however, both sequences had 100% accuracy in diagnosing MS. Optimal thresholds for the diagnosis of MS varied by technique, with 3T SWI, 7T SWI, and 7T T2*WI having optimal thresholds of CVS lesions of >12%, >15%, and >40%, respectively.
Footnotes
L. Okromelidze and V. Patel contributed equally to this work.
Disclosure forms provided by the authors are available with the full text and PDF of this article at www.ajnr.org.
REFERENCES
- Received September 14, 2023.
- Accepted after revision October 30, 2023.
- © 2024 by American Journal of Neuroradiology


