
Abstract
BACKGROUND AND PURPOSE: Photon-counting detector CT (PCD-CT) is now clinically available and offers ultra-high–resolution (UHR) imaging. Our purpose was to prospectively evaluate the relative image quality and impact on diagnostic confidence of head CTA images acquired by using a PCD-CT compared with an energy-integrating detector CT (EID-CT).
MATERIALS AND METHODS: Adult patients undergoing head CTA on EID-CT also underwent a PCD-CT research examination. For both CT examinations, images were reconstructed at 0.6 mm by using a matched standard resolution (SR) kernel. Additionally, PCD-CT images were reconstructed at the thinnest section thickness of 0.2 mm (UHR) with the sharpest kernel, and denoised with a deep convolutional neural network (CNN) algorithm (PCD-UHR-CNN). Two readers (R1, R2) independently evaluated image quality in randomized, blinded fashion in 2 sessions, PCD-SR versus EID-SR and PCD-UHR-CNN versus EID-SR. The readers rated overall image quality (1 [worst] to 5 [best]) and provided a Likert comparison score (−2 [significantly inferior] to 2 [significantly superior]) for the 2 series when compared side-by-side for several image quality features, including visualization of specific arterial segments. Diagnostic confidence (0–100) was rated for PCD versus EID for specific arterial findings, if present.
RESULTS: Twenty-eight adult patients were enrolled. The volume CT dose index was similar (EID: 37.1 ± 4.7 mGy; PCD: 36.1 ± 4.0 mGy). Overall image quality for PCD-SR and PCD-UHR-CNN was higher than EID-SR (eg, PCD-UHR-CNN versus EID-SR: 4.0 ± 0.0 versus 3.0 ± 0.0 (R1), 4.9 ± 0.3 versus 3.0 ± 0.0 (R2); all P values < .001). For depiction of arterial segments, PCD-SR was preferred over EID-SR (R1: 1.0–1.3; R2: 1.0–1.8), and PCD-UHR-CNN over EID-SR (R1: 0.9–1.4; R2: 1.9–2.0). Diagnostic confidence of arterial findings for PCD-SR and PCD-UHR-CNN was significantly higher than EID-SR: eg, PCD-UHR-CNN versus EID-SR: 93.0 ± 5.8 versus 78.2 ± 9.3 (R1), 88.6 ± 5.9 versus 70.4 ± 5.0 (R2); all P values < .001.
CONCLUSIONS: PCD-CT provides improved image quality for head CTA images compared with EID-CT, both when PCD and EID reconstructions are matched, and to an even greater extent when PCD-UHR reconstruction is combined with a CNN denoising algorithm.
ABBREVIATIONS:
- CNN
- convolutional neural network
- CNR
- contrast to noise ratio
- CTDIvol
- volume CT dose index
- EID
- energy-integrating detector
- HU
- Hounsfield unit
- IR
- iterative reconstruction
- ICC
- intraclass correlation coefficient
- PCD
- photon-counting detector
- QIR
- quantum iterative reconstruction
- Qr
- quantitative regular
- SR
- standard resolution
- UHR
- ultra–high resolution
- VMI
- virtual monoenergetic image
SUMMARY
PREVIOUS LITERATURE:
Prior research has established photon-counting detector CT (PCD-CT) as a promising technique for head CTA, but direct comparison studies to energy-integrating detector CT (EID-CT) in patients by using the now clinically available PCD-CT system are lacking. Features such as the thinnest currently possible section thickness and the sharpest quantitative reconstruction on PCD-CT have not been assessed, nor has the effect on diagnostic confidence of arterial pathology been evaluated.
KEY FINDINGS:
A clinical PCD-CT system provided preferred image quality for head CTA compared with EID-CT at similar radiation dose, at either matched technique or even more so with ultra-high spatial resolution of 0.2 mm combined with a convolutional neural network denoising algorithm. Diagnostic confidence of arterial pathology was higher for PCD-CT than EID-CT.
KNOWLEDGE ADVANCEMENT:
PCD-CT technology has potential advantages over EID-CT in clinical practice. Not only are image quality and small artery visualization on head CTA improved by using PCD-CT compared with EID-CT, but when combined with a convolutional neural network denoising algorithm, the ultra-high spatial resolution afforded by PCD-CT can increase diagnostic confidence over EID-CT.
The recent introduction to clinical practice of photon-counting detector CT (PCD-CT) represents a noteworthy advance in patient care.1,2 Compared with conventional energy-integrating detector CT (EID-CT), PCD-CT has numerous benefits. Instead of an indirect photon detection process in EID, where x-ray photons are converted to visible light at first and then to electrical signal, PCD detects each x-ray photon individually and records its energy information at different energy thresholds. Because of this photon-counting process, electronic noise can be effectively rejected by setting the lowest energy threshold above the electronic noise floor; smaller detector pixels can be used without the need of septae in between detector pixels, which can achieve a higher spatial resolution than EID without sacrificing radiation dose efficiency; and a better photon energy weighting scheme can be used to achieve a higher signal strength than in EID.3 In addition, with the recorded energy information of each photon, PCD-CT allows intrinsic multienergy imaging capability.4
The spatial resolution of PCD-CT on the current commercial system (NAEOTOM Alpha, Siemens Healthineers) can achieve as high as 40 line pairs per centimeter (or 125 µm).3 The potential benefits of the high spatial resolution on the PCD-CT have been explored in lung, extremities, and other areas.1,5,6 In neuroradiology, the improved spatial resolution is of special significance, including but not limited to imaging of the temporal bone.7 An additional aspect of neuroanatomy that can benefit from higher spatial resolution imaging is the neurovasculature.8 A small number of prior publications have compared research, prototype PCD-CT systems with EID-CT in the imaging of the arteries of the head and neck, by using phantoms9 and asymptomatic volunteers.10 These studies did not use the current clinically available PCD-CT system. Therefore, these investigations did not evaluate features such as the thinnest currently possible section thickness and the sharpest quantitative reconstruction, and they also did not assess diagnostic confidence of arterial pathology.
With increased spatial resolution, particularly the ultra-high resolution (UHR) achievable with PCD-CT, image noise also increases. Although the noise increase for PCD-CT is lower than that of EID-CT because of the small detector pixel effect,11 the noise may increase to a point that is not tolerable; that is, to a level at which the benefit of high spatial resolution is outweighed by the high noise. To address this issue, our group has previously developed a dedicated UHR convolutional neural network (CNN) for reducing noise in PCD-CT.12,13
The purpose of this study was to prospectively evaluate the image quality and impact on diagnostic confidence of PCD-CT in head CTA compared with EID-CT in a clinical patient setting for both routine standard resolution (SR) and for UHR-CNN. We hypothesized that the inherent advantages offered by PCD-CT would result in significant improvement in CTA image quality and diagnostic confidence over EID-CT.
MATERIALS AND METHODS
Patient Selection and CTA Technique for Both EID-CT and PCD-CT
Institutional review board approval was obtained for this Health Insurance Portability and Accountability Act–compliant prospective research study. Clinically indicated adult patients underwent head CTA with EID-CT (Force, Siemens Healthineers). Soon after the clinical EID-CT, at a time interval of approximately 30 to 60 minutes, with informed consent, a research head CTA was performed by using a PCD-CT (NAEOTOM Alpha). An identical injection of iodinated contrast was used for each examination: each of the 2 injections consisting of 100 mL Omnipaque 350 (GE Healthcare) were administered at 4 mL/s, followed by 35 mL saline at 4 mL/s. The radiation dose associated with the research PCD-CT scan was assessed by our board-certified medical physicists, and reviewed by our institute’s Radiation Safety Committee as well as our institutional review board. Similarly, the risks of a second contrast injection were also reviewed by our departmental and institutional committees, and finally approved by our institutional review board. The potential risk of the research PCD-CT scan, from both radiation and contrast agent perspectives, was deemed to be low. Verbal and written informed consent were obtained from all patients who participated in this study. During this process, all relevant information about the study, including potential risks, was communicated with the patients who were given time to make their decision on participation. A dual-energy scanning protocol (the clinical default) was used on the EID-CT (100/150Sn, 192 × 0.6 mm detector configuration, rotation time 0.5 second). A UHR scanning mode was used on the PCD-CT (120 kV, 120 × 0.2 mm). Allowing for the inherent differences between EID-CT and PCD-CT, the techniques were matched as much as possible, including with regard to dose. Specifically, the volume CT dose index (CTDIvol) was approximately matched.
Image Reconstruction and a Deep Convolutional Neural Network for Noise Reduction
To provide a fair comparison between the 2 CT systems, images from both platforms were reconstructed at 0.6-mm section thickness by using a closely matched medium-sharp SR kernel; Quantitative regular (Qr) 54 on EID (EID-SR) and Qr56 on PCD (PCD-SR), both with an iterative reconstruction strength setting of 3 and both by using a matrix size of 1024 × 1024. In addition, PCD-CT acquired with the UHR mode (120 × 0.2 mm) provides a much higher spatial resolution. To utilize the UHR capability on PCD-CT, we also reconstructed HR images with the sharpest quantitative kernel (Qr89) at the minimum achievable section thickness of 0.2 mm. This kernel and section thickness are not achievable on the EID-CT.
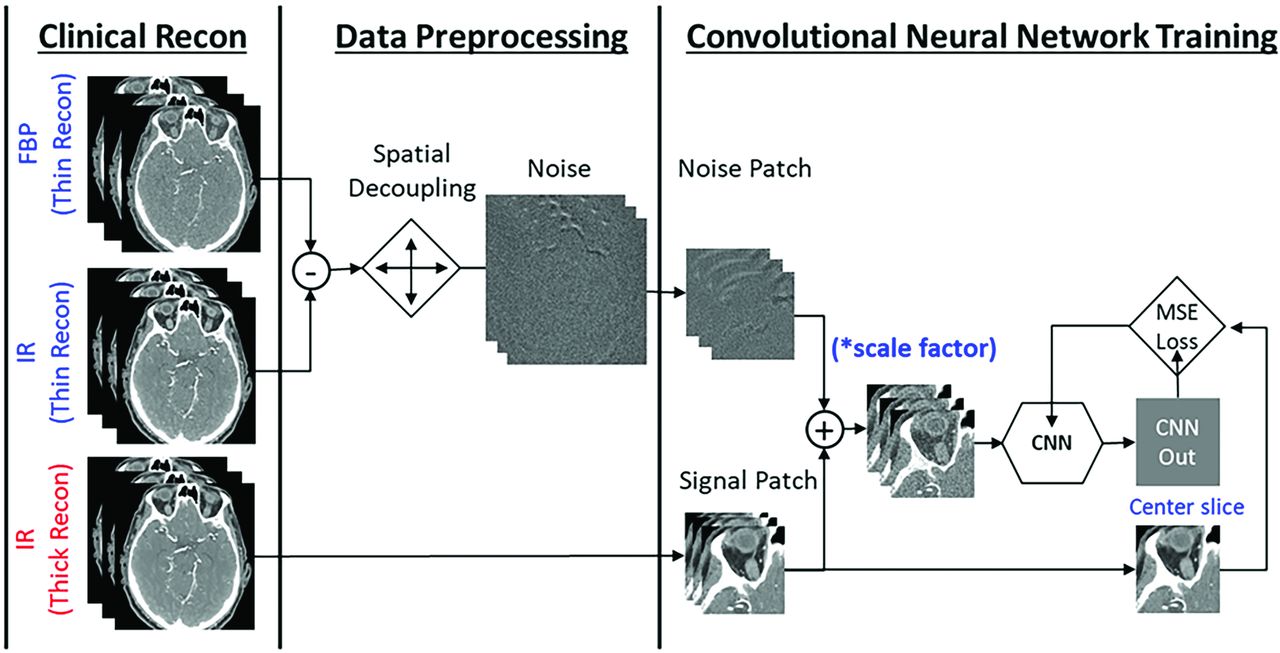
With this sharp reconstruction and thin section thickness on PCD-CT, images are very noisy. Therefore, a deep CNN previously developed and validated at our institution was applied to the UHR image series to reduce image noise. The CNN model in this study was specifically trained for UHR head CTA examinations on PCD-CT (PCD-UHR-CNN) (Fig 1). It used a modified 6-layer residual U-Net with 7 slices as input.12,13 The training was performed by using pairs of input and target images that were created without and with the iterative reconstruction, respectively, both reconstructed with the Qr89 kernel and 0.2-mm section thickness. Eight cases were used in training and 2 cases used in validation. A large number of patches (256,000) with size of 128 × 128 × 3 was generated to alleviate the overfitting during training. In addition, both batch normalization and drop-out layers were added after convolution layers of the UHR-CNN model to ensure the model trained without overfitting. The training was performed on an NVIDIA Tesla M40 GPU with 12-GB memory.

Data preparation and training mechanism of a dedicated ultra-high resolution convolutional neural network (UHR-CNN) for denoising high resolution images from PCD-CT. The model used a modified 6-layer residual U-Net with 7 slices as input. The high-quality images were from iterative reconstruction (IR) images with a thick section thickness and the low-quality images were generated by adding noise patches from subtraction of filtered back-projection (FBP) and IR images followed by spatial decoupling.
Detailed scan and reconstruction parameters are shown in Table 1.
PCD-CT versus EID-CT scan and reconstruction parameters
Image Quality Review Sessions and Evaluation Criteria
Two neuroradiologist readers (R1 and R2, one with 26 years and the other with 5 years of clinical practice experience after neuroradiology fellowship) independently evaluated image quality in a randomized and blinded fashion in 2 separate sessions: 1) PCD-SR versus EID-SR; and 2) PCD-UHR-CNN versus EID-SR. The purpose of the first session was to compare images from PCD-CT and EID-CT at matched spatial resolution. The purpose of the second session was to evaluate the UHR-CNN images from PCD-CT at a resolution not achievable on the EID-CT. The sessions were separated by at least 14 days. In both sessions, each reader evaluated the 2 series of images displayed side-by-side.
Overall image quality was assessed for each technique (5-point Likert score, ranging from 1 [nondiagnostic] to 5 [excellent image quality, better than routine]). The following image quality categories were also assessed (5-point Likert score, ranging from −2 [significantly inferior] to 2 [significantly superior]): noise, artifact, and visibility of 7 representative intracranial arterial segments on each patient’s right side (cavernous ICA, ophthalmic, M3 [opercular], A1, A3 [pericallosal], P1, and P3 [quadrigeminal]). Only these 7 segments and only the right side was chosen to mitigate against reader fatigue. The anterior and posterior communicating arteries were not chosen because they may not be well visualized in any given patient. Specific definitions of these segments included: M3 (opercular), between the insular and cortical segments, beginning at the top of the Sylvian fissure, coursing inferolaterally through it, and exiting at the surface of the cerebrum; A3 (pericallosal), arising from the A2 segment near the genu of the corpus callosum as the larger of the 2 major anterior cerebral artery branches, and overlying the corpus callosum and beneath the cingulate gyrus; and P3 (quadrigeminal), between the ambient and calcarine segments in the quadrigeminal cistern, extending posterior to the midbrain.
In addition, readers evaluated their diagnostic confidence of any specific clinically meaningful arterial findings (eg, stenosis, aneurysm, aneurysm versus infundibulum, etc), if present. All such findings were included, regardless of side (right, left, or midline). The readers were not asked to locate arterial findings as unknowns, nor were they asked to assess if one CT methodology could find more arterial findings than the other. Rather, any clinically meaningful arterial findings, if present, had previously been identified for the 2 readers by a third neuroradiologist (13 years of clinical practice experience after neuroradiology fellowship). This reviewer did not otherwise participate in the comparative reading sessions, and used the prior clinical reports from the EID-CT examinations and confirmatory EID-CT image review to identify the findings. Only the prior EID-CT reports and images were used to identify these findings, not any prior or subsequent CTA/MRA/DSA. A sliding scale was used for this diagnostic confidence assessment by R1 and R2: any number between 0 and 100, ranging from 0, finding extremely difficult to see; 25, finding somewhat difficult to see; 50, finding moderately well seen; 75, finding well seen; to 100, finding extremely well depicted. If a stenosis was preidentified by the third neuroradiologist, stenosis severity (5-point scale, 1: minimal 1%–24%; 2: mild 25%–49%; 3: moderate 50%–69%; 4: severe 70%–99%; 5: occluded) was also rated for each individual series. The 2 readers also were asked to provide subjective comments for any lesion, if relevant.
Iodine Contrast, Noise, and Contrast to Noise Ratio Measurements
Contrast enhancement of iodine was measured as the mean CT number of an ROI within the artery and subtracted from the background CT number measured in another ROI at a nearby uniform soft tissue area. Image noise was measured on the ROI of the soft tissue as the standard deviation of CT numbers for EID-SR, PCD-SR, and PCD-UHR-CNN. The ROI size used best fit to contain the given artery while avoiding the vessel wall due to potential blooming from calcification. The same ROI size was used across all modalities for each specific artery at 4 locations: right and left distal ICA and right and left midcervical ICA. Iodinated contrast to noise ratio (CNR) was calculated by averaging the values of these 4 locations for each patient and for all 3 imaging conditions: EID-SR, PCD-SR, and PCD-UHR-CNN.
Statistical Analysis
Statistical analysis was performed based on the scores obtained from both reader sessions. Means and standard deviations on patient characteristics, CT dose, and each reader’s scores for image quality category were calculated. For the image quality comparisons, a 2-tailed paired t test was used when appropriate, with a P value < .05 indicating a statistically significant difference. Image noise and CNR were also compared among the 3 image conditions with the Friedman test being used for all 3 image sets, with P value < .05 indicating a statistically significant difference. The average noise for PCD-SR and EID-SR was used for calculation of an absolute percent difference. Horizontal percentage stacked bar chart plots were generated to display reader evaluation for image quality, noise, artifacts, and visualization of small arterial segments (Fig 2). Bars are split into segments and the length of each bar is 100%. Grouped boxplots were generated for diagnostic confidence, noise, and CNR results (Figs 3 and 4). The bottom, top, and middle lines of each box indicate the 25th percentiles, 75th percentiles, and sample median of the data. Samples whose notches do not overlap are statistically significantly different at the 5% significance level (Matlab 2021, MathWorks). For the diagnostic confidence data comparing PCD-SR and PCD-HR-CNN with EID-SR, interrater intraclass correlation coefficients (ICC) were calculated. The ICC values were interpreted as follows: <0.5, poor; 0.5–0.75, moderate, 0.75–0.9, good; >0.9, excellent.

Reader evaluation, PCD-CT versus EID-CT. Horizontal percentage stacked bar chart plots demonstrate reader 1 and 2 (R1, R2) scores for PCD-SR versus EID-SR (A) and PCD-UHR-CNN versus EID-SR (B). Bars are split into segments and the length of each bar is 100%. Segments from left to right: significantly superior (+2), somewhat superior (+1), equal quality (0), somewhat inferior (−1), significantly inferior (−2).

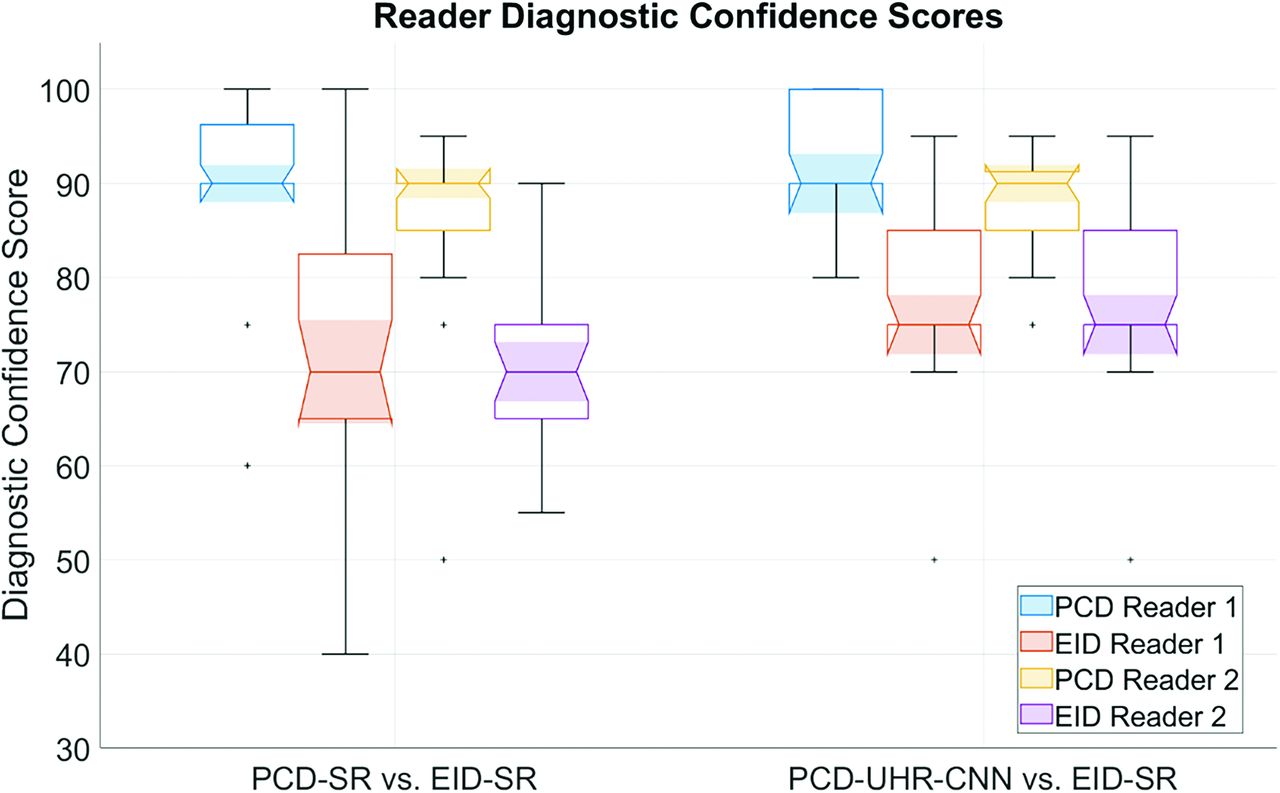
Data plot of diagnostic confidence of arterial findings. Grouped boxplot figure highlighting PCD-SR versus EID-SR and PCD-UHR-CNN versus EID-SR for diagnostic confidence scores of each reader. The bottom, top, and middle lines of each box indicate the 25th percentiles, 75th percentiles, and sample median of the data. Samples whose notches do not overlap are statistically significantly different at the 5% significance level. (Matlab 2021).

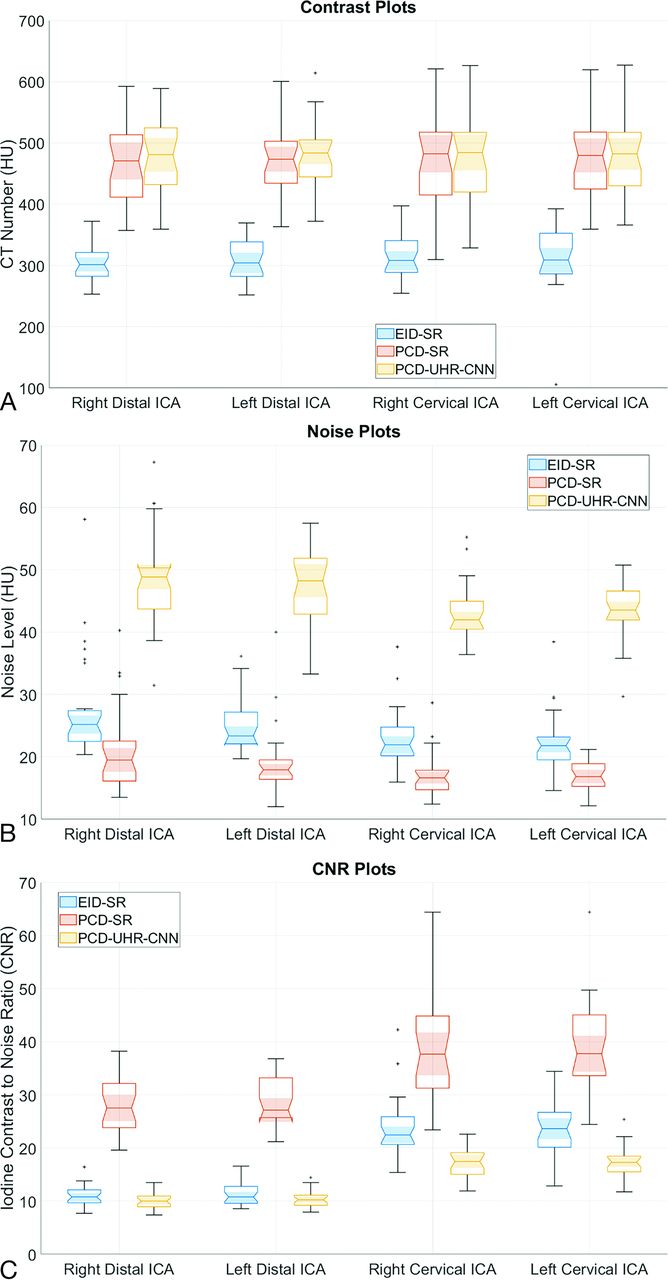
Iodine contrast, noise, and CNR quantitative evaluation. Grouped boxplots for (A) iodine contrast, (B) noise, and (C) iodine CNR results measured in the bilateral distal ICA and midcervical ICA for EID-SR, PCD-SR, and PCD-UHR-CNN. The bottom, top, and middle lines of each box indicate the 25th percentiles, 75th percentiles, and sample median of the data. Samples whose notches do not overlap are significantly different at the 5% significance level. (Matlab 2021).
RESULTS
Patient Characteristics and CT Dose
Twenty-eight adult patients were enrolled in the study (mean age 66.4 ± 12.6 years). The mean and standard deviation of patient weight was 82.5 ± 13.2 kg (range, 56.7–100 kg). The CTDIvol was approximately matched in the head (EID: 37.1 ± 4.7 mGy; PCD: 36.1 ± 4.0 mGy).
Reader Evaluation of Arterial Segments, Artifacts, Qualitative Noise, and Image Quality
For visualizing the 7 representative arterial segments in each patient, both readers on average preferred PCD-SR over EID-SR (R1: 1.0–1.3; R2: 1.0–1.8), and PCD-UHR-CNN over EID-SR (R1: 0.9-1.4; R2: 1.9-2). Artifact scores were better for PCD-SR over EID-SR (R1: 1 ± 0; R2: 0.9 ± 0.3) and PCD-UHR-CNN over EID-SR except for reader 2 (R1: 1 ± 0; R2: −0.4 ± 0.8). Qualitative noise scores were better for PCD-SR over EID-SR (R1: 1 ± 0; R2: 1.6 ± 0.5) and PCD-UHR-CNN over EID-SR (R1: 1 ± 0; R2: 1.9 ± 0.3) (Online Supplemental Data and Fig 2 contain these qualitative data on the 7 arterial segments, noise, and artifacts). Overall image quality scores were greater for PCD-SR over EID-SR (R1: 4 ± 0 and 3 ± 0, respectively; R2: 4.9 ± 0.4 and 3.5 ± 0.5, respectively; P-value < .001) and PCD-UHR-CNN over EID-SR (R1: 4 ± 0 and 3 ± 0, respectively; R2: 4.9 ± 0.3 and 3 ± 0, respectively; P value < .001) (Table 2). An example of the improved depiction of arterial anatomy is shown for a more distal intracranial arterial segment (Fig 5).

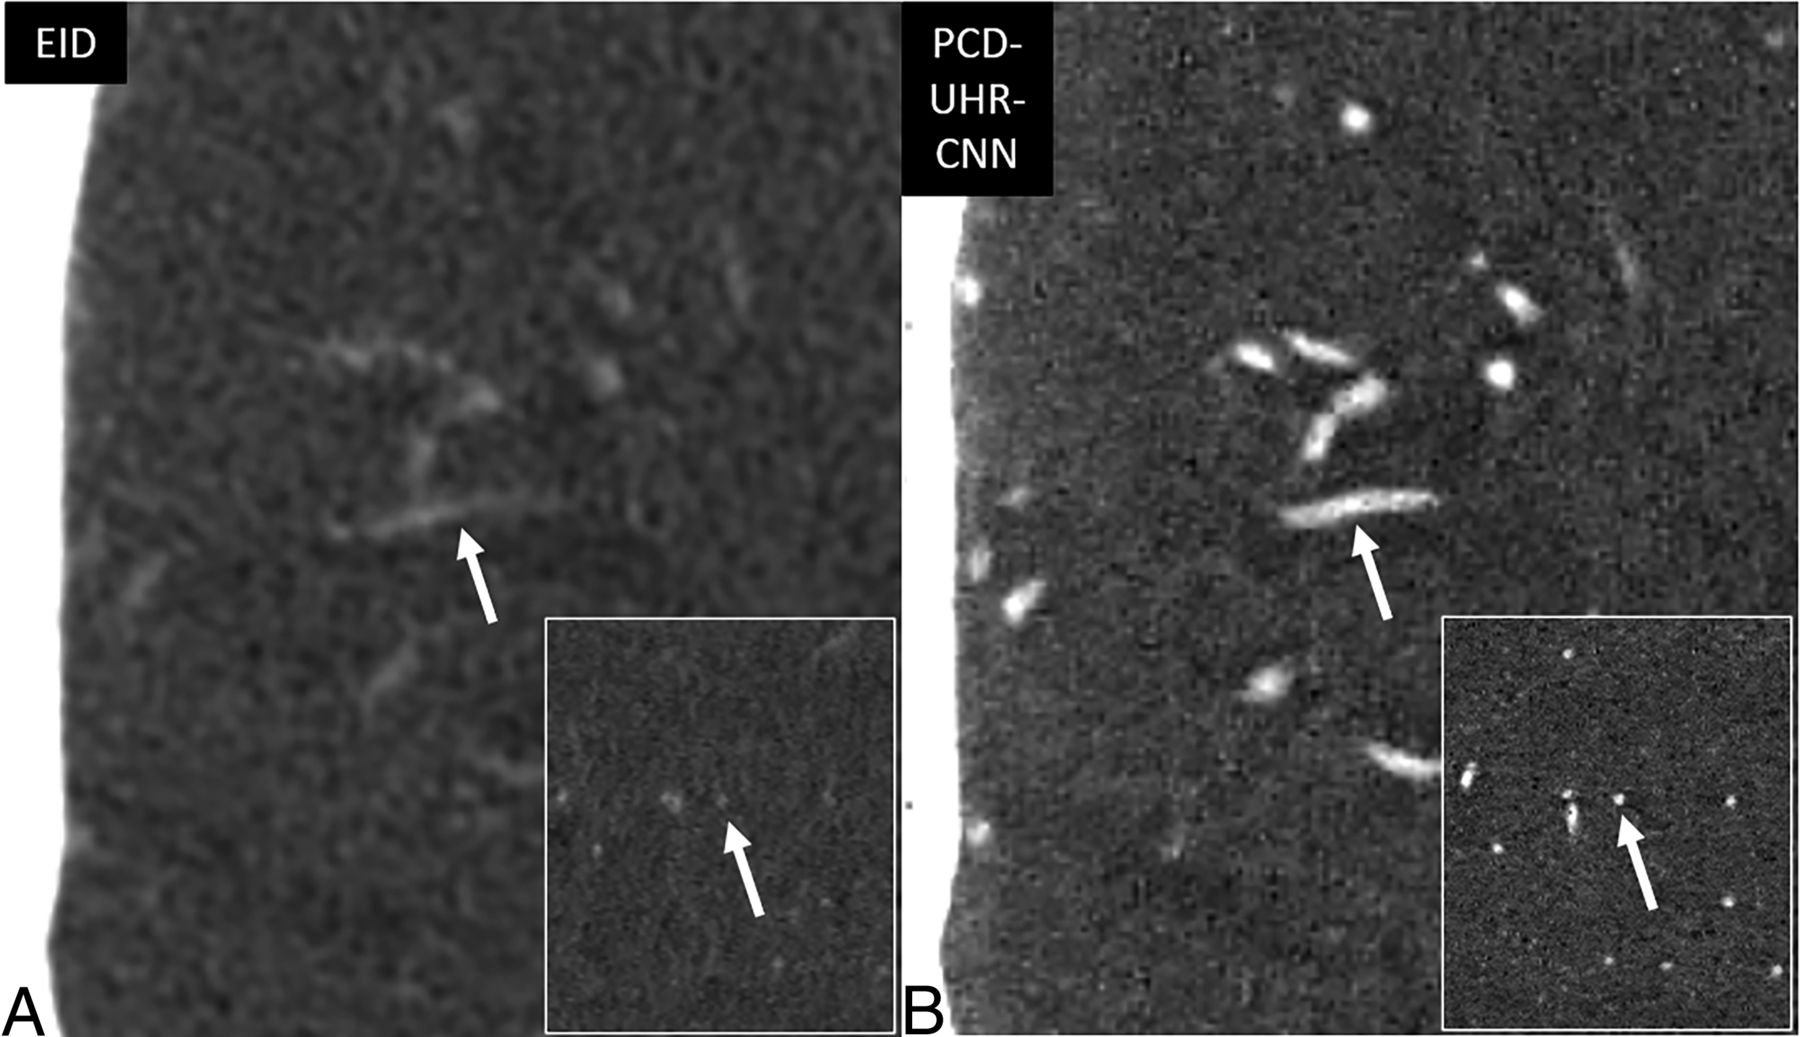
Improved visualization of distal intracranial arterial branches on PCD-CT head CTA compared with EID-CT. Thin section oblique axial head CTA images highlighting the right M3 segment (arrows), by using EID-SR with 0.6-mm section thickness (A) and PCD-UHR-CNN CT with 0.2-mm section thickness (B) techniques. This distal intracranial arterial segment is best visualized by using PCD-CT rather than EID-CT, particularly with PCD-UHR-CNN–but also PCD-SR CT (the latter not shown). The right M3 segment is indeed difficult to visualize on EID-CT compared with PCD-CT. The insets demonstrate the improved visualization of the M3 segment (arrows) in the oblique sagittal plane.
Overall image quality and diagnostic confidence of arterial findings, PCD-CT versus EID-CT
Reader Evaluation of Diagnostic Confidence and Specific Arterial Findings
Diagnostic confidence of specific arterial findings was significantly higher for both PCD-SR versus EID-SR (R1: 90.4 ± 9.1 versus 74.2 ± 15.9; R2: 86.4 ± 8.8 versus 70.4 ± 7.9, respectively; P value < .001) and PCD-UHR-CNN versus EID-SR (R1: 93.0 ± 5.8 versus 78.2 ± 9.3; R2: 88.6 ± 5.9 versus 70.4 ± 5.0, respectively; P value < .001) (Fig 3 and Table 2). Diagnostic confidence was also higher for PCD-UHR-CNN compared with PCD-SR for both readers (R1: 93.0 ± 5.8 versus 90.4 ± 9.1; R2: 88.6 ± 5.9 versus 86.4 ± 8.8; P value < .001). In the comparison of diagnostic confidence of PCD-SR versus EID-SR, the interrater ICC was 0.52 (moderate). In the comparison of diagnostic confidence of PCD-UHR-CNN versus EID-SR, the interrater ICC was 0.88 (good). The specific arterial findings identified by the third neuroradiologist for the 2 readers included: stenoses (n = 12), aneurysms/infundibula (n = 8), aneurysm clips/embolization coil masses (n = 2), and a stent (n = 1) (Figs 6 and 7). For example, the improved visualization of infundibula is highlighted (Fig 6). For the lesion in Fig 6, both readers felt more confident with PCD-CT than with EID-CT. On PCD-UHR-CNN, the readers commented that the lesion could be confidently diagnosed as an infundibulum (rather than an aneurysm), whereas on EID the distinction between these 2 possibilities could not be made (indeed, the case had been clinically interpreted on EID-CT as an aneurysm or infundibulum, with follow-up recommended). For the arterial stenoses (example in Fig 7), there was no significant difference in stenosis severity scores for either reader between PCD-SR versus EID-SR (R1: 2.5 ± 1.2 versus 2.5 ± 1.2; R2: 2.1 ± 1.0 versus 2.2 ± 0.9) and PCD-UHR-CNN versus EID-SR (R1: 2.3 ± 1.2 versus 2.5 ± 1.4; R2: 2.0 ± 1.3 versus 2.1 ± 1.4).

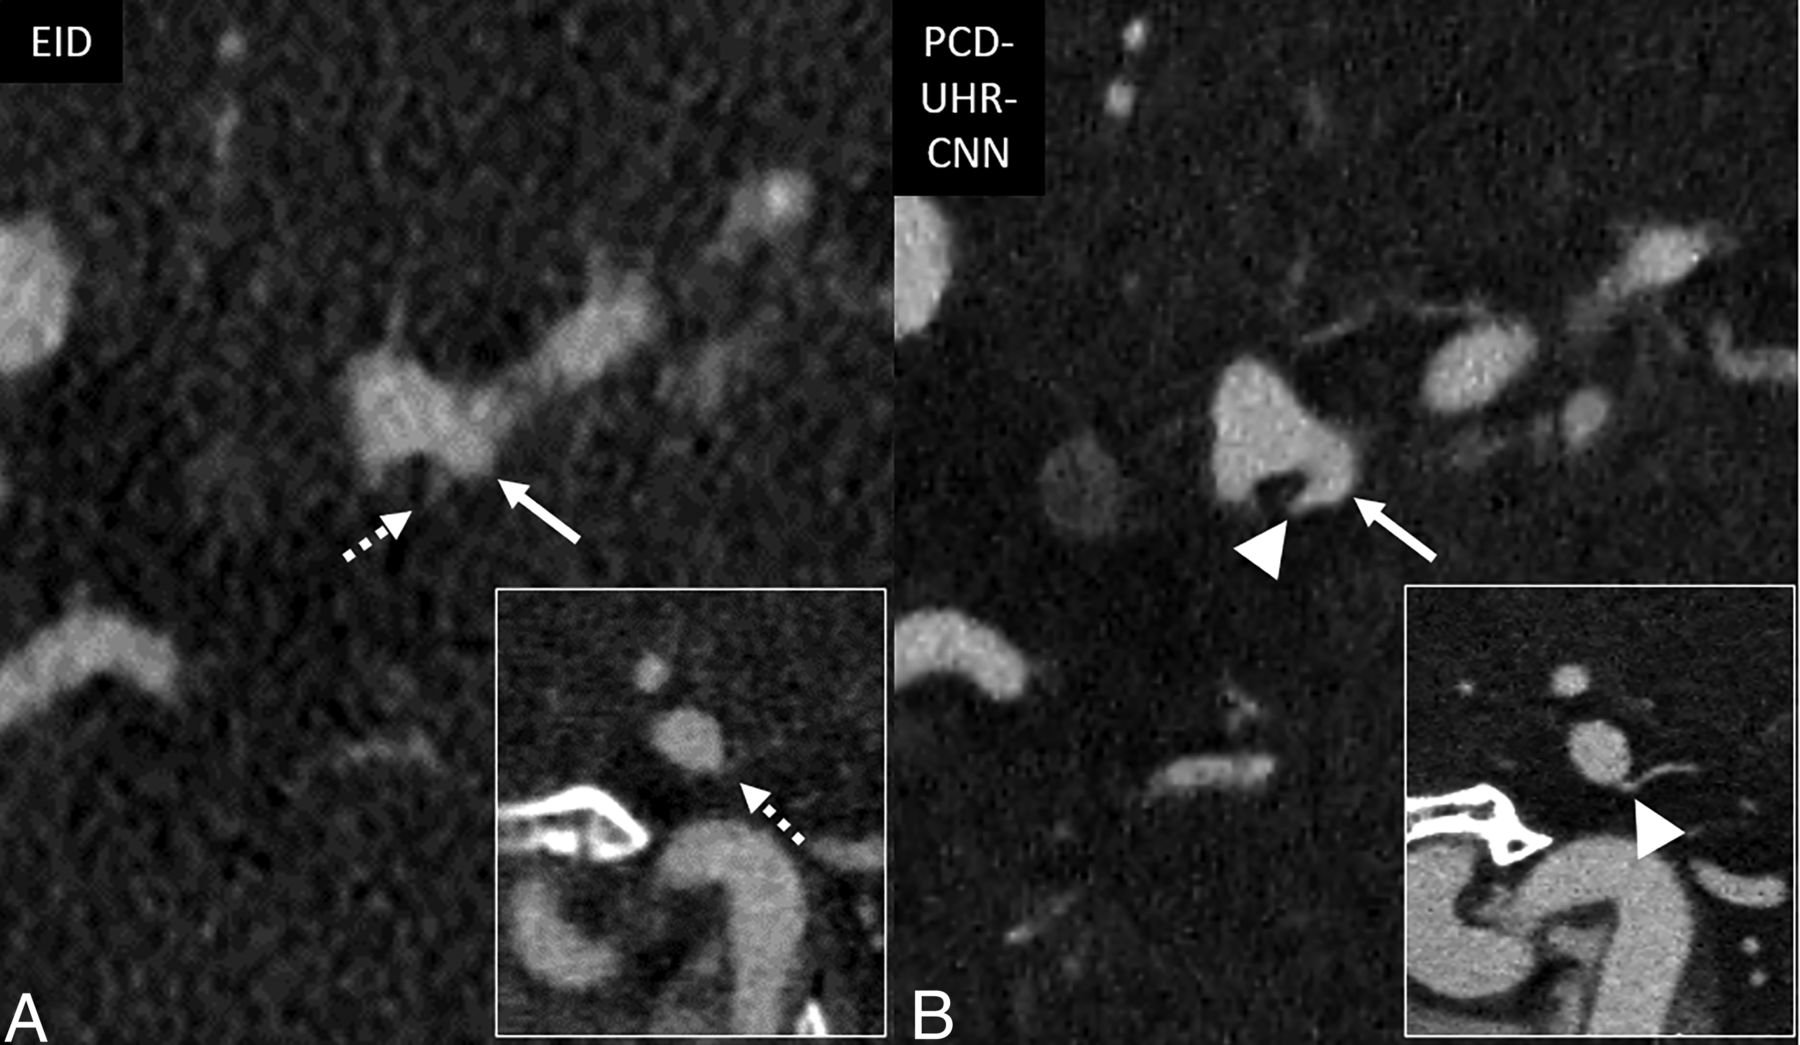
Improved confidence for diagnosing infundibula on PCD-CT head CTA compared with EID-CT. Thin section oblique axial head CTA images, by using EID-SR with 0.6-mm section thickness (A) and PCD-UHR-CNN CT with 0.2-mm section thickness (B) techniques. The diagnostic confidence for diagnosing this infundibulum rather than possible aneurysm improves with PCD-SR matched to EID technique (not shown) and even more so with PCD-UHR-CNN CT at the thinnest section thickness. An ∼2-mm left supraclinoid ICA outpouching (infundibulum or aneurysm) is seen in an oblique axial plane on EID-CT (solid arrow in A), but better delineated on PCD-CT (arrow in B). The anterior choroidal artery arising from the apex of the outpouching is much better visualized on PCD-CT (arrowhead in B) than EID-CT (dashed arrow in A), thereby confidently diagnosing an infundibulum rather than an aneurysm. The insets demonstrate the improved visualization of the anterior choroidal artery arising from the apex of the outpouching in the oblique sagittal plane.

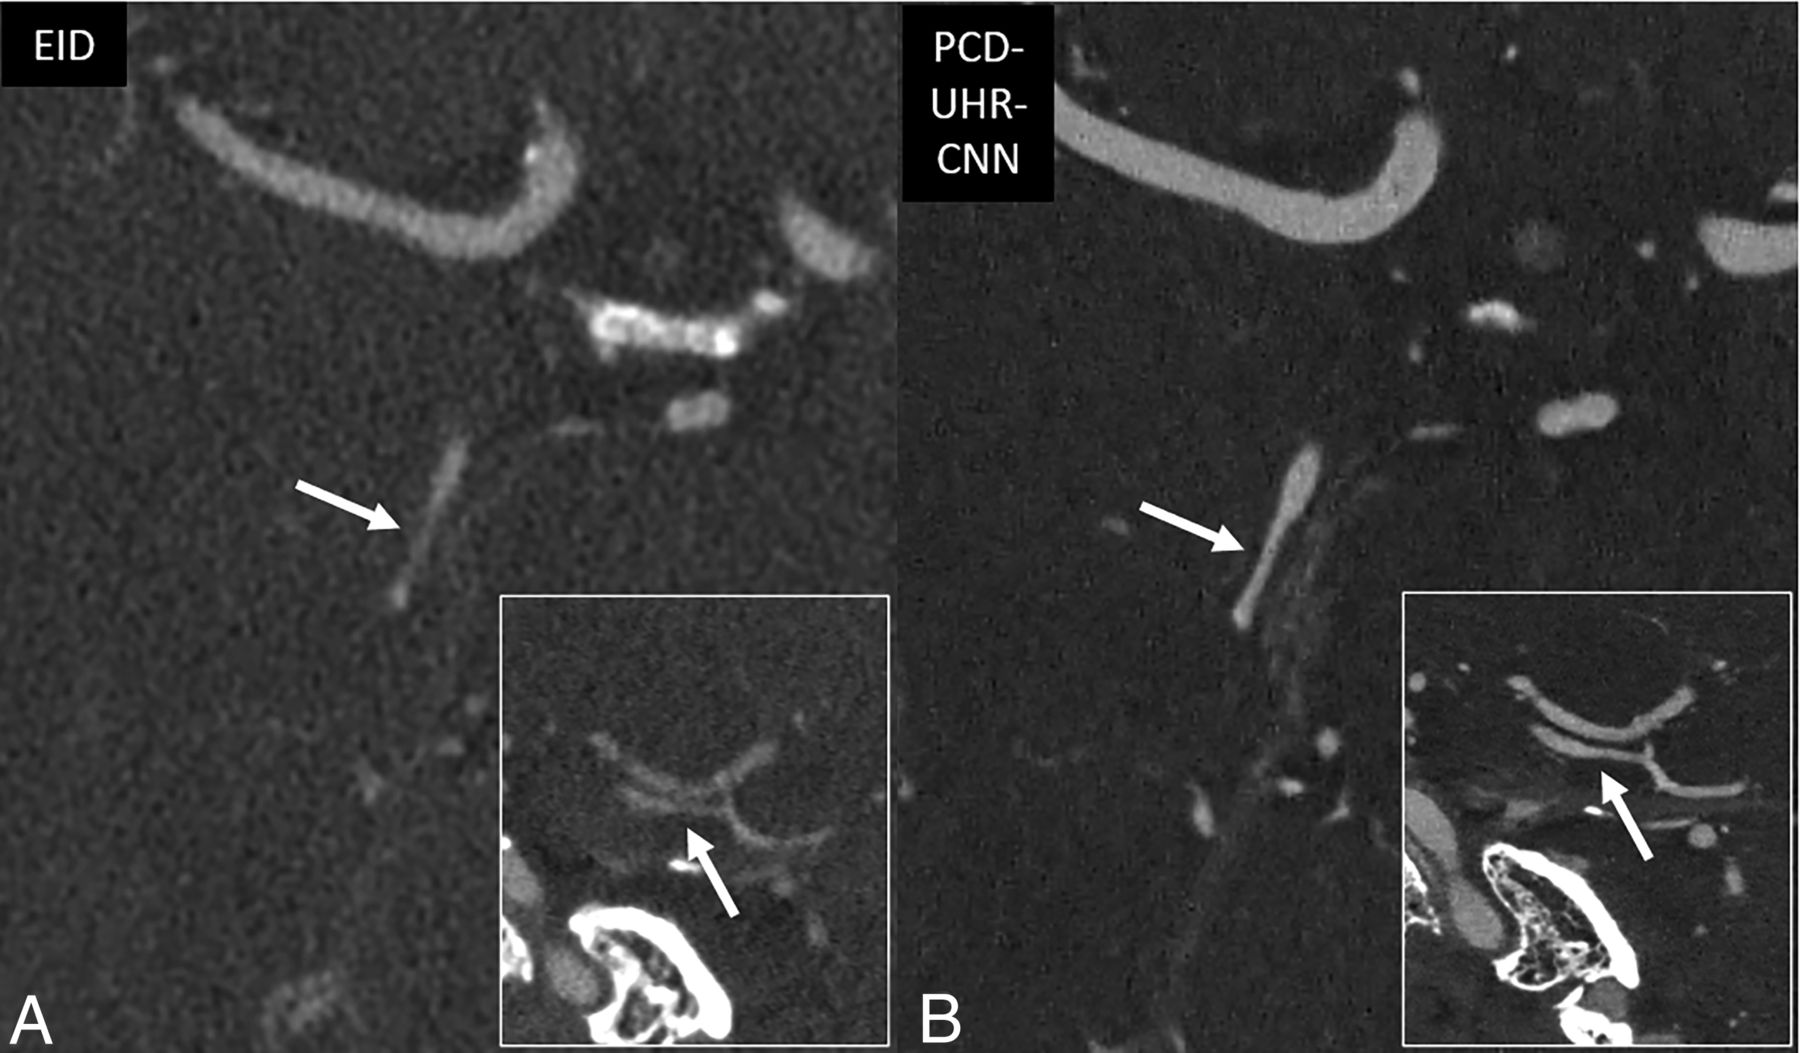
Improved characterization of arterial pathology on PCD-CT head CTA compared with EID-CT. Thin section oblique axial head CTA images by using EID-SR with 0.6-mm section thickness (A) and PCD-UHR-CNN CT with 0.2-mm section thickness (B) techniques. The diagnostic confidence for arterial pathology improves with PCD-SR matched to EID technique (not shown) and even more so with PCD-UHR-CNN CT at the thinnest section thickness. A right P2 segment stenosis has a relatively high-grade appearance on EID-CT (arrow in A). On PCD-CT, the stenosis is better demonstrated (arrow in B). The PCD-CT image depicts the stenosis as only mild to at most moderate in degree. The insets demonstrate the improved visualization of the right P2 stenosis in the oblique sagittal plane.
Iodine Contrast, Noise, and CNR Quantitative Analysis
The results of the iodine contrast (Hounsfield unit [HU]), noise (HU), and CNR quantitative analysis are provided in Fig 4A–C, respectively. The image noise averaged across all 4 locations (bilateral distal ICA and bilateral midcervical ICA) was higher for PCD-UHR-CNN (45.6 HU) compared with EID-SR (24.5 HU) and PCD-SR (18.4 HU), P < .001 (Fig 4B). Noise across all 4 regions and measurements was 24.9% lower for PCD-SR when compared with EID-SR (PCD-SR: 18.4 ± 4.5 HU; EID-SR: 24.5 ± 5.4 HU) at matched CTDIvol and spatial resolution. Meanwhile, CNR averaged across all 4 regions was lowest for PCD-UHR-CNN (13.8 ± 0.8), followed by EID-SR (17.6 ± 2.1) and PCD-SR (33.8 ± 2.8), P < .001 (Fig 4C).
DISCUSSION
This study demonstrates that a clinically approved PCD-CT system provided preferred image quality for head CTA imaging compared with EID-CT at similar radiation dose, at either matched technique or even more so by using an ultra-high spatial resolution of 0.2 mm combined with a CNN denoising algorithm. This preference for PCD-CT was maintained for various aspects of image quality, including for the evaluation of small arterial segments such as the ophthalmic, M3 (opercular), A3 (pericallosal), and P3 (quadrigeminal), and even for subjective evaluation of artifacts and noise. Moreover, diagnostic confidence of specific arterial pathology was higher for PCD-CT than EID-CT. In the case of the ultra-high resolution PCD-UHR-CNN images, these advantages of PCD-CT over EID-CT were demonstrated despite higher quantitative noise level and lower CNR. In other words, the benefits of extremely high spatial resolution outweighed the disadvantages of higher noise.
These results are promising because they demonstrate potential advantages gained by using PCD-CT technology for head CTA in clinical practice. They validate that a UHR approach can be used at similar radiation dose levels to EID-CT. When combined with a CNN denoising algorithm, such a state-of-the-art imaging technique can provide higher quality images that result in increased diagnostic confidence over EID-CT. For instance, being able to resolve whether a small arterial outpouching represents an incidental infundibulum or an aneurysm that requires follow-up has important patient care implications. Other clinical indications for head CTA could similarly benefit from the use of PCD-CT, including the evaluation of intracranial stenoses. Our study also provides optimism that this PCD-CT technology may be able to diagnose neurovascular disease with greater sensitivity and specificity, although that was not specifically proved herein.
Our study builds on the relatively small body of literature demonstrating benefits of PCD-CT for head CTA. Harvey et al9 showed that in theoretical and experimental phantom studies, a benchtop PCD-CT outperformed EID-CT in maximum intensity projection images of head CTA, with superior vessel conspicuity and a lesser degree of artifactual stenoses. The present study demonstrates improved vessel visualization on source images of clinical patients by using a clinically available PCD-CT. A recent review of detailed orbital arterial anatomy visualized on clinical PCD-CTA compared with EID-CTA provided additional evidence of the potential of high-resolution vascular imaging.8
Symons et al10 published the first in vivo results of PCD-CT in neuroarterial imaging. There are some similarities but also important differences between their carefully conducted study and the present work. Like our investigation, readers in that prior feasibility study rated the image quality as better for PCD-CT than EID-CT for the evaluation of various arterial segments. Quantitative noise measurements were also lower on PCD-CT at approximately matched dose. However, their study involved asymptomatic volunteers, while in the present study clinically indicated head CTAs were performed, and thus diagnostic confidence on arterial pathology (when present) could be analyzed. Their study examined a prototype PCD-CT system, by using a tube voltage of 140 kV compared with a 120 kV EID-CT scanner, with an estimated 10% higher dose for the PCD system. In contrast, voltage in our study was identical on PCD- and EID-CT (120 kV). Additionally, in the study by Symons et al,10 a slower than typical injection rate of 3 mL/s and a single injection for both examinations were used, varying across patients whether PCD-CT or EID-CT was performed first. In distinction, separate contrast injections were performed at a typical clinical rate of 4 mL/s in the present study. Moreover, the prior study utilized a PCD collimation of 0.5 mm, a section thickness of 1 mm for both PCD- and EID-CT, and a lower matrix size (512). In contrast, our study included UHR collimation of PCD (0.2 mm), section thicknesses of 0.2 mm and 0.6 mm for PCD-CT and 0.6 mm for EID-CT, and a higher matrix size (1024) for both detector types. While Symons et al10 focused on the larger extracranial and intracranial arteries, we analyzed only intracranial segments, including relatively small segments such as the ophthalmic, M3 (opercular), A3 (pericallosal), and P3 (quadrigeminal).
A CNN denoising method dedicated to UHR PCD-CT was used to reduce noise. The CT manufacturer also has a default noise reduction method available on the scanner (quantum iterative reconstruction [QIR]). Unpublished work at our institution has shown that our developed UHR-CNN denoising method has better overall image quality than the QIR method for the UHR mode and the sharpest quantitative kernel, Qr89. Therefore, we only compared the PCD-UHR-CNN with the EID-SR in this study. The PCD-UHR-CNN images still had the highest noise level and the lowest iodine CNR, even after CNN denoising. The reason for this is that the original PCD-UHR images have extremely high noise and the CNN denoising was designed to reduce image noise while maintaining the high spatial resolution. Therefore, the noise level in the PCD-UHR-CNN images was not reduced to the same level as that in either the PCD-SR or EID-SR images. Nonetheless, the ultra-high spatial resolution was shown to improve image quality and diagnostic confidence in this observer study. UHR-CNN was not applied to EID for 2 primary reasons. First, EID images at SR are not compromised by the markedly increased noise seen with PCD-UHR. Second, the study design already directly compares EID to PCD at matched spatial resolution.
We did not evaluate virtual monoenergetic images (VMIs). These can be performed on PCD-CT even when UHR imaging is performed (because PCD-CT acquisitions always include spectral data) and could potentially further improve the image quality of CTA. For example, a study by Dunning et al14 showed that for head and neck CTA performed on an investigational PCD-CT system, readers preferred VMIs of 45 keV over other energy levels. Similarly, a study by Spampinato et al15 demonstrated improved image quality (SNR and CNR) on head and neck CTA of VMIs at 70 keV and lower compared with polyenergetic images. It is therefore possible that our strongly positive results for PCD-CT may be an underestimation of the advantages it can provide. However, a prior study by Michael et al16 argues against this presumption. This showed that for CTA of the head and neck in clinical patients on a clinically available PCD-CT system, polyenergetic images were preferred over monoenergetic at the current state of the technology in 2021–2022. We also did not analyze radiation dose reduction potential on PCD-CT compared with EID-CT, or the possibility of reducing the volume of iodinated contrast material. Based on work in other imaging arenas, such as temporal bone, it is known that PCD-CT can provide comparable or even better image quality at considerable radiation dose reductions of upwards of 20%–30%.7 Future studies could evaluate the specific impact of these potential advantages of PCD-CT in head and neck CTA. Future work could also directly compare PCD-SR and PCD-HR-CNN, which was not the design or goal of the present study.
Other limitations of our study include the relatively small number of patients (n = 28). This is partially due to the inherent difficulty to consent patients for a second CT examination in addition to their clinical CT examination. Future work in this arena would ideally include larger sample sizes and multi-institutional, multireader study designs. The relatively short interval of a minimum of 14 days between reader review sessions introduces possible bias. However, the study design was not one in which readers were asked to diagnostically interpret examinations; rather, for the arterial findings, these were provided to the readers based on the separate identification by a third neuroradiologist, who used both the prior clinical reports from the EID-CT examinations and confirmatory EID-CT image review. Moreover, readers were blinded to the conditions of the image acquisition and postprocessing. We did not assess whether readers could predict if they were viewing the EID, PCD-SR, or PCD-UHR-CNN series. Indeed, given the significant improvement in image quality with PCD-CT, in at least some cases readers may have been aware that they were analyzing PCD images despite being blinded. There were technical differences in how PCD-CT and EID-CT images were processed (for example, the higher kernel strength and the CNN denoising algorithm used for PCD-UHR-CNN images), and we did not specifically evaluate the impact of each technical difference. However, this was not the goal of the study, and some technical factors were not available on EID-CT (such as the very strong kernels). While the differences in available technical parameters, such as section thickness and kernel, could introduce bias for PCD-CT over EID-CT, the study design not only compared EID- to PCD-CT by using the maximum achievable technique on the latter, but also by using closely matched technique.
CONCLUSIONS
PCD-CT provides higher quality head CTA images than EID-CT, both when the PCD technique is matched to the EID technique and when a UHR mode not available on the EID platform is used. There was reader preference for PCD images for both overall image quality and visualization of small arterial segments. The diagnostic confidence for the evaluation of arterial pathology was also improved by PCD-CT.
Footnotes
Felix E. Diehn has received travel reimbursement from Siemens Healthineers in the last 12 months.
Joel G. Fletcher is a recipient of a research grant to Mayo Clinic from Siemens Healthineers.
Cynthia H. McCollough is a recipient of a research grant to Mayo Clinic from Siemens Healthineers.
Disclosure forms provided by the authors are available with the full text and PDF of this article at www.ajnr.org.
References
- Received February 27, 2024.
- Accepted after revision May 1, 2024.
- © 2024 by American Journal of Neuroradiology


Jump to section
Related Articles
Cited By...
- No citing articles found.