
Abstract
BACKGROUND AND PURPOSE: Spontaneous intracranial hypotension is an increasingly recognized condition. Spontaneous intracranial hypotension is caused by a CSF leak, which is commonly related to a CSF-venous fistula. In patients with spontaneous intracranial hypotension, multiple intracranial abnormalities can be observed on brain MR imaging, including dural enhancement, “brain sag,” and pituitary engorgement. This study seeks to create a deep learning model for the accurate diagnosis of CSF-venous fistulas via brain MR imaging.
MATERIALS AND METHODS: A review of patients with clinically suspected spontaneous intracranial hypotension who underwent digital subtraction myelogram imaging preceded by brain MR imaging was performed. The patients were categorized as having a definite CSF-venous fistula, no fistula, or indeterminate findings on a digital subtraction myelogram. The data set was split into 5 folds at the patient level and stratified by label. A 5-fold cross-validation was then used to evaluate the reliability of the model. The predictive value of the model to identify patients with a CSF leak was assessed by using the area under the receiver operating characteristic curve for each validation fold.
RESULTS: There were 129 patients were included in this study. The median age was 54 years, and 66 (51.2%) had a CSF-venous fistula. In discriminating between positive and negative cases for CSF-venous fistulas, the classifier demonstrated an average area under the receiver operating characteristic curve of 0.8668 with a standard deviation of 0.0254 across the folds.
CONCLUSIONS: This study developed a deep learning model that can predict the presence of a spinal CSF-venous fistula based on brain MR imaging in patients with suspected spontaneous intracranial hypotension. However, further model refinement and external validation are necessary before clinical adoption. This research highlights the substantial potential of deep learning in diagnosing CSF-venous fistulas by using brain MR imaging.
ABBREVIATIONS:
- AUROC
- area under the receiver operating characteristic curve
- CET1
- contrast-enhanced T1-weighted
- CTM
- CT myelography
- DL
- deep learning
- DSM
- digital subtraction myelogram
- SIH
- spontaneous intracranial hypotension
- SLEC
- spinal longitudinal extradural fluid collection
Spontaneous intracranial hypotension (SIH) is a clinical condition that is usually caused by a spinal CSF leak.1 SIH is associated with substantial morbidity. Patients classically present with orthostatic headaches but may also suffer from symptoms such as tinnitus, dizziness, and, in severe cases, long-term disability or even coma.2 There are many subtypes of CSF leaks, though the role of CSF-venous fistulas has recently gained greater recognition.3 Much of this recognition has come from considerable progress in the diagnosis and treatment of CSF-venous fistulas, particularly with the rise of decubitus digital subtraction myelograms (DSMs) and the increased usage of decubitus CT myelography (CTM), which have led to the increased diagnosis of previously under-recognized CSF-venous fistulas.4
Multiple intracranial abnormalities have been reported on brain MR imaging in patients with SIH. These findings can largely be explained by the Monro-Kellie doctrine, in which the relative lack of CSF leads to a compensatory response in the brain parenchyma and vascular structures.5 Namely, the pituitary, dura, and dural venous sinuses engorge. In some cases, the brain also “sags,” displaying both decreased mamillopontine distance and effacement of the suprasellar and prepontine cisterns. Together, these findings have been used to make a probabilistic scoring system (the “Bern score”) in which the probability of identifying a CSF leak can be calculated based on the presence or absence of these findings.6
Despite these advancements, there is still a need for a more precise method by which to identify patients with CSF-venous fistulas by using brain imaging, as up to 19% of patients with SIH can have normal brain MR imaging.7 As of now, no deep learning (DL) algorithm has been specifically designed to analyze brain MRIs for this medical condition. This study aims to develop and internally validate such an algorithm (“SIHnet”) among a group of patients suspected to have SIH.
MATERIALS AND METHODS
Institutional review board approval was obtained for this retrospective study. The requirement for informed consent was waived.
Patient Cohort
A retrospective analysis was carried out, focusing on patients suspected of having SIH who underwent lateral decubitus DSM between December 30, 2021, and November 30, 2022. The exclusion criteria included the absence of pre-DSM brain MR imaging or substandard image quality. In addition, to focus on the SIH subpopulation associated with CSF-venous fistula, patients were excluded if a spinal longitudinal extradural fluid collection (SLEC) was noted on the pre-DSM spinal MR imaging. For any patients who had undergone a previous DSM (ie, before the study inclusion date), either 1) the initial DSM identified a CSF leak or 2) the first DSM performed at our institution (in patients for whom a CSF leak was not identified) and the most recent brain MR imaging preceding the DSM were used for analysis. The number of days between the pre-DSM brain MR imaging and analyzed DSM was recorded.
Digital Subtraction Myelography and CT Myelography Technique
Our previously described DSM technique8 spanned 2 days, with patients being positioned first in the right lateral decubitus position and subsequently in the left. DSMs were performed using biplane fluoroscopy machines, specifically, either the Artis Icono system (Siemens Healthineers) or the Allura Xper system (Philips Healthcare), with most cases using only a single anteroposterior plane. Patients were placed on a wedge-shaped cushion on a tiltable table such that their hips were higher than their shoulders. A 20- or 22-gauge spinal needle was inserted into the thecal sac, usually at the L2–3 or L3–4 level. Each side underwent 2 distinct DSM acquisitions, with one focusing on the upper spine and the other on the lower. A total of 11 mL of intrathecal Omnipaque 300 (GE Healthcare) was used. Post-DSM, the patients were transferred to a CT scanner for a full-spine same-side lateral decubitus CTM, which was conducted on a dual source Somatom Flash scanner (Siemens Healthineers). Both the DSM and the CT myelogram were analyzed as parts of a unified diagnostic assessment.
MR Brain Imaging Protocol
Brain MRIs were performed by using either 1.5T or 3T scanners. Most image analyses relied on fat-saturated postcontrast 3D T1 fast spin echo sequences (TR = 600 ms, TE = 7.2 ms, flip angle = 120°, section thickness = 1 mm, FOV = 250 × 250 mm2).
Image Analysis
Four neuroradiologists (I.T. M., A.A.M., J.C.B., and J.T.V.) with 2–8 years of posttraining subspecialty expertise in interpreting neuroradiologic examinations reviewed the DSM and pre-DSM MR brain images, with the entire cohort being split evenly among the reviewers. The reviewers were blinded to clinical information but not to the official reports or annotations in the picture archiving and communication system. Each reviewer independently evaluated all DSMs for the presence or absence of an identified CSF leak (specified as positive, negative, or indeterminate). MR imaging brain scans were assessed for multiple potential stigmata of SIH that must be measured to determine a Bern score, including the engorgement of venous sinuses, pachymeningeal enhancement, suprasellar cistern height, subdural fluid collection, prepontine cistern width, and mamillopontine distance. The Bern score was determined for each patient, and its discrimination performance was evaluated by calculating the area under the receiver operating characteristic curve (AUROC).
Data Set Splitting
Participants whose DSM studies demonstrated an absence or definitive presence of CSF-venous fistula were included in the study. The data were split into 5 folds at the patient level by using the GroupKfold module from the scikit-learn package, version 1.2.0. Cross-validation of the final model was performed on all 5 groups to determine the robustness of the results.9
Data Preprocessing and Model Development
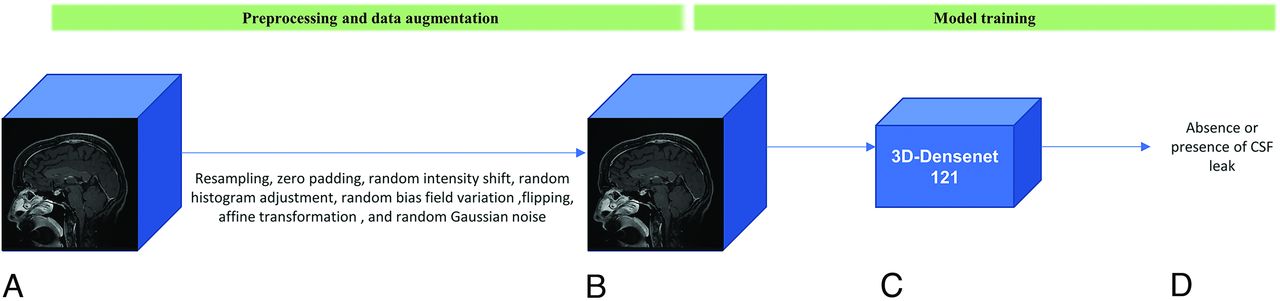
Initially, for CSF-venous fistula detection, the process involved converting 2D sagittal contrast-enhanced T1-weighted (CET1) images from the DICOM format to the 3D Neuroimaging Informatics Technology Initiative format. Subsequently, the MR images were resampled to possess voxel dimensions of 1 × 1 × 1 mm through trilinear interpolation. To satisfy image size uniformity, the images were zero-padded to dimensions of 240, 260, and 260 voxels, corresponding to the largest dimensions observed across the data set.10 To prevent overfitting, a range of data augmentation techniques were applied.11 These encompassed random intensity shifts, random histogram adjustments, random bias field variations, flipping, random affine transformations, and random Gaussian noise. For further descriptions of these techniques, refer to the Online Supplemental Data.
We used a 3D-DenseNet-121 classifier sourced from the MONAI package (version 1.1.0), which showed promising results in classification tasks dealing with 3D medical imaging volumes.10,12,13 DenseNet, a convolutional neural network, uses convolutions to extract meaningful information while connecting each layer to every other layer in a feed-forward manner. Within the architecture of DenseNet, a 1 × 1 convolution was introduced before each convolution layer to serve as a bottleneck layer to trim the count of feature mappings.14 This approach to dimension reduction, implemented through both bottleneck layers and transition layers within each attenuated block, contributes to enhanced parameter efficiency and a reduction in model complexity. This design choice aids in mitigating the risk of overfitting. To enhance the model’s generalizability and mitigate overfitting, we used the AdamW optimizer with a batch size of 4 and a weight decay of 0.1.15 This choice of optimizer integrates weight decay as a regularization technique. The scheduler started with an initial learning rate of 0.001 and ran for 450 epochs, and this was followed by a restart interval of 200 epochs. This approach was adopted to circumvent potential issues with converging to local minima.16 Figure 1 illustrates the schematic pipeline for preprocessing and training.

Schematic illustration of the preprocessing, data augmentation, and model training pipeline. A, 3D contrast-enhanced T1 input volume. B, Preprocessed and augmented CET1 to mitigate overfitting. C, 3D-DenseNet model. D, Prediction of absence or presence of CSF leak.
To handle the slight class imbalance in the data set, we utilized a weighted cross-entropy loss function and assigned reverse class ratios as weights to the positive and negative classes to more effectively address the imbalance.17 The model weights from the epoch with the greatest AUROC, indicating the highest discriminative value, were saved for every fold.18 In addition to each fold, the mean and standard deviation of the AUROC across the folds were reported.
Occlusion Interpretation Maps
In our study, we used an occlusion interpretation technique to investigate the significance of different regions within 3D CET1 volumes for model predictions. This approach systematically replaces portions of the input volume with zeros and measures the impact on the model’s output logits to identify the most influential regions in the CET1 volume for the model’s decision-making process. A 3D patch with a shape of 12 × 13 × 13 was slid across the input CET1 volume, and the change in the model’s prediction score for the target label was recorded at each step. These changes were accumulated to form an occlusion map, which served as a visual interpretation tool. The stride for moving the patch through the input CET1 volume was set to 12 × 13 × 13, ensuring a comprehensive yet computationally efficient exploration of the 3D volume space.
Our model training was conducted on a cluster comprising 4 NVIDIA A100 GPUs. All image processing and model development were performed using PyTorch 1.12.0 and MONAI 1.1.0 with Python 3.10.4 on a GPU cluster of 4 GPUs (NVIDIA A100). All statistical analyses were performed using scikit-learn 1.2.0.
RESULTS
There were 129 patients were included in this study. The median age was 54 years (interquartile range = 20 years). There were 66 (51.2%) patients with and 63 (48.8%) patients without CSF-venous fistula. Patient demographics and brain MR imaging Bern scores are summarized in Table 1.
Participant characteristics and Bern score status
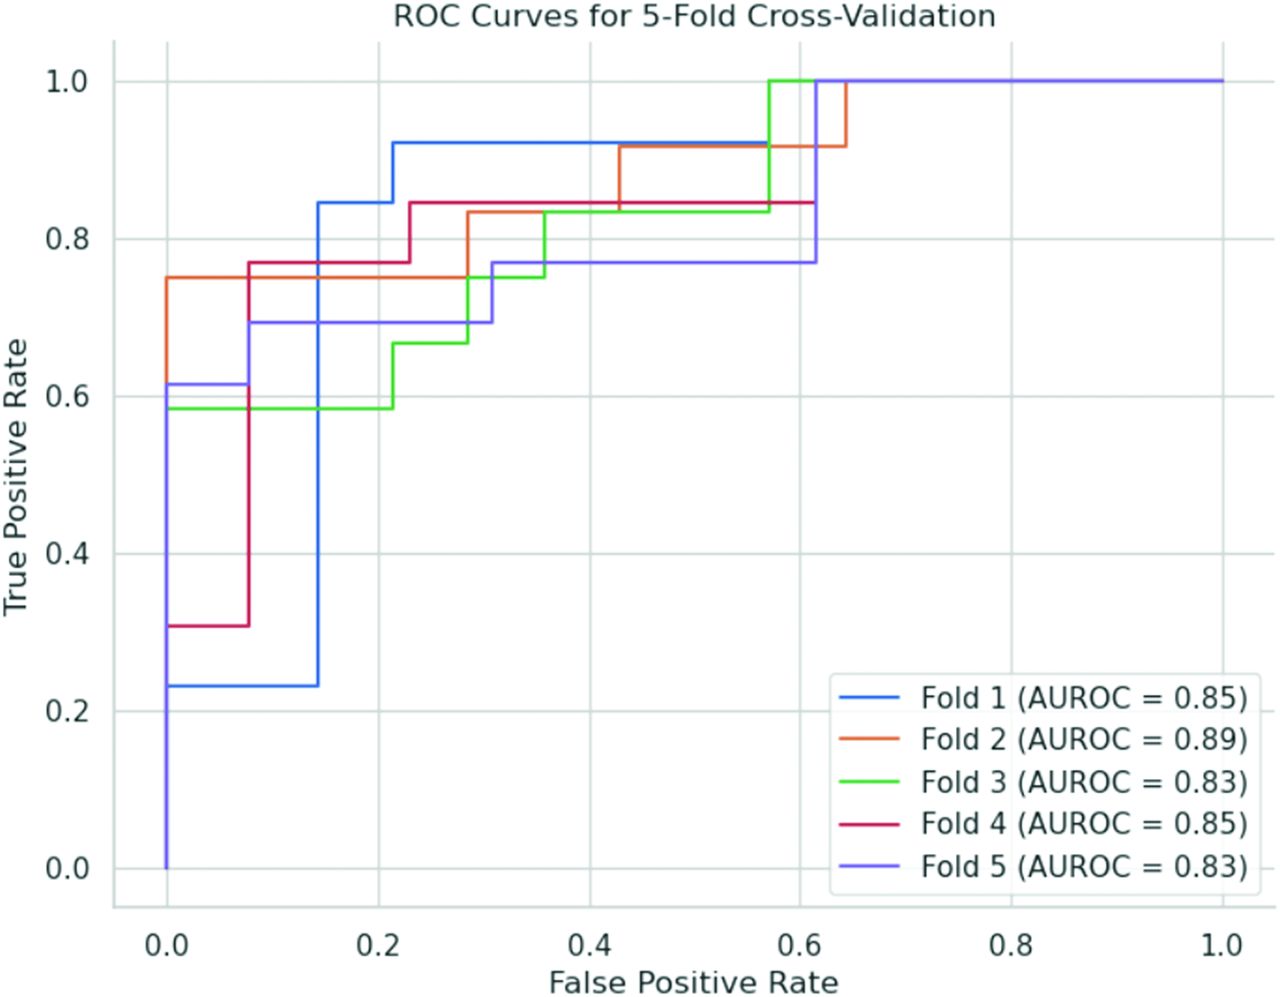
The AUROC for the Bern score, which is used to differentiate between patients with CSF-venous fistula and those without a leak, was 0.8. The classifier demonstrated an average AUROC of 0.8668, with a standard deviation of 0.0254 across the folds, in determining the positive and negative cases of CSF leaks. Table 2 and Figure 2 summarize the model performance on each fold.

Receiver operating characteristic (ROC) curves for 5-fold cross-validation. Each curve represents the performance of the model on a distinct validation fold. The curves demonstrate the model’s ability to distinguish between the absence and presence of CSF leaks from brain MR imaging scans.
Summary of classifier performance per validation fold
Figure 3 illustrates the occlusion map, highlighting the key regions upon which the model relies for its decision-making process.

Three-part representation of the regions that are crucial to the model’s decision-making process in detecting CSF leaks. A, Sagittal view of contrast-enhanced T1 brain MR imaging. B, Occlusion mask overlaid on the original contrast-enhanced T1 image, highlighting the regions that significantly influence the model’s predictions. C, Occlusion mask generated to identify regions of interest.
DISCUSSION
The present study set out to develop and internally validate a DL algorithm capable of identifying patients in whom DSM could localize a spinal CSF leak in the context of suspected SIH, based on sagittal CET1 brain MR imaging. The results indicate that the algorithm created in this study had a classifier with an average AUROC of 0.8668, surpassing the discriminative ability of the Bern score and indicating a promising level of performance.
The algorithm developed in this study has the potential to substantially impact the ability of clinicians to identify patients who would benefit from DSM imaging in the context of suspected SIH. Specifically, this algorithm could serve as a preliminary screening tool to aid both neurologists and neuroradiologists in the assessment of patients with clinically suspected SIH. By identifying which patients are considered likely to have a CSF-venous fistula identified on subsequent imaging, clinicians could use this tool to better select who should undergo additional invasive testing, such as DSM or dynamic CTM imaging. Thus, the algorithm has the potential to both streamline the diagnostic process and reduce health care costs by minimizing the occurrence of unnecessary tests.
In addition, the results presented here are the first of their kind. While machine learning has made considerable strides in neuroradiology, there is a notable gap in its application for the diagnosis and prognosis of CSF leaks.19 A study by Fu et al20 used DL to quantify spinal CSF in whole-spine MR myelography. However, their focus was on a different aspect of CSF analysis, leaving a critical void in the utilization of machine learning for CSF leak diagnosis. Arnold et al21 extracted radiomics features from brain MR imaging and then trained a support vector machine to discriminate between patients with SIH and healthy controls. These results underscore the significance of the current study, which aims to address this unexplored area by applying end-to-end deep learning methods, specifically for the diagnosis of CSF leaks.
Over recent years, there has been considerable progress in our knowledge and diagnostic understanding of SIH and CSF leak imaging. Throughout these gains, the Bern score has remained a steadfast metric that is widely used to predict which patients with suspected SIH may have a spinal CSF leak.6 Nevertheless, the Bern score does have some limitations.22 It is heavily dependent on sub-mm measurements, which are imperfect on the PACS systems of most institutions. In addition, the cohort used for analysis in the initial Bern score study was composed entirely of patients with “fast” CSF leaks, meaning those that are accompanied by a SLEC. However, it is now known that a substantial percentage of patients with SIH lack a SLEC. CSF leaks in such patients, if found, are often CSF-venous fistulas. The current study sought to address this gap in knowledge by using a cohort of patients without a SLEC on pre-DSM spinal MR imaging.
Interestingly, the occlusion maps produced by this study’s algorithm revealed SIHnet’s tendency to allocate greater weights to the superior and posterior regions of the brain. This allocation does not fully align with the established Bern criteria, which place greater emphasis on the brainstem, suprasellar cistern, and adjacent anatomic structures. Nevertheless, it is crucial to interpret these results judiciously. Occlusion maps and other interpretation methodologies are not definitive tools for understanding the underlying decision-making process of a model. While they may not elucidate “which” features are considered essential by a model, they do potentially indicate “where” the model is focusing its attention. Despite this limitation, the model may discern brain sagging by focusing on extracted information from the superior and posterior parts of the brain. It could potentially evaluate features such as pachymeningeal enhancement, venous engorgement, and subdural collections, as well as the dural geometry in these areas, and these could be evaluated in a quantitative manner rather than via a simple qualitative assessment of their presence or absence. The insights derived from interpretation maps could still be valuable for identifying imaging biomarkers in future studies.23,24
Our study is not without limitations. Most notably, the algorithm was trained and validated by using retrospective data from a single institution, albeit using multiple MR imaging scanner models and protocols. To generalize the applicability of our model, it is crucial to externally validate it by using data sets from various institutions with diverse imaging protocols. In addition, only patients without a SLEC were included in the final patient cohort. Additional validation by using patients with both “slow” and “fast” CSF leaks will be needed to allow for greater generalizability of the results generated here.
CONCLUSIONS
This study developed and internally validated a DL algorithm to identify patients with a CSF leak based on brain MR imaging findings. The algorithm yielded a promising level of performance, but further refinement and external validation are required prior to its clinical adoption.
Footnotes
Disclosure forms provided by the authors are available with the full text and PDF of this article at www.ajnr.org.
References
- Received September 27, 2023.
- Accepted after revision December 12, 2023.
- © 2024 by American Journal of Neuroradiology


