
Abstract
BACKGROUND AND PURPOSE: DTI has shown increased MD of water molecules in the brain of patients with cirrhosis, consistent with low-grade edema. This study further characterizes this edema by using biexponential analysis of DTI data, a technique that may differentiate cytotoxic and vasogenic edema.
MATERIALS AND METHODS: A total of 41 patients with cirrhosis awaiting liver transplantation and 16 healthy controls were studied by DTI by using a single-shot echo-planar technique with 11 b-values (range, 0–7500 s/mm2) and 6 noncollinear directions. Measurements were fitted to biexponential function to determine MD and FA for the fast and slow diffusion components. Regions of interest were selected in the parietal white matter and corticospinal tract. The assessment was repeated 1 year after liver transplantation in 24 of these patients.
RESULTS: In parietal white matter, patients with cirrhosis showed an increase in fast MD and a decrease in fast FA that normalized after liver transplantation. In the corticospinal tract, there was an increase in fast and slow MD that normalized after transplantation, and a decrease in FA that persisted posttransplantation. There was no association of DTI parameters with minimal HE (n =12).
CONCLUSIONS: Biexponential analysis of DTI supports the presence of edema in the brain of patients with cirrhosis that reverts after transplantation. In parietal white matter, the increase in brain water was mainly located in the interstitial compartment, while the corticospinal tract showed a mixed pattern (intra- and extracellular). In addition, the findings on posttransplantation were consistent with microstructural damage along the corticospinal tract.
Abbreviations
- ADC
- apparent diffusion coefficient
- DTI
- diffusion tensor imaging
- DWI
- diffusion-weighted imaging
- FA
- fractional anisotropy
- HCV
- hepatitis C virus
- HE
- hepatic encephalopathy
- MD
- mean diffusivity
DWI is a noninvasive technique that examines the microscopic random translational motion of water molecules in a fluid system driven by their internal thermal energy.1 In the central nervous system, diffusion is influenced by the microstructural components of tissue, including cell membranes and organelles. Hence, the diffusion coefficient of biologic tissues measured by DWI is lower than the diffusion coefficient in free water; this is called the ADC.2 In clinical practice, DWI is of great value for assessing patients with cerebral ischemia,3 and it may be possible to extend the use of this technique to a wide variety of other neurologic conditions.
DTI provides more detailed information of the movement of water molecules.4 White matter tracts are aligned on the scale of an MR image pixel, and the ADC value is sensitive to the direction of the diffusion-sensitizing gradient. Diffusion measurements can give information about the size, shape, integrity, and geometry of white matter tracts.5 A measure of diffusion that does not depend on the orientation of the structures examined is provided by the MD. 3D characterization of diffusion can be obtained in terms of a tensor, a 3 × 3 matrix that accounts for the correlation existing between molecular displacements along orthogonal directions.6 From the DTI data, it is possible to derive anisotropy indexes, such as FA, which represent a measure of intravoxel fiber coherence in clinical DWI.
Diffusion sensitization is often carried out by using a b-value of 1000 s/mm2. The signal-intensity attenuation resulting from water self-diffusion in vivo follows a monoexponential function with this b-value.7 However, it has been shown that when b-values above 1000 s/mm2 are used, the signal-intensity attenuation is better fitted to a biexponential function.8,9 Different models have been proposed to explain the nonmonoexponential behavior of the water signal intensity at high b-values.10 Some of these models try to associate this behavior with extracellular and intracellular compartments. An alternative model recently proposed suggests that the biexponential model assumes an exchange of water between 2 pools, known as the “slow” and “fast” diffusion pools. According to this model, the slow diffusion pool comprises water that interacts by electrostatic forces with the proteins, cytoskeleton, and membranes of the cell, whereas the fast diffusion pool consists of the remaining water in the intracellular or extracellular space.11 Although the exact pathophysiologic meaning is not known, several works dealing with the existence of cytotoxic or vasogenic edema show different behavior of the variables associated with the biexponential model.
HE is a complication of acute and chronic liver failure that has been associated with a rise in brain water.12 The development of brain edema may be explained by an increase in blood-brain barrier permeability that leads predominantly to extracellular edema (vasogenic) or to accumulation of water in the astrocytes due to osmotic mechanisms or oxidative stress (cytotoxic). In experimental models of acute liver failure, DTI shows a decrease in MD, which is in accordance with a cytotoxic mechanism.13 In contrast, studies in patients with chronic liver failure show an increase in MD, which has been interpreted as a rise of water in the extracellular compartment.14,15 Furthermore, the outcome of ADC following HE has been interpreted as a mixed pattern of brain edema.16
The aim of this study was to analyze brain white matter changes by biexponential analysis of diffusion tensor data in patients with cirrhosis and chronic liver failure to further characterize the presence of edema in these patients. The regions that were selected correspond to those that have been identified as abnormal in previous studies (parietal white matter and the corticospinal tract).17,18 The results were analyzed in relation to the presence of cognitive disturbances (minimal HE), and the study was repeated in a group of patients after successful liver transplantation. In addition, to assess the usefulness of biexponential analysis, we compared the results with those obtained with a monoexponential analysis, by using an extended range of b-values.
Materials and Methods
Patient Characteristics
Consecutive patients with cirrhosis undergoing evaluation for liver transplantation at our institution were invited to participate in the study. Forty-one patients without overt signs of HE were included, and 24 of them were studied again 1 year (358 ± 47 days) after liver transplantation (Table 1). Patients with a history of alcohol abuse were abstinent for a period of at least 6 months before the study. All patients underwent the standard assessment of liver function and comorbidities with the determination of clinical and biochemical parameters. The severity of liver failure was estimated with the Child-Pugh score (range, 5–15): mild (Child-Pugh A:, 5–6), moderate (Child-Pugh B, 7–10), and severe (Child-Pugh C, 11–15).
Clinical characteristics of patients with cirrhosis included in the baseline and longitudinal study, prior to liver transplantation
All participants (except 3 patients for logistic reasons) completed a battery of neuropsychological tests. The tests assessed memory (Auditory Verbal Learning Memory Test), attention, speed of information processing (Trail A, Symbol Digit Test), psychomotor function (Grooved Pegboard), executive function (Controlled Oral Word Association Test), and visuoperceptual function (Hooper Visual Organization Test, Judgment of Line Orientation test). The scores for each test were transformed into T values and were adjusted by age, sex, and educational level, as described by Mínguez et al.19 Patients with ≥2 test values below 2 SDs of the mean (T < 30) were diagnosed as having minimal HE.20
Sixteen healthy volunteers (6 men/10 women; age, 53 ± 7 years of age) were recruited to form a control group and underwent MR imaging to obtain normal values. None had any history of neurologic illness, alcohol or drug abuse, or liver disease.
The study was approved by the ethics committee of our institution, and informed consent was obtained from participants before they were included in the protocol.
MR Imaging Protocol
MR imaging was performed on a 1.5T Symphony Quantum Maestro Class scanner (Siemens, Erlangen, Germany) equipped with a circular polarized receiver head array coil, with the body coil acting as a transmitter.
The conventional MR imaging protocol included proton attenuation and T2-weighted fast spin-echo (TR/TE/acquisitions/echo-train length, 3550 ms/14–86 ms/1/5) and T1-weighted spin-echo (TR/TE/acquisitions, 650 ms/17 ms/1) sequences. A total of 46 contiguous transverse sections with a thickness of 3 mm, a pixel size of approximately 1 × 1 mm, an FOV of 250 mm, and an acquisition matrix of 256 × 256 were used to obtain images.
DTIs were acquired by using a single-shot echo-planar sequence (TR/TE/acquisitions, 1100 ms/145 ms/10) with gradients applied in 6 noncollinear directions and 11 b-values (range, 0–7500 s/mm2). Images were obtained in 5 axial sections centered about 2 cm above the bicommissural line with a section thickness of 4 mm and an intersection gap of 2 mm, an FOV of 250 mm, and an acquisition matrix of 64 × 64, which gives an in-plane resolution of 3.9 × 3.9 mm. Acquisition time of the DTI sequence was 11 minutes 14 seconds.
MR Imaging Analysis
DTI data were analyzed on a Linux Sun Fire X4100 (Sun Microsystems, Santa Clara, California) server with two 2.4-GHz dual-core Opteron processors (AMD, Sunnyvale, California) and 4 GB of RAM by using in-house software written in C programming language. Briefly, after the images were interpolated to 128 × 128 by using a high-resolution cubic spline function, noise reduction was performed by using an algorithm based on the scheme described by Gudbjartsson and Patz21 and distortion was corrected considering maximization of mutual information22 between each gradient image and the non-diffusion-sensitized image (b = 0 s/mm2) for each section by using the Nelder and Mead simplex algorithm.23
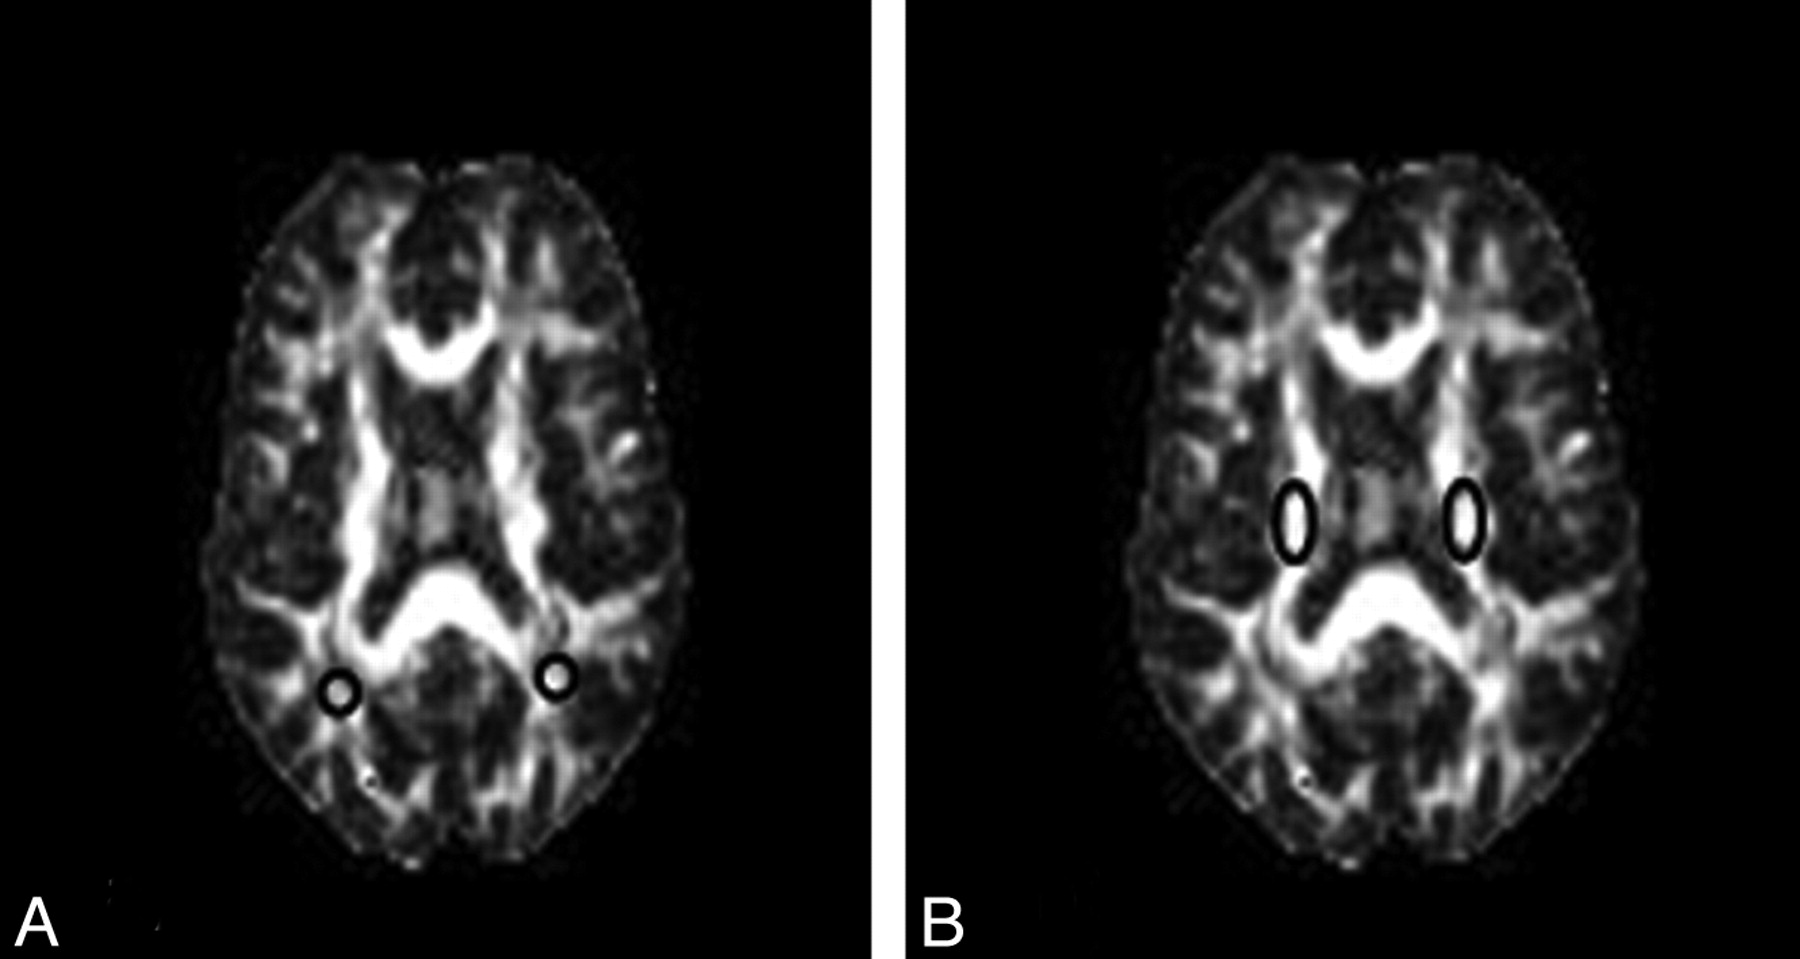
The analysis was made from regions of interest within the corticospinal tract and parietal white matter. Regions of interest (10–15 pixels) were delineated by using a MRIcro viewer (http://www.sph.sc.edu/comd/rorden/mricro.html)24 by visual inspection of the non-diffusion-sensitized images and FA maps for each section. Four different supratentorial locations were then identified in each axial section (Fig 1).

The 4 different supratentorial locations identified in an axial section of FA maps used in the biexponential analysis. A, Regions of interest of parietal white matter. B, Regions of interest of corticospinal tract.
Brain signal-intensity decay was studied on the basis of a monoexponential and biexponential fitting approach, by using 11 b-values from 0–7500 s/mm2.
Monoexponential fitting was obtained according to the following expression:
where S is the b-dependent signal intensity in the image, S0 is the signal intensity in absence of diffusion sensitization, bij is the i, jth component of the diffusion-weighting b-matrix, Dij is the i, jth component the diffusion tensor, and i, j =x, y, z.
The nonlinear equation system obtained from equation 1, with the 11 b-values and 6 gradient directions, was solved by fitting S0, and Dij by using Lourakis' implementation25 of the Levenberg-Marquardt optimization algorithm. Next, the diffusion tensor was diagonalized to obtain eigenvalues and eigenvectors. The eigenvalues were then used to compute the FA and MD with the following expressions:
The biexponential model contemplated the fast and slow water diffusion components as follows:

where S is the b-dependent signal intensity in the image; S0fast and S0slow are the signal intensities (T2-weighted) in the absence of diffusion sensitization, corresponding to fast and slow components, respectively; bij is the i, jth component of the diffusion-weighting b-matrix; Dijfast and Dijslow are the i, jth components of the diffusion tensor associated with fast and slow components, respectively; and i, j =x, y, z.
As in monoexponential analysis, the nonlinear equation system obtained from equation 4 was solved by fitting the parameters S0fast, S0slow, Dijfast, and Dijslow. Eigenvalues and eigenvectors for both components were then obtained by diagonalization of the fast and slow diffusion tensor components. FA, relative signal intensity components (frfast and frslow), and MD were computed from the eigenvalues for each component as follows:
Statistical Analysis
Values are expressed as the mean ± SD. Significant differences between intergroup data were verified with the Mann-Whitney U test, and comparisons between continuous variables were carried out with the Wilcoxon W test. P values < .050 were considered statistically significant. All statistical analyses were performed with the Statistical Package for the Social Sciences, Version 11.5 software (SPSS, Chicago, Illinois).
Results
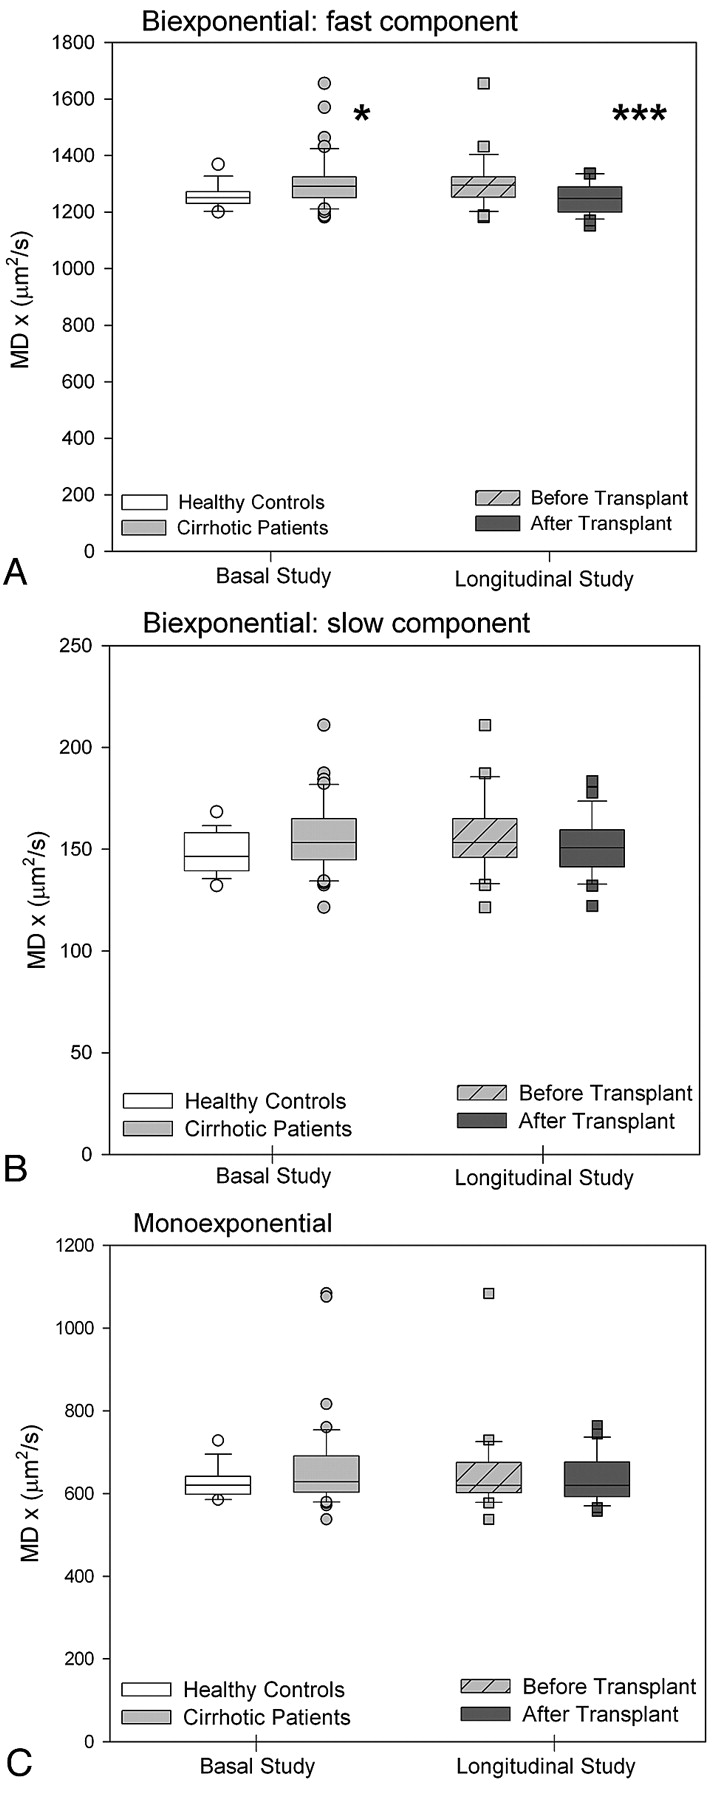
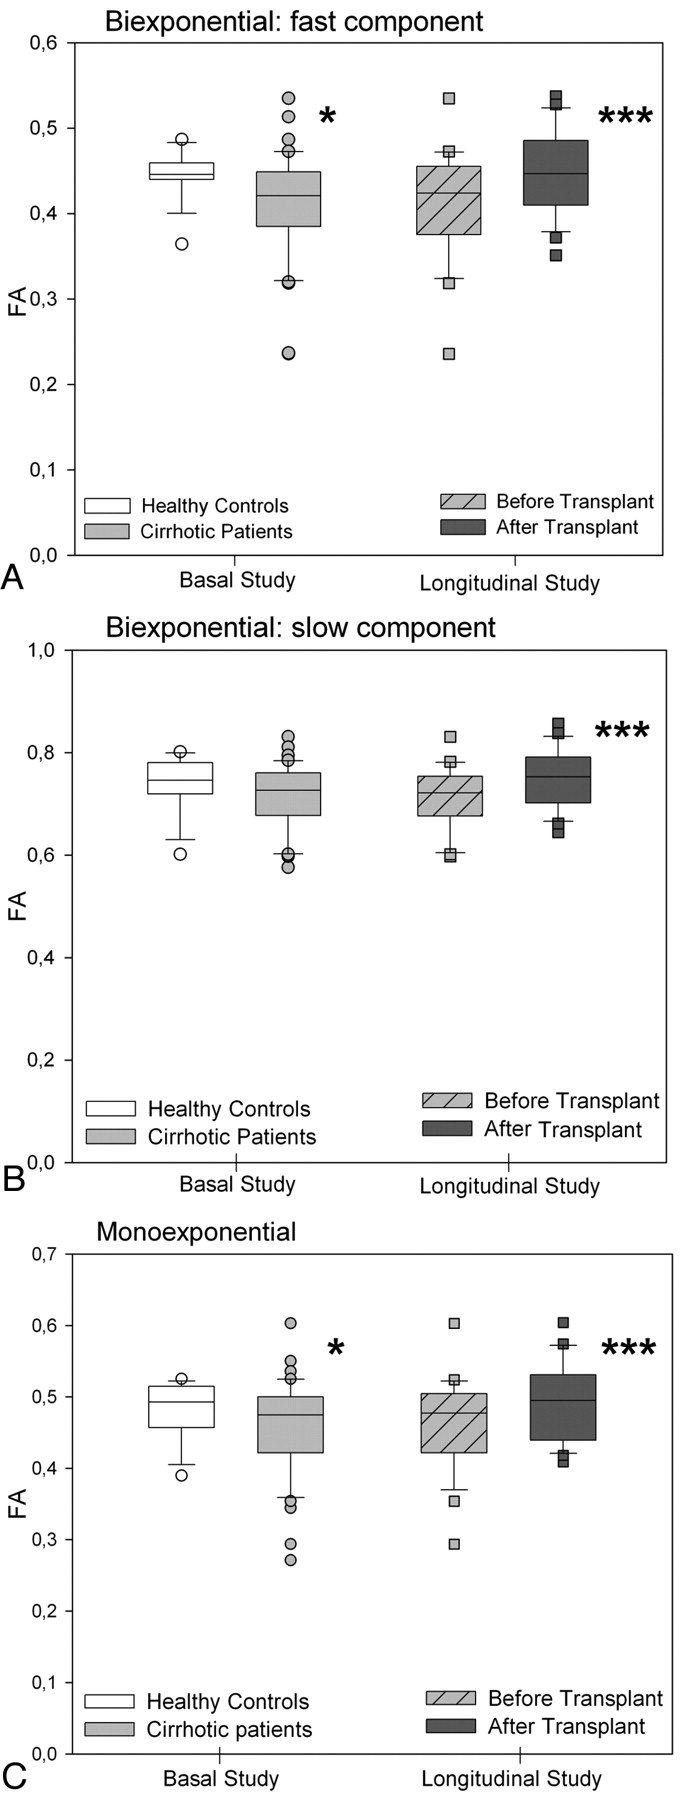
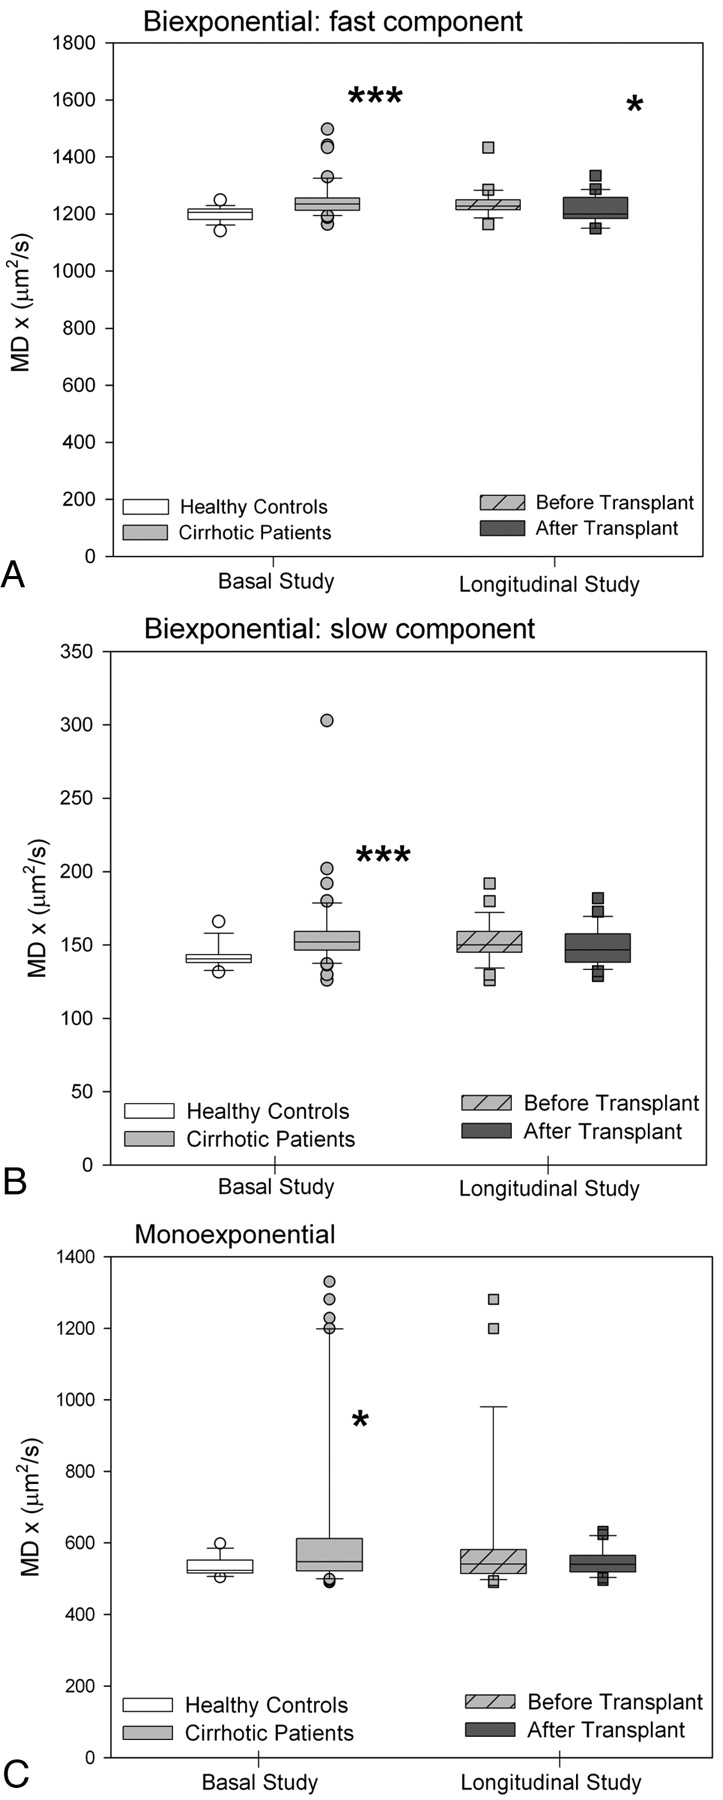
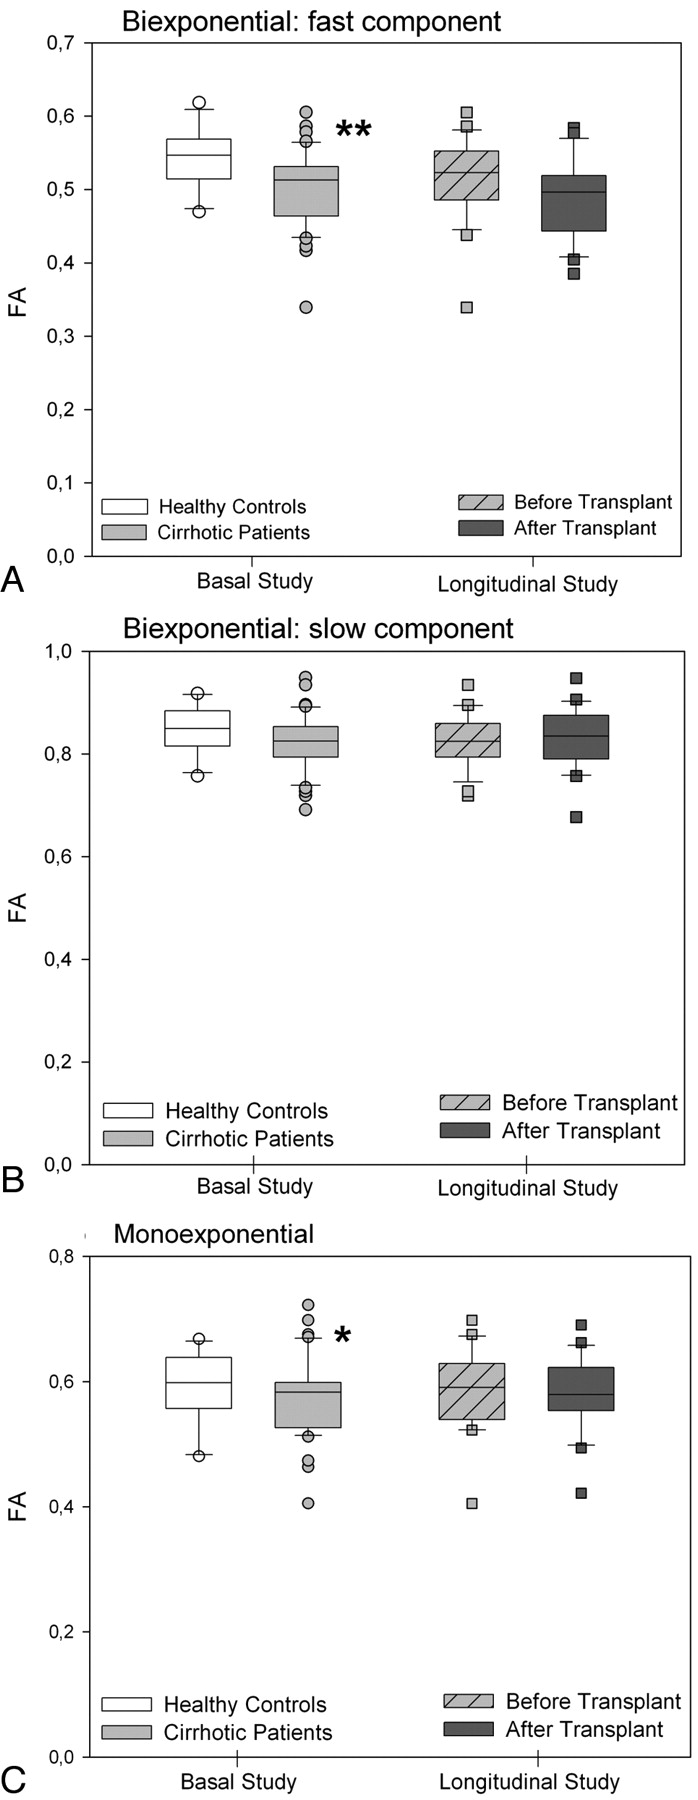
In the parietal white matter of patients with cirrhosis, DTI with biexponential fitting detected an increase in the MD for fast diffusion, which returned to normal after liver transplantation (controls: 1251 ± 48 μm2/s versus posttransplantation: 1250 ± 52 μm2/s; P =.863) (Fig 2A). In addition, patients with cirrhosis showed a decrease in FA that increased after liver transplantation (Fig 3A). There was a trend to a similar pattern in the MD and FA for slow diffusion (Figs 2B and 3B), but significant differences were only found in the slow FA before and after liver transplantation. In the monoexponential fitting for MD (Fig 2C) and FA (Fig 3C), significant differences were also found only for FA before and after transplantation.

MD values (square micrometers per second) of parietal white matter by using biexponential fitting. A, Fast component. B, Slow component. C, Monoexponential fitting in patients with cirrhosis (n =41) compared with controls (n =16) and in the subgroup of patients with cirrhosis who underwent liver transplantation (n =24, before and after liver transplantation). Single asterisk indicates P < .050; and triple asterisk, P < .001 between cirrhosis and controls (Mann-Whitney U) and in paired comparisons of patients with cirrhosis before and after liver transplantation (Wilcoxon W).

FA values (ratio) of parietal white matter by using biexponential fitting. A, Fast component. B, Slow component. C, Monoexponential fitting in patients with cirrhosis (n =41) compared with controls (n =16) and in the subgroup of patients with cirrhosis who underwent liver transplantation (n =24, before and after liver transplantation). Single asterisk indicates P < .050; and triple asterisk, P < .001 between cirrhosis and controls (Mann-Whitney U) and in paired comparisons of patients with cirrhosis before and after liver transplantation (Wilcoxon W).
In the corticospinal tract of patients with cirrhosis, an MD increase was observed for both fast (Fig 4A) and slow diffusion (Fig 4B). The FA exhibited a significant decrease only in the fast FA (Fig 5A). However, after liver transplantation, only the fast MD returned to normal (Fig 4A) (controls: 1190 ± 8 μm2/s versus posttransplantation: 1218 ± 48 μm2/s; P =.127). A persistent decrease was seen in the fast component of FA (controls: 0.545 ± 0.044 versus posttransplantation: 0.490 ± 0.054; P =.001) (Fig 5A). The monoexponential fitting also showed an increase in MD (Fig 4C) with a decrease in FA (Fig 5C).

MD values (square micrometers per second) of the corticospinal tract by using biexponential fitting. A, Fast component. B, Slow component. C, Monoexponential fitting in patients with cirrhosis (n =41) compared with controls (n =16) and in the subgroup of patients with cirrhosis who underwent liver transplantation (n =24, before and after liver transplantation). Single asterisk indicates P < .050; and triple asterisk, P < .001 between cirrhosis and controls (Mann-Whitney U) and in paired comparisons of patients with cirrhosis before and after liver transplantation (Wilcoxon W).

FA values (ratio) of the corticospinal tract by using a biexponential fitting. A, Fast component. B, Slow component. C, Monoexponential fitting in patients with cirrhosis (n =41) compared with controls (n =16) and in the subgroup of patients with cirrhosis who underwent liver transplantation (n =24, before and after liver transplantation). Single asterisk indicates P < .050; and double asterisks, P < .010, between cirrhosis and controls (Mann-Whitney U) and in paired comparisons of patients with cirrhosis before and after liver transplantation (Wilcoxon W).
There were no changes in the relative signal intensity in the parietal white matter for fast (cirrhosis pretransplant: 66.9 ± 2.7 versus controls: 68.5 ± 1.0; P =.972) or slow diffusion (cirrhosis pretransplant: 33.6 ± 1.0 versus controls: 33.1 ± 2.7; P =.972) and in the corticospinal tract for fast (cirrhosis pretransplant 71.2 ± 1.7 versus controls: 72.1 ± 3.4; P =.477) or slow diffusion (cirrhosis pretransplant: 28.8 ± 3.2 versus controls: 27.8 ± 3.4; P =.477).
The changes in the DTI parameters of the brain in patients with cirrhosis did not relate to impairment on neuropsychological testing. Patients with minimal HE showed values similar to those of patients with normal psychometric test results (Table 2). There was no correlation between DTI parameters, Child-Pugh scores, and biochemical parameters (albumin, sodium, bilirubin, and prothrombin levels).
Biexponential analysis of DTI in patients with cirrhosis according to the presence of minimal HEa
Discussion
In this study, MR imaging signs consistent with brain edema were present in the white matter of patients with cirrhosis. DTI and biexponential fitting found an increase in the fast MD values in the parietal white matter and corticospinal tract. These results are consistent with those of previous studies, in which DWI15 or DTI14 with monoexponential fitting was used; thus, they support the concept that the increased brain water in cirrhosis is mainly extracellular. These observations contrast with a recent hypothesis suggesting that the brain edema in acute liver failure has a cytotoxic origin.13
The exact physiologic meaning of the fast and slow components of diffusion is still under discussion.10 The idea that the slow diffusion component measures the intracellular space and the fast diffusion component, the extracellular space lacks confirmatory data. The volume fractions obtained from biexponential analysis of water signal-intensity decay (F slow ∼ 0.33; F fast ∼ 0.67) do not correspond to the physiologic volume fractions of the extra- and intracellular compartments (F intra ∼ 0.80; F extra ∼ 0.20).9,26 A more recent theory has suggested that the 2 components could correspond to 2 differently structured water pools rather than to specific extracellular and intracellular water compartments.11 Despite this controversy, we decided to perform a DTI study over a large range of b-values to investigate whether biexponential analysis could potentially differentiate the cytotoxic or vasogenic nature of the edema. This idea was based on previous studies showing that cytotoxic edema, a feature of the early phase of ischemic stroke, causes an increase in the slow MD,27 whereas vasogenic edema, typically present surrounding brain tumors, causes an increase in the fast MD.28
The observation of a fast MD increase that returned to normal after liver transplantation supports the concept that the increased water content was mainly located in the interstitial compartment. The decreased FA in white matter, which occurred parallel to the MD increase, likely represents less restricted movement of water molecules, a typical feature of extracellular edema.28 Liver transplantation restores liver function and results in resolution of brain edema. In accordance, FA in parietal white matter normalized following transplantation.
Brain edema is a well-recognized complication of acute liver failure related to ammonia-induced astrocyte swelling that can cause intracranial hypertension and death.29,30 In recent years, MR imaging techniques have documented low-grade brain edema in patients with chronic liver failure.31 This observation led to the proposal that encephalopathy in cirrhosis is the clinical manifestation of neuronal dysfunction secondary to astrocyte swelling.32 In support of this hypothesis, quantitative cerebral water-content mapping found an increase in total brain water in patients with HE.12 However, the characteristics of brain edema in cirrhosis appear to differ from those of edema in acute liver failure. Our observations and those of previous studies14,15 in cirrhosis support a water increase in the interstitial compartment, which could be explained by greater blood-brain barrier permeability, secondary to chronic inflammation and cytokine activation.33 The increased permeability could result in low-grade interstitial brain edema, which would not affect neuronal function because it is located extracellularly. This could be the reason why we found no differences in the fast MD between patients with and without minimal HE. The absence of differences in MR imaging parameters in these patients has been observed in previous studies by using magnetization transfer imaging,17 DWI,15 and DTI.14
Episodes of HE are usually related to a precipitating factor that causes acute hyperammonemia. In acute liver failure, persistent elevation of ammonia concentration above 200 μmol/L leads to brain edema and intracranial hypertension.34 It is plausible that the precipitating factor of episodic encephalopathy would induce superimposed swelling of astrocytes and cytotoxic edema. This is supported by the observation of an MD decrease in patients with acute-on-chronic liver failure.35 Thus, a better explanation of what occurs during episodes of HE is the presence of mixed edema,16 consisting of chronic vasogenic edema secondary to cirrhosis and superimposed acute cytotoxic edema secondary to hyperammonemic decompensation.
An additional finding in our study is the differing pattern observed in the parietal white matter and corticospinal tract. Regional differences on MR imaging have been reported for T1-36 and T2-weighted imaging,18 and for DWI.14 In a previous study by using fluid attenuated inversion recovery imaging, we found an increased T2 signal intensity in the corticospinal tract in approximately 25% of patients with cirrhosis. This abnormality, which is associated with functional impairment detected by neurophysiologic methods, probably corresponds to the same pathogenic syndrome as hepatic myelopathy,37 but to a lesser extent. In comparison with the parietal white matter, the corticospinal tract showed an increase in fast and slow MD, which suggests coexistence of extracellular and intracellular edema. The higher vulnerability of this tract to the putative toxins that cause HE has been explained by higher energy requirements that may lead to long-term effects.38 FA of the corticospinal tract did not change after liver transplantation, despite MD normalization. The persistent isotropy (lower FA) in the corticospinal tract probably relates to microscopic structural changes, such as those caused by demyelination.39 Myelin loss can explain the persistent functional derangement after liver transplantation in patients with well-defined hepatic myelopathy37 and in those with T2 hyperintensity along the corticospinal tract.38
One important result of our study is that introduction of a biexponential analysis–enabled detection of MD and FA changes that monoexponential analysis did not show, as can be seen in Figs 1–4. Thus, in addition to providing information that could be pathophysiologically relevant, biexponential analysis enables detection of changes in the water pools that escape monoexponential study. Application of this method to other pathologic conditions, such as ischemia or demyelinating disorders, could be useful for assessing the extent of tissue damage.
The current study has several limitations that should be taken into consideration in the interpretation of the results. The MR imaging method (biexponential analysis of DTI) has the previously discussed differences between physiologic and measured volume fractions. Although statistically significant, the intensity of changes in DTI parameters before and after liver transplantation was low (approximately 2%). Thus, it may be difficult to show differences in studies with limited numbers of patients or multiple comorbidities. Cognitive function is influenced by several factors that are present before and after liver transplantation, and some of these may not have been adequately recognized in the study. The diagnosis of minimal HE is based on demonstration of cognitive disturbance in the absence of other causes, but several factors could have participated in the deterioration seen on neuropsychological tests before liver transplantation. Immunosupressors, which are necessary after liver transplantation, may cause white matter lesions.40 We did not observe signs of neurotoxicity attributable to immunosupressors, but a possible role in the outcome after liver transplantation cannot be completely ruled out because it is not possible to control for their effect.
Conclusions
Biexponential analysis supports the existence of different patterns of edema in the brains of patients with cirrhosis, likely an extracellular pattern in the parietal white matter and a mixed pattern along the corticospinal tract. The edema is reversible with liver transplantation, but some microstructural damage may persist along the corticospinal tract, as is suggested by the evolution of FA. Biexponential analysis of diffusion tensor data is a powerful method for studying the pathogenesis of brain edema in cirrhosis, which may be useful for diagnosing brain injury in other conditions.
Footnotes
-
Disclosures: Alex Rovira, Speaker Bureau: Bayer-Schering, Biogen, Bracco, Teva, Consultant: Parexel.
-
This work was supported by a grant from Instituto de Salud Carlos III (FIS PI07/0641 and PI08/0698). Centro de Investigación Biomédica en Red de Enfermedades Hepáticas y Digestivas is supported by Instituto de Salud Carlos III. Rita Garcia-Martinez is the recipient of a Fondo de Investigación Sanitaria grant, CM07/00109.
-
Paper previously presented at: Asociación Española para el estudio del Hígado, February 20–22, 2008; Madrid, Spain; Annual Meeting of the European Society of Neuroradiology, September 18–21, 2008; Cracovia, Poland; 13th International Symposium on Hepatic Encephalopathy and Nitrogen Metabolism Symposium, April 28-May 1, 2008; Padova, Italy; and XXIX Congreso Nacional de la Sociedad Española de Radiología Médica, May 23–27, 2008; Sevilla, Spain.
Indicates open access to non-subscribers at www.ajnr.org
References
- Received November 16, 2010.
- Accepted after revision December 26, 2010.
- © 2011 by American Journal of Neuroradiology
In this issue


Jump to section
Related Articles
Cited By...
- Evidence Suggesting Prolonged Neuroinflammation in a Subset of Children after Moderate/Severe TBI: A UCLA RAPBI Study
- Identification of Minimal Hepatic Encephalopathy in Patients with Cirrhosis Based on White Matter Imaging and Bayesian Data Mining
- Assessment of Angiographic Vascularity of Meningiomas with Dynamic Susceptibility Contrast-Enhanced Perfusion-Weighted Imaging and Diffusion Tensor Imaging