
Abstract
BACKGROUND AND PURPOSE: Dynamic contrast-enhanced T1-weighted perfusion MR imaging is much less susceptible to artifacts, and its high spatial resolution allows accurate characterization of the vascular microenvironment of the lesion. The purpose of this study was to test the predictive value of the initial and final area under the time signal-intensity curves ratio derived from dynamic contrast-enhanced perfusion MR imaging to differentiate pseudoprogression from early tumor progression in patients with glioblastomas.
MATERIALS AND METHODS: Seventy-nine consecutive patients who showed new or enlarged, contrast-enhancing lesions within the radiation field after concurrent chemoradiotherapy were assessed by use of conventional and dynamic contrast-enhanced perfusion MR imaging. The bimodal histogram parameters of the area under the time signal-intensity curves ratio, which included the mean area under the time signal-intensity curves ratio at a higher curve (mAUCRH), 3 cumulative histogram parameters (AUCR50, AUCR75, and AUCR90), and the area under the time signal-intensity curves ratio at mode (AUCRmode), were calculated and correlated with the final pathologic or clinical diagnosis. The best predictor for differentiation of pseudoprogression from early tumor progression was determined by receiver operating characteristic curve analyses.
RESULTS: Seventy-nine study patients were subsequently classified as having pseudoprogression (n=37, 46.8%) or early tumor progression (n=42, 53.2%). There were statistically significant differences of mAUCRH, AUCR50, AUCR75, AUCR90, and AUCRmode between the 2 groups (P < .0001, each). Receiver operating characteristic curve analyses showed the mAUCRH to be the best single predictor of pseudoprogression, with a sensitivity of 90.1% and a specificity of 82.9%. AUCR50 was found to be the most specific predictor of pseudoprogression, with a sensitivity of 87.2% and a specificity of 83.1%.
CONCLUSIONS: A bimodal histogram analysis of the area under the time signal-intensity curves ratio derived from dynamic contrast-enhanced perfusion MR imaging can be a potential, noninvasive imaging biomarker for monitoring early treatment response in patients with glioblastomas.
ABBREVIATIONS:
- AUCR
- area under the time signal intensity curves ratio
- CCRT
- concurrent chemoradiotherapy
- DCE
- dynamic contrast-enhanced
- EES
- extravascular extracellular space
- ETP
- early tumor progression
- FAUC
- final area under the time signal-intensity curve
- IAUC
- initial area under the time signal-intensity curve
- Ve
- volume fraction of extracellular extravascular space
Differentiation of treatment-related change including pseudoprogression from early tumor progression (ETP) is a common yet diagnostic challenge in neuro-oncology practice, because increased leakage of contrast agent through blood-brain barrier disruption can be produced by both tumor neovessels and treatment-related injury.1,2 Dynamic susceptibility-weighted contrast-enhanced perfusion MR imaging has made it possible to distinguish tumor recurrence from radiation necrosis by use of relative cerebral blood volume maps.3 Recently, Hu et al4 proposed that multiparametric MR imaging analysis may be a promising approach to identify the distribution of radiation necrosis. The results of 18FDG-PET in the differentiation of recurrent glioblastomas from radiation necrosis have been mixed.5
Compared with DSC T2*-weighted perfusion MR imaging, dynamic contrast-enhanced (DCE) T1-weighted perfusion MR imaging is much less susceptible to artifacts, and its high spatial resolution allows accurate characterization of the vascular microenvironment of the lesion.6 Model-based pharmacokinetic DCE parameters are “quantitative” insofar as their potential to measure true physiologic mechanisms, such as blood flow and endothelial permeability. However, this potential is difficult to realize in practice because of several challenges, including parameter coupling, measuring the arterial input function, water exchange, and model fit instability.7 In many cases, correlation with tumor stage and response to treatment can be more easily, perhaps even more reproducibly, obtained by use of “semiquantitative” model-free parameters such as the initial area under the time signal-intensity curve (IAUC),8 which do not require an arterial input function measurement and are immune to fit failures on noisy data. Their main limitation, however, is lack of a clear biologic association. The ideal DCE MR imaging analysis would feature the robustness and “biologic relevance” from both model-based and model-free approaches.
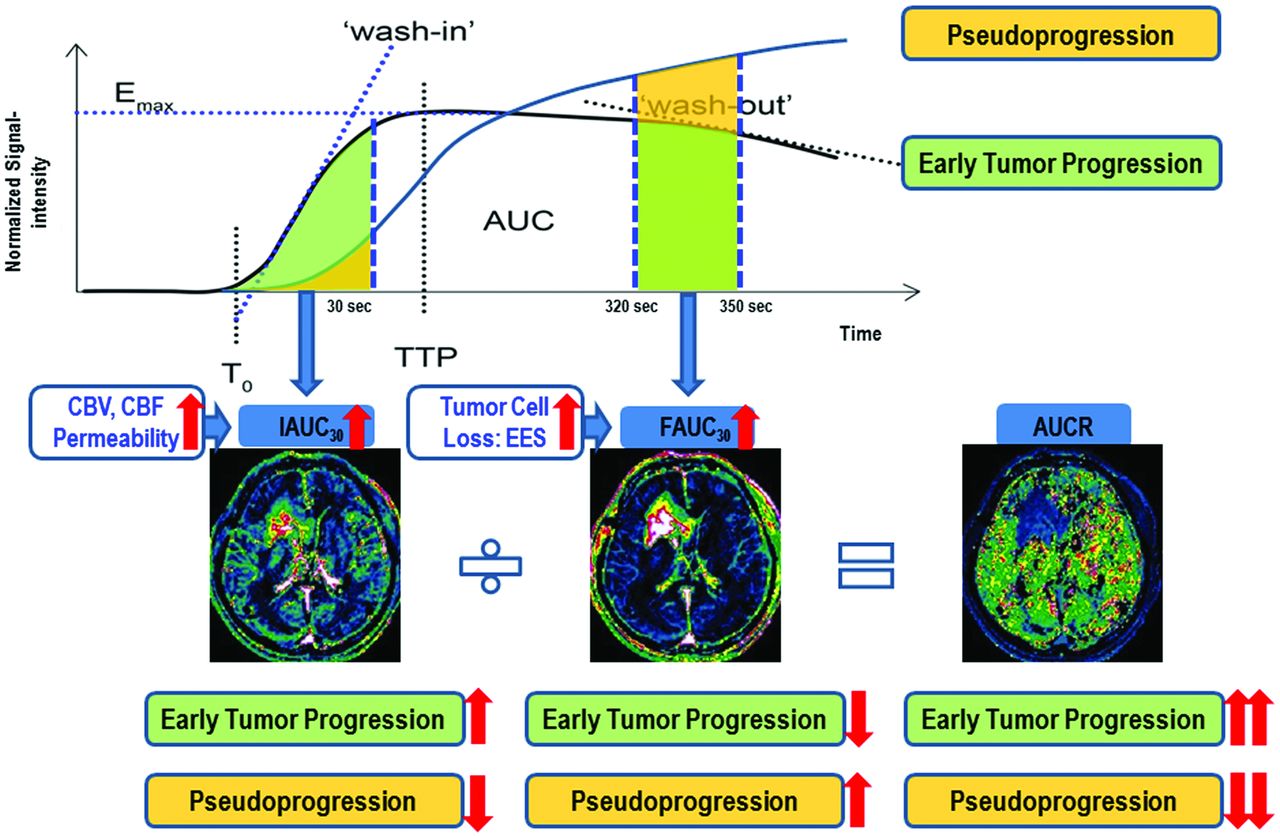
In the present study, we propose a more specific area under the time signal-intensity curve–derived parameter (initial and final area under the time signal-intensity curves ratio [AUCR]) dedicated to posttreatment glioblastoma, which represents both initial contrast wash-in into extravascular extracellular space (EES) and contrast retention within EES. Our hypothesis was that the IAUC probably reflects the degree of early leakage of contrast agent into the EES and the final area under the time signal-intensity curve (FAUC) provides insight into increased EES associated with decreased tumor cellularity and more tissue damage in pseudoprogression. We tried to validate the AUCR by comparison with clinicopathologic results of posttreatment glioblastomas. This choice was dictated by our desire to minimize the dependence on pharmacokinetic modeling. We also applied a 2-component mixture normal distribution to yield better-fitting curves of histograms9 because perfusion histograms in glioblastomas are usually asymmetric, generally broad, and occasionally dual peaked. The purpose of this study was to test the predictive value of the bimodal histogram parameters of AUCR derived from DCE perfusion MR imaging in the differentiation of pseudoprogression from ETP in patients with newly diagnosed glioblastomas.
Materials and Methods
Our institutional review board approved this retrospective study and waived the informed consent requirement.
Patients
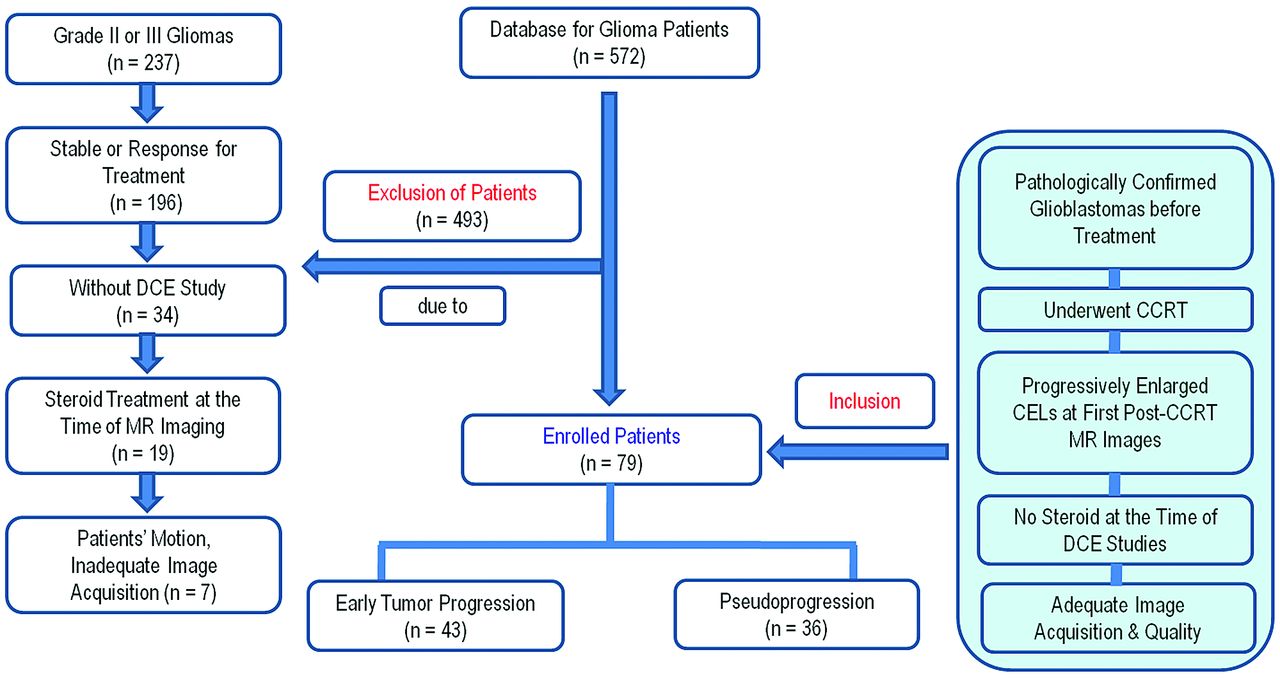
A retrospective review of the data base of our institution identified 572 consecutive patients who underwent an MR imaging study for pretreatment and posttreatment glioma evaluation between December 2007 and July 2012. Among these patients, 79 were included as our study patient group according to the following criteria: 1) they had been pathologically confirmed as having glioblastomas before standard glioblastoma treatment; 2) they underwent concurrent chemoradiotherapy (CCRT) after surgical resection; 3) they demonstrated new or progressively enlarged enhancing lesions seen on the first follow-up MR images, including DCE perfusion MR images, within 4–5 weeks after the end of concurrent chemoradiotherapy; 4) they did not have corticosteroid administration at the time of the DCE MR imaging; 5) they had adequate image acquisition and quality without patient motion and susceptibility artifacts; and 6) they underwent more than 2 subsequent follow-up MR studies. The size criterion for enlarged contrast-enhancing lesions was an increase of a measurable (> 1 cm) enhancing lesion by more than 25% in the sum of the products of perpendicular diameters between the pre-CCRT and first post-CCRT MR images. This criterion was modified from the Response Assessment in Neuro-Oncology (RANO) criteria for progressive disease more than 12 weeks after completion of CCRT. A total of 20 patients with treatment-naïve glioblastomas and who also underwent DCE T1-weighted perfusion MR imaging were enrolled as the control group. Because the AUCR was a new imaging parameter derived from a time-normalized signal intensity curve of the DCE study, we needed reference AUCR values only in our institution. The patients with treatment-naïve glioblastomas that had been pathologically confirmed and had not had any postsurgical artifacts could provide reference AUCR values in our institution. There was no overlap in the patient group and the control group. The study patient accrual process is summarized in Fig 1.

Flowchart of the study population. CEL, contrast-enhancing lesion.
Pathologic analysis after second-look surgery categorized patients into an ETP group (n=17) and a pseudoprogression group (n=7). If second-look surgery was not available, the clinicoradiologic diagnosis of ETP (n=25) or pseudoprogression (n=30) was made by consensus of a neuro-oncologist and a neuroradiologist after complete chart and imaging review. The diagnosis of pseudoprogression was made if no change in treatment was required for a minimum of 6 months from the end of CCRT. This definition allows for the mild increase of the contrast-enhancing lesions compared with the usual decrease or stabilization, as long as no treatment change occurred during this period. The final diagnosis of ETP was made if a steady increase in enhancement on more than 2 subsequent follow-up MR imaging studies with an interval of 2–3 months, and clear clinical deterioration that was not attributable to concurrent medication or comorbid conditions, prompted a change in treatment.10
Of the 79 study patients, 36 were men (mean age, 49.5 years; age range, 35–69 years) and 43 were women (mean age, 52.9 years; range, 25–69 years), with an overall mean age of 51.2 years (age range, 25–69 years). Of the 20 control patients, 12 were men and 8 were women, with an overall mean age of 47.9 years (age range, 34–58 years).
Imaging Protocol
Conventional and DCE perfusion MR imaging were performed by use of a 3T system (Achieva; Philips Healthcare, Best, the Netherlands) with an 8-channel sensitivity-encoding head coil. 3D gradient-echo data with 21 sections were obtained before, during, and after administration of a standard dose of 0.1 mmol (0.2 mL)/kg of gadoterate meglumine (Dotarem; Guerbet, Aulnay-sous-Bois, France) per kilogram of patient body weight (average total volume, 13.7 mL; range, 12–15 mL) and at a rate of 4 mL/s by use of an MR imaging–compatible power injector (Spectris; Medrad, Indianola, Pennsylvania). The dynamic acquisition was performed with a temporal resolution of 3.52 seconds, and contrast was administrated after 10 baseline dynamics (total: 120 dynamics). The detailed imaging parameters for DCE perfusion MR imaging were a section thickness of 4 mm with no gap; spatial in-plane resolution, 184 × 186 mm; TR, 6.4 ms; TE, 3.1 ms; flip angle, 15°; field of view, 23 cm; and total acquisition time, 6 minutes and 41 seconds.
Image Processing
All imaging data were transferred from the MR scanner to an independent personal computer for quantitative DCE perfusion analysis. Perfusion parametric maps were obtained by use of a commercial software package (nordicICE; NordicNeuroLab, Bergen, Norway), and in-house software developed by Matlab 2010b (MathWorks, Natick, Massachusetts). For DCE MR imaging, motion correction was done to correct a rigid body motion to the times-series data before the DCE dynamic curve analysis. On the time–signal intensity curve, signal intensity was normalized to the maximal value as the percent change of signal intensity. The IAUC30 was defined as the trapezoidal integration of the normalized signal intensity curve from the onset of enhancement to 30 seconds thereafter in the segmented contrast-enhancing voxels. This approach provides a measurement of the initial arrival of contrast agent in the tissue of interest after intravenous bolus administration that reflects blood flow, vascular permeability, and the fraction of interstitial space.11 The determination of the initial 30 seconds was based on our observation that initial contrast agent wash-in was usually achieved during the first 30 seconds postcontrast agent arrival. FAUC30 was defined as the trapezoidal integration of the normalized signal intensity curve between 320 and 350 seconds after the onset of enhancement in the same enhancing voxels with IAUC30. As shown by a previous study,7 IAUCve (similar parameter with FAUC30) could be a correlate of volume fraction of extracellular extravascular space (Ve). Cheng7 chose an interval of IAUCve beyond the vascular phase when contrast distribution is relatively stable to minimize flow and related vascular contributions. However, this author proposed that if signal-to-noise ratio permits, IAUCve should be computed at yet later times to improve correlation with Ve. We chose an interval between 320 and 350 seconds after the onset of enhancement to maximize the difference of FAUC30 between ETP and pseudoprogression groups. Thus, the FAUC30 could represent the amount of contrast agent leakage within the EES, and the increased FAUC30 could be explained by the increased EES associated with decreased tumor cellularity and more tissue damage in pseudoprogression (Fig 2). An experienced neuroradiologist (H.S.K. with 8 years of experience in neuro-oncologic imaging) specified the range of the prebolus, wash-in, and the last images used to estimate the IAUC30 and FAUC30. Outlier values, which could occur from unstable curve-fitting conditions with a noisy input signal, were removed from the output maps by setting the outlier pixels equal to the maximum of the “normal” pixel range. Finally, the ratio of IAUC30 and FAUC30 (AUCR) was calculated within the same contrast-enhancing lesions on a voxel-by-voxel basis (Fig 2).

Illustration for calculating the AUCR from DCE perfusion MR imaging and the flowchart of our hypothesis.
Model-based DCE parameters were obtained with a 2-compartment pharmacokinetic model by use of permeability software (PRIDE, Philips Healthcare) with the interactive data language (IDL, RSI) in the 20 treatment-naïve control patients. The rate of forward leakage can be produced as Ktrans on the basis of the model.
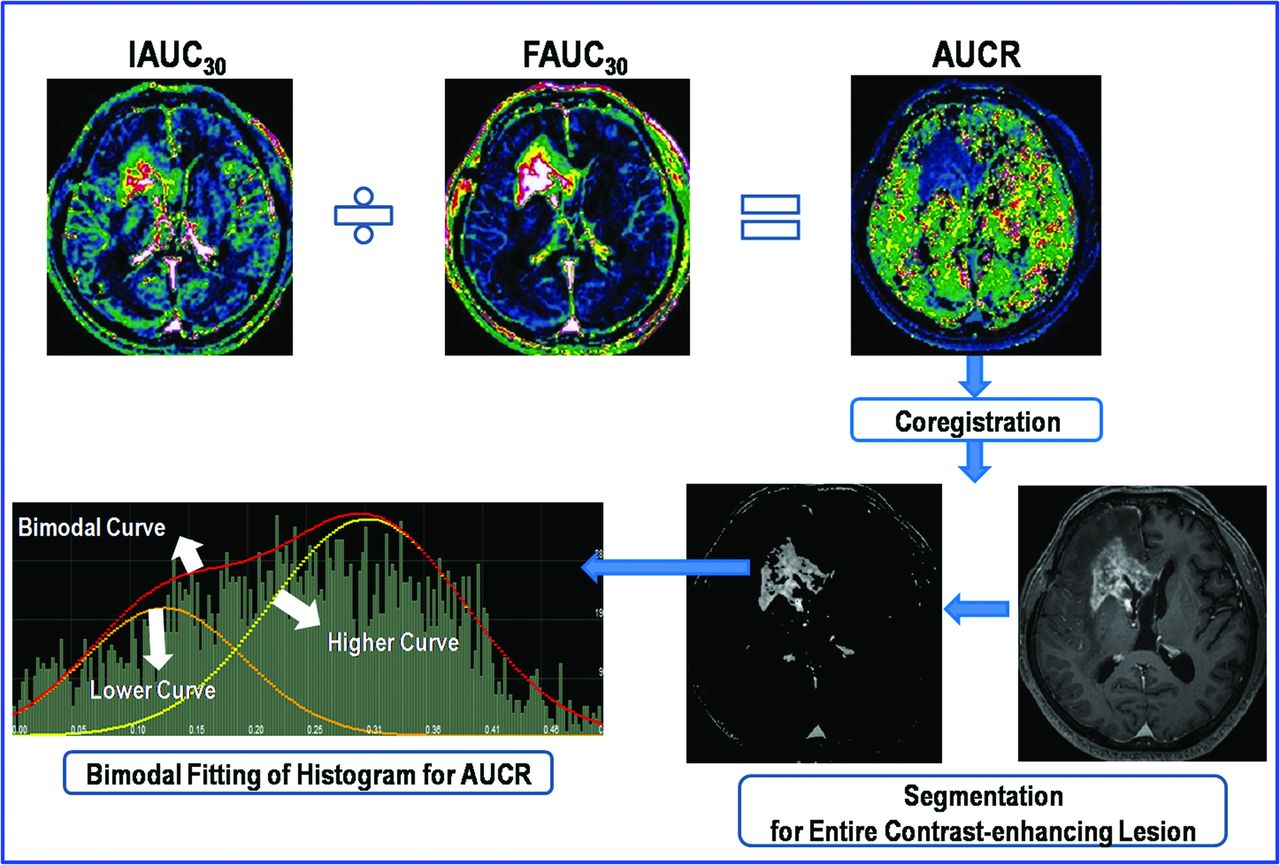
For quantitative analysis, the experienced neuroradiologist (H.S.K.) segmented the contrast-enhancing lesion volumes on 3D postcontrast, T1-weighted images according to a semiautomated, adaptive thresholding technique by using the commercial software (nordicICE). The segmentation function was automatically performed according to the segmentation threshold, which was based on the pixel range of T1–signal intensity and was determined by the operator to visually exclude macroscopic necrosis, cysts, and normal vessels. The resulting segmented enhancing tumor volumes were verified by the experienced neuroradiologist (H.S.K.), who was blinded to the clinical outcome, and they were coregistered and mapped to the AUCR maps. The AUCR values calculated on a pixel-by-pixel basis for the segmented enhancing volume were used for histogram analysis (Fig 3).

Illustration of the step for calculating the AUCR and its histogram.
Because perfusion histograms are often bimodal or skewed, we used a 2-mixture normal distribution to provide optimal fitting.9 We then generated the mean for the higher peak (mean AUCR at a higher curve, mAUCRH). We also measured the AUCR at mode (AUCRmode). For the cumulative AUCR histogram parameters, the 50th (AUCR50), 75th (AUCR75), and 90th (AUCR90) percentiles were derived (the nth percentile is the point at which n% of the voxel values that form the histogram is found to the left).12
Statistical Analysis
All data were expressed as mean ± SD. The significant differences among the various, model-free parameters derived from the pseudoprogression group, the ETP group, and the control group, were assessed by 1-way ANOVA as the first test. If the overall P value was .05 or less, Bonferroni multiple comparison was used as a post hoc test. All P values were adjusted with Bonferroni correction for multiple comparisons.
In the receiver operating characteristic curves analysis, the cutoff points, which were determined by maximizing the sum of the sensitivity and specificity, were calculated to differentiate pseudoprogression from ETP. Areas under the receiver operating characteristic curves (Az), which were computed by use of the selected DCE parameters, were compared according to the method of DeLong et al.13 Correlation between the AUCR and the Ktrans was made by use of the Spearman correlation analysis. P values < .05 were considered to indicate statistically significant differences.
Results
The mean time for postprocessing of the AUCR histogram, including curve fitting, was 7 minutes and 12 seconds. The O(6)-methylguanine methyltransferase methylation status was obtained in 33 of 79 study patients through chart review. However, in our small patient study, the O(6)-methylguanine methyltransferase methylation status was not significantly different between the 2 groups. Descriptive statistics regarding the clinical and imaging parameters obtained in both the pseudoprogression and ETP groups are summarized in Table 1.
Comparison of study patient demographic data
Visual and Quantitative Analysis of the AUCR Histogram Parameters
The bimodal histograms of AUCR in ETP showed a higher relative frequency at the high AUCR value compared with pseudoprogression, thus resulting in substantial divergence between pseudoprogression and ETP at the high end of the cumulative histograms. The left-sided skewing and platykurtosis of the cumulative histogram of AUCR were more obvious in ETP than in pseudoprogression, which correlates well with the significant difference in mAUCRH, AUCR50, AUCR75, AUCR90, and AUCRmode between the 2 groups (Figs 4 and 5).

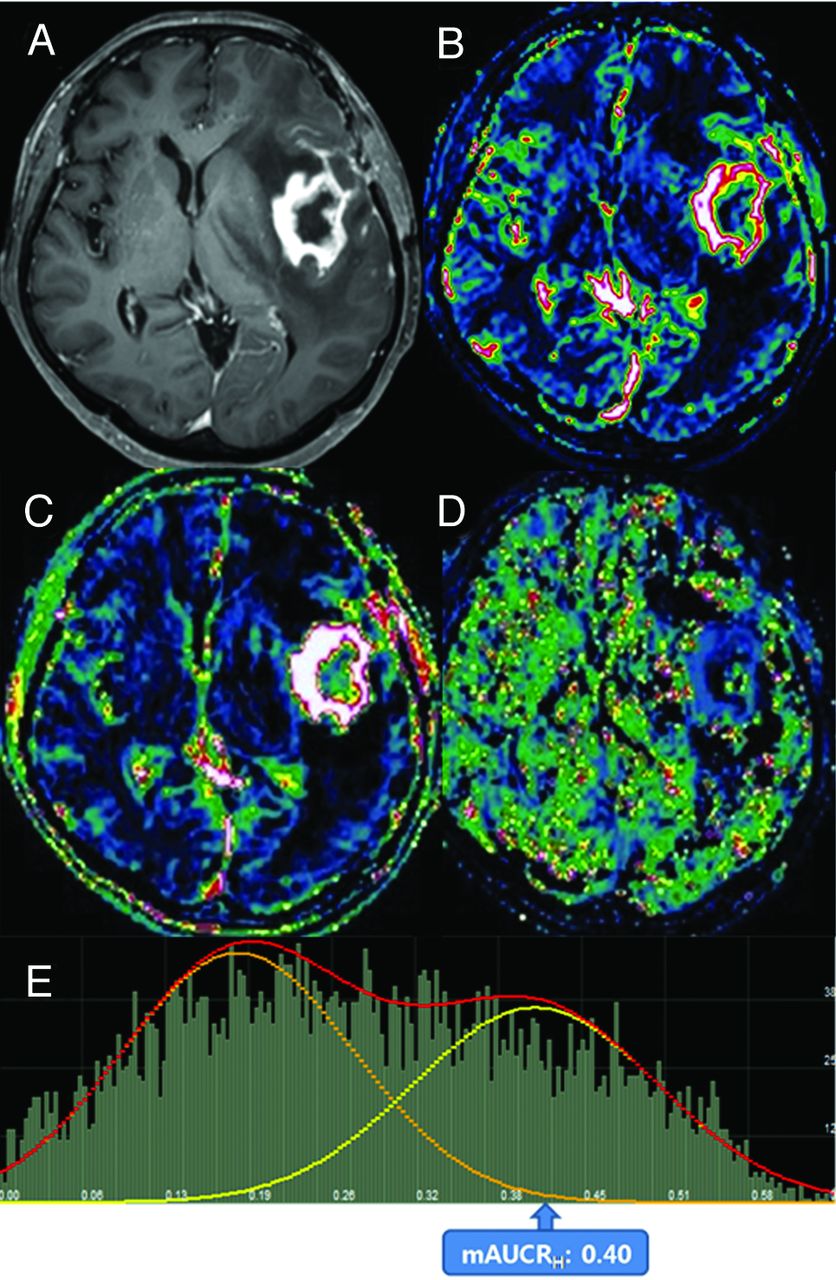
Images obtained in a 67-year-old woman with posttreatment glioblastoma who had ETP. Contrast-enhanced, T1-weighted imaging (A) performed 4 weeks after concomitant chemoradiotherapy showed a necrotic, contrast-enhancing mass centered in the left insula. The IAUC30 (B) and FAUC30 (C) maps derived from dynamic contrast-enhanced, T1-perfusion MR imaging. B, A visual increase of the IAUC30 value was noted in the medial aspect of the contrast-enhancing lesion. The AUCR map (D) and its bimodal histogram (E) showed increases in bimodal histogram parameters indicating ETP.

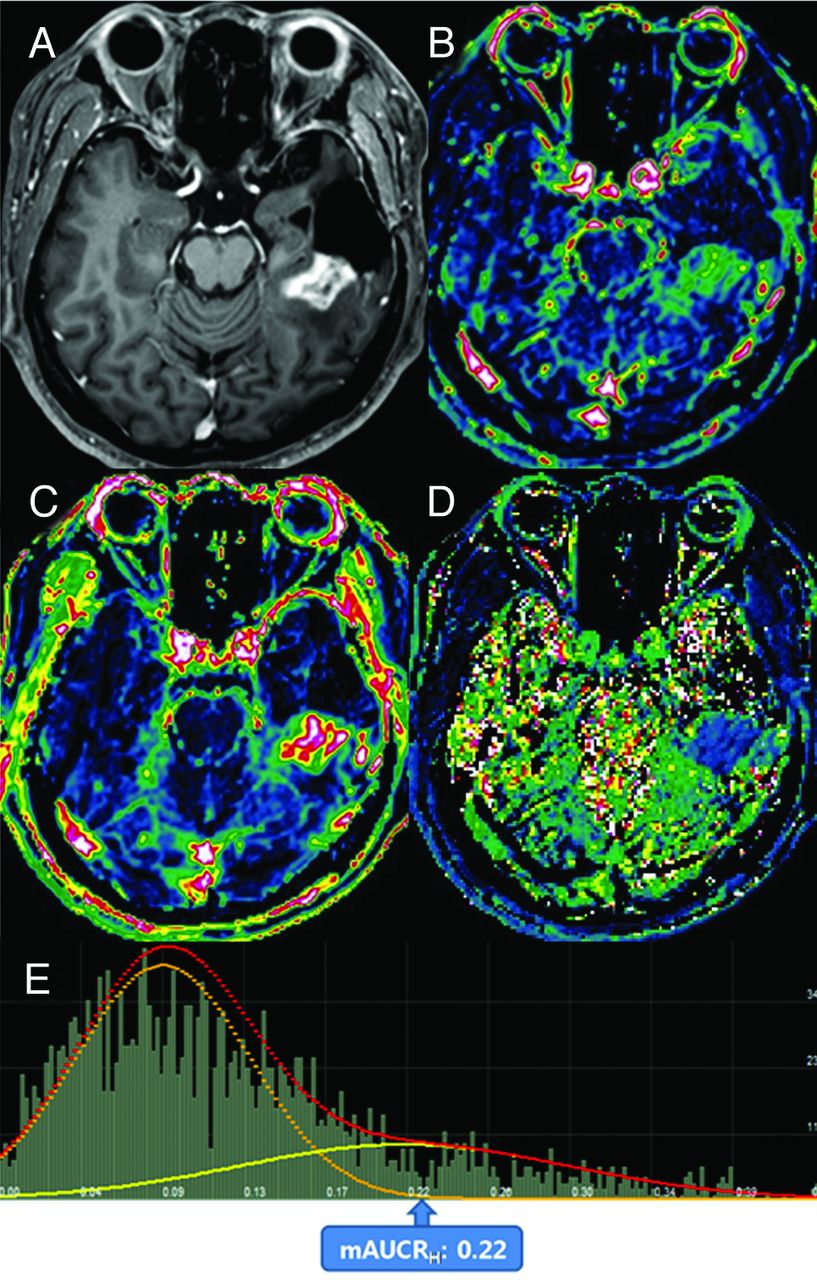
Images obtained in a 56-year-old man with posttreatment glioblastoma who had pseudoprogression. Contrast-enhanced T1-weighted imaging (A) obtained 3 weeks after concomitant chemoradiotherapy showed a necrotic, contrast-enhancing mass posterior to the surgical cavity of the left temporal lobe. The IAUC30 (B) and FAUC30 (C) maps derived from dynamic contrast-enhanced, T1-perfusion MR imaging. In B, a visual decrease of the IAUC30 value was noted in the entire contrast-enhancing lesion. The AUCR map (D) and its bimodal histogram (E) showed a decrease in the mean value of the higher curve, thus indicating pseudoprogression.
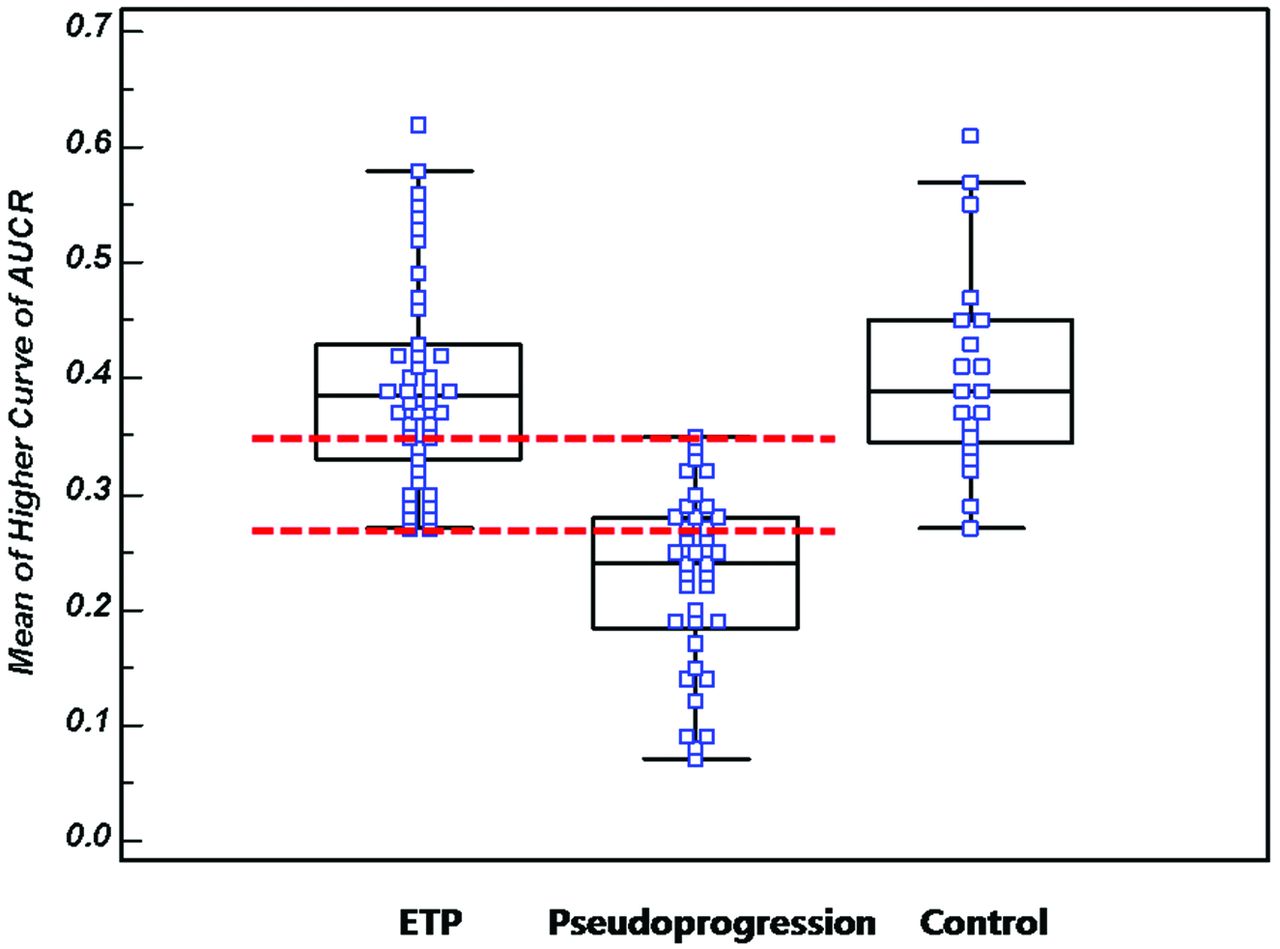
All of the AUCR histogram parameters showed statistically significant differences between the pseudoprogression group and the ETP group (Table 2), with the ETP group showing higher AUCR histogram parameters. Although the mAUCRH showed a clear difference between the ETP group and the pseudoprogression group (P < .0001), an overlap zone was visible between an mAUCRH of 0.27 and 0.35 (Fig 6). Significant differences in all of the AUCR histogram parameters were observed between the control group and the pseudoprogression group in which the cumulative histograms revealed that the mAUCRH, AUCR50, AUCR75, AUCR90, and AUCRmode differed significantly. However, no significant differences were observed in any of the AUCR histogram parameters between the control group and the ETP group (Table 2, Figs 6 and 7).
Multiple comparison test (P value) of the AUCR histogram parameters in the early tumor progression, pseudoprogression, and control groups

A box-and-whisker with scatterplots shows the mAUCRH of the ETP, pseudoprogression, and control groups. A clear difference between the ETP group and the pseudoprogression group can be seen (P < .0001); however, an overlap zone is visible between an mAUCRH of 0.27 and 0.35 (interval between dotted lines).

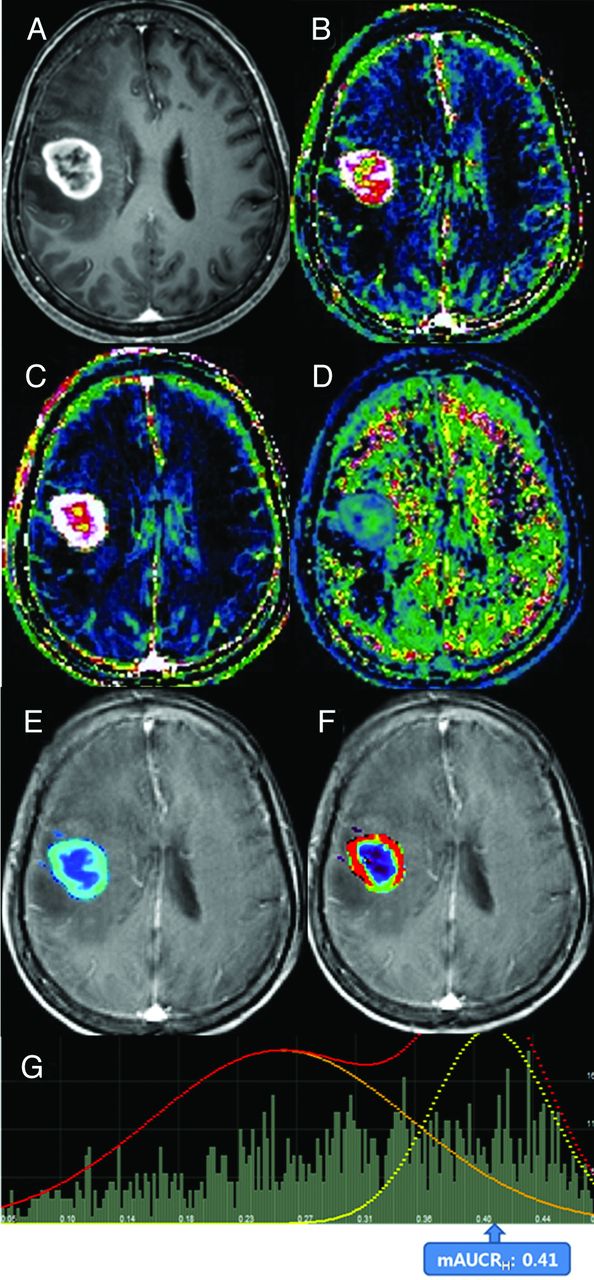
Images obtained in a 58-year-old woman with pathologically confirmed treatment-naïve glioblastoma. Contrast-enhanced, T1-weighted image obtained before surgery. A, The image showed a necrotic, contrast-enhancing mass in the right frontal lobe. IAUC30 (B) and FAUC30 (C) maps derived from dynamic contrast-enhanced, T1-perfusion MR imaging. B, A visual increase of the IAUC30 value was noted in the entire contrast-enhancing lesion. The AUCR (D), Ktrans (E), Ve (F) maps, and AUCR bimodal histogram (G) are shown. F, The distribution of visually high Ktrans corresponded with that of the IAUC30 map. G, An AUCR histogram showed increases in bimodal histogram parameters similar with those of ETP.
Diagnostic Performance of the AUCR Histogram Parameters and Correlation with Ktrans
Each parameter was evaluated individually for its discriminative ability by use of receiver operating characteristic analysis (Table 3). mAUCRH was the single best predictor for classification (Az = .901). The optimal cutoff value of mAUCRH for the prediction of pseudoprogression was 0.31, with a sensitivity of 90.1% and a specificity of 82.9%. AUCR50 was found to be the most specific predictor of pseudoprogression, with a sensitivity of 87.2% and a specificity of 83.1% by use of a cutoff value of 0.19. Receiver operating characteristic curve analysis indicated that the diagnostic models on the basis of all of the AUCR histogram parameters had a statistically significant P value.
Diagnostic performance of the AUCR histogram parameters for differentiating ETP from pseudoprogression
A scatterplot of maximal Ktrans against mAUCRH in 20 patients with treatment-naïve glioblastoma showed a significant correlation between the model-based and model-free parameters (r = 0.730; P = .0003; 95% confidence interval = 0.425–0.886).
Discussion
In this study, we chose 2 variables—IAUC30 and FAUC30—to describe the shape of the dynamic time–signal intensity curve. This choice was dictated by our desire to minimize the dependence on pharmacokinetic modeling.14 We found that all of the AUCR histogram parameters could distinguish retrospectively whether a progressively enhancing lesion was caused by ETP or by pseudoprogression. Our results might be explained by the fact that the IAUC30 depends mostly on the blood flow as well as the total vascular surface area exposed to the contrast agent; therefore, ETP has a prominent IAUC30 on the basis of hypervascularity and neoangiogenesis. In addition, FAUC30 in the pseudoprogression group could be increased by greater retention of contrast agent in the EES because of less tumor cellularity and more tissue damage. Our results are also consistent with what has been described previously by Narang et al,15 who used the IAUC at 60 seconds (IAUC60) in the initial vascular phase to successfully differentiate tumor progression from radiation necrosis. Contrary to this previous study,15 we chose IAUC30 instead of IAUC60. Determination of the initial 30 seconds for IAUC was based on our observation that initial contrast agent wash-in was usually achieved during the first 30-second postcontrast agent arrival.
Compared with a DCE MR study, a DSC study is more sensitive to susceptibility artifacts mainly associated with surgery- or radiation-induced hemorrhage, and its low spatial-resolution limits offer accurate characterization of the spatial distribution of brain tumor vessels. In addition, the T2* contrast agent leakage effects, which depend on the attenuation and spatial distribution of tumor cells within the EES, can lead to an additional susceptibility calibration factor. Even without contrast agent extravasation, the estimation of T2* parameters is confounded by the complicated relationship between the signal intensity and contrast agent concentration, as the vascular susceptibility calibration factor is known to vary across tissues with differing vascular geometries and architecture.16 Recently, Larsen et al17 reported that cerebral blood volume measurements by DCE MR imaging gave results very similar to FDG-PET regarding differentiation between tumor recurrence and radiation necrosis.
Although pharmacokinetic modeling (eg, Tofts) is the ideal approach, its “quantitative” potential is often undermined when a few conditions and assumptions are unmet. For example, an arterial input function is required, but its rapid and accurate measurement is challenging, and a visible vessel without inflow artifacts or partial-volume effects may not be available in the anatomic region of interest.7 IAUC during a given time is a model-free parameter that describes the initial uptake of contrast agent in a tissue of interest. It has advantages in that it does not require arterial input function measurement, is unlikely to be influenced significantly by variations in scanner and sequence type, and does not rely on complex postprocessing pharmacokinetic modeling techniques.11 However, model-free parameters lack a clear biologic association because they are “mixed” measures of tissue blood flow and vascular permeability, as well as an indirect measure of the EES. Although Evelhoch14 suggested that it was related to blood flow, vessel permeability, and interstitial space, its physiologic meaning was investigated by Walker-Samuel et al,18 who showed that the IAUC correlated intractably with Ktrans, EES volume, and plasma volume. Their results revealed that the IAUC could be made to track Ktrans or EES volume, but only under specific conditions and within a narrow range of physiologic values. We proposed a modified area under the time signal-intensity curve-derived DCE parameter (AUCR) dedicated to posttreatment glioblastoma, which retains the advantages of model-free approaches. We tried to validate the AUCR by comparison with clinicopathologic results of posttreatment glioblastomas and found that all of the AUCR histogram parameters were significantly different between the ETP group and the pseudoprogression group.
However, we did not directly compare the diagnostic accuracy of AUCR with model-based DCE parameters, such as Ktrans, in the same patients with posttreatment glioblastomas because of incomplete arterial input function sampling. However, compared with a recently published report,19 the sensitivity and specificity of AUCR were comparable to those of model-based DCE parameters and were higher than those of conventional IAUC in the differentiation of tumor from radiation necrosis. Moreover, the correlation of AUCR with Ktrans was significantly high in 20 patients with treatment-naïve glioblastomas, who were eligible for relatively rapid arterial input function sampling.
Because AUCR histograms in posttreatment glioblastomas were often skewed, broad, and occasionally dual peaked, a 2-component mixture normal distribution was selected to model their shape, as proposed by Pope et al9 by use of ADC histograms in recurrent glioblastoma. One potential explanation for this observation is that some areas of contrast-enhancing lesion may have predominant tumor and limited treatment-related change resulting in a prominent higher AUCR histogram curve, whereas other areas of contrast-enhancing lesion are composed of predominant treatment-related change and a limited tumor-generating prominent lower AUCR curve. However, a great deal of information seems to be lost on the presence of both pseudoprogression and tumor in the same patient if only the histograms are evaluated. In our present study, we found the same overlap of mAUCRH range between the ETP group and the pseudoprogression group, which might be attributable to the coexistence of viable tumor cells and treatment effects. As reported by Hu et al21, they can diagnose small isolated enhancing foci and identify histologically distinct subregions within large enhancing lesions by applying accurate threshold values determined by direct correlation between histopathologic features and DSC measurements. Future studies directly correlating AUCR with histopathologic patterns in ETP and pseudoprogression samples may clarify underlying pathophysiologic mechanisms.
Our study had several limitations. First, because the model's assumptions with IAUC30 and FAUC30 ignored multiple other effects, such as edema, back-pressure, and transport, all of which varied with tumor grade, the equations could only measure flow rates and not true permeability.20 Second, our AUCR histogram parameters showed relatively lower specificity for differentiating ETP from treatment-related change compared with a previous DSC study, which was a well-designed prospective study that used image-guided neuronavigation during surgical resection to directly correlate specimen histopathologic patterns with localized DSC measurements.21 Third, using the histogram analysis of AUCR values to evaluate for ETP vs pseudoprogression in a binary fashion does not provide for the clinical reality that pseudoprogression and tumor regrowth often occur together. Hu et al21 proposed that diagnosing small isolated enhancing foci and identifying histologically distinct subregions within large enhancing lesions could be achieved by applying accurate threshold values derived from direct correlation between tissue-specimen histopathologic patterns and DSC measurements. Further studies using direct correlation between histopathologic features and AUCR is needed to make our results more convincing. Finally, our method required multiple postprocessing steps. A simpler measurement, perhaps with region-of-interest analysis, would be better suited to clinical practice. In addition, the quantitative analysis required thresholding the image in a semiautomated fashion to ensure that the entire enhancing tumor volume is included, which suggests the need for physician oversight and limiting the ability of technologists to apply this technique independently in clinical practice.
Conclusions
A bimodal histogram analysis of AUCR can be used as a potential noninvasive imaging biomarker to monitor the early treatment response in patients with newly diagnosed glioblastomas.
Footnotes
This study was supported by the Basic Science Research Program through the National Research Foundation of Korea, funded by the Ministry of Education, Science and Technology (grant 2009–0076988).
Indicates open access to non-subscribers at www.ajnr.org
REFERENCES
- Received January 22, 2013.
- Accepted after revision March 24, 2013.
- © 2013 by American Journal of Neuroradiology


Jump to section
Related Articles
Cited By...
- Structural and practical identifiability of contrast transport models for DCE-MRI
- Response Assessment in Neuro-Oncology Criteria for Gliomas: Practical Approach Using Conventional and Advanced Techniques
- Detection of Local Recurrence in Patients with Head and Neck Squamous Cell Carcinoma Using Voxel-Based Color Maps of Initial and Final Area under the Curve Values Derived from DCE-MRI
- Quantitative Evaluation for Differentiating Malignant and Benign Thyroid Nodules Using Histogram Analysis of Grayscale Sonograms
- Differentiating Tumor Progression from Pseudoprogression in Patients with Glioblastomas Using Diffusion Tensor Imaging and Dynamic Susceptibility Contrast MRI
- ASFNR Recommendations for Clinical Performance of MR Dynamic Susceptibility Contrast Perfusion Imaging of the Brain
- Diffusion and Perfusion MRI to Differentiate Treatment-Related Changes Including Pseudoprogression from Recurrent Tumors in High-Grade Gliomas with Histopathologic Evidence