
Abstract
BACKGROUND AND PURPOSE: The manganese ion is used as an intracellular MR imaging contrast agent to study neuronal function in animal models, but it remains unclear whether manganese-enhanced MR imaging can be similarly useful in humans. Using mangafodipir (Teslascan, a chelated manganese-based contrast agent that is FDA-approved), we evaluated the dynamics of manganese enhancement of the brain and glandular structures in the rostral head and neck in healthy volunteers.
MATERIALS AND METHODS: We administered mangafodipir intravenously at a rate of 1 mL/minute for a total dose of 5 μmol/kg body weight. Nine healthy adult volunteers (6 men/3 women; median age, 43 years) completed baseline history and physical examination, 3T MR imaging, and blood work. MR imaging also followed mangafodipir administration at various time points from immediate to 7 days, with delayed scans at 1–3 months.
RESULTS: The choroid plexus and anterior pituitary gland enhanced within 10 minutes of infusion, with enhancement persisting up to 7 and 30 days, respectively. Exocrine (parotid, submandibular, sublingual, and lacrimal) glands also enhanced avidly as early as 1 hour postadministration, generally resolving by 1 month; 3 volunteers had residual exocrine gland enhancement, which resolved by 2 months in 1 and by 3 months in the other 2. Mangafodipir did not affect clinical parameters, laboratory values, or T1-weighted signal in the basal ganglia.
CONCLUSIONS: Manganese ions released from mangafodipir successfully enable noninvasive visualization of intra- and extracranial structures that lie outside the blood-brain barrier without adverse clinical effects, setting the stage for future neuroradiologic investigation in disease.
ABBREVIATIONS:
- FA
- flip angle
- GRE
- gradient recalled-echo
- MEMRI
- manganese-enhanced MRI
Paramagnetic contrast agents play a key role in MR imaging by influencing local magnetic fields and widening tissue-specific differences to enhance intrinsic structural information. Functional contrast agents, an emerging field, provide an additional layer of molecular and cellular information through their ability to probe intracellular processes. In preclinical studies, the manganese ion (Mn2+), a functional contrast agent, has garnered increasing attention due to its ability to accumulate within cells via L-type calcium channels and induce a strong reduction in intracellular T1 relaxation time, as well as travel along neural circuits.1 The application of manganese-enhanced MR imaging (MEMRI) has thus facilitated a greater understanding of brain laminar structure, neural activity, and neural connectivity.2⇓⇓⇓⇓–7
The application of MEMRI in humans has been impeded by the cardiotoxicity and potential neurotoxicity of high doses of free Mn2+ ions.8,9 Mangafodipir trisodium is a chelated manganese-based contrast agent that is FDA-approved for liver and pancreas imaging.10 After intravenous administration, mangafodipir undergoes simultaneous dephosphorylation and transmetallation, resulting in a slow release of manganese ions; this is thought to curtail the hazardous effects seen with bolus doses of manganese chloride (MnCl2).11,12 Preliminary studies in the human brain have demonstrated enhancement of structures outside the blood-brain barrier (choroid plexus and pituitary gland), with half-lives substantially longer than those of gadolinium chelates, which remain extracellular.13 However, detailed characterization of this enhancement has not been reported, to our knowledge.
The purpose of this study was to use MEMRI to evaluate the dynamics and pattern of manganese enhancement in the brain and rostral head-and-neck structures. Because of the limited availability of mangafodipir and of participants for repeat scans, temporal sampling was sparse for individuals but attenuated across the study population. We also performed quantitative T1 mapping to estimate contrast uptake and washout. Furthermore, we evaluated T1-weighted signal in the basal ganglia and cerebral cortex to assess retention of manganese ions.
Materials and Methods
Participant Recruitment
Participants were enrolled in the National Institutes of Health institutional review board–approved study, “Manganese-Enhanced Magnetic Resonance Imaging in Healthy Volunteers and People with Multiple Sclerosis” (NCT01326715). Each participant provided written informed consent. Healthy volunteers were recruited between October 2013 and June 2017. Key inclusion criteria were the following: 18–70 years of age, normal complete blood count, normal findings of kidney function and liver function tests, and normal brain MR imaging findings within 1 year before enrollment. Key exclusion criteria were the following: hypertension (>160/100 mm Hg), previous or current alcohol or substance abuse, occupational exposure to manganese, family history of Parkinson disease, pregnancy/lactation, or treatment with calcium channel blockers.
Screening Visit and Mangafodipir Infusion
The screening visit consisted of a physical examination, medical history, laboratory testing, and routine clinical 3T MR imaging to ensure absence of structural abnormalities. Mangafodipir trisodium was infused intravenously (50 μmol/mL at 1 mL/minute, for a total dose of 5 μmol/kg) after a baseline scan. Vital signs were monitored before, during, and after infusion.
MEMRI Protocol
Images were acquired on a Magnetom Skyra (Siemens, Erlangen, Germany) 3T scanner with a body-transmit and a 32-channel receiver head coil. Sequences acquired at each MEMRI time point (as detailed in the Table) included proton-density and T2-weighted (turbo spin-echo: TR = 5000 ms, TE = 18/82 ms, FOV = 256 mm, 1-mm in-plane resolution, 54 slices of 3-mm thickness), multiple T1-weighted (gradient-recalled-echo [GRE]: TR = 7.8 ms, TE = 3 ms, FOV = 256 mm, 1-mm isotropic resolution, 192 slices, flip angles [FAs] of 3°, 6°, 9°, 12°, 15°, and 18°), T1-weighted MPRAGE (turbo flash: TR = 1900 ms, TE = 2.5 ms, TI = 900 ms, FOV = 256 mm, FA = 9°, 1-mm isotropic resolution, 176 slices), or MP2RAGE (turbo flash: TR = 5000 ms, TE = 3 ms, TI = 700 and 1400 ms, FA = 4°, FOV = 256 mm, 1-mm isotropic resolution, 176 slices), T2-weighted FLAIR (inversion recovery sampling perfection with application-optimized contrasts by using different flip angle evolutions [IR SPACE sequence; Siemens]: TR = 4800 ms, TE = 353 ms, TI = 1800 ms, FOV = 256 mm, 1-mm isotropic resolution, 176 slices), and T2*-weighted (multishot echo-planar imaging [EPI]: TR = 64 ms, TE = 35 ms, FA = 10°, FOV = 250 mm, 0.65-mm isotropic resolution, 256 slices, EPI factor = 15).
Healthy volunteer study protocol
A B1 map using a modified Bloch-Siegert method14 (turbo flash sequence: TR = 19 ms, TE = 9.8 ms, FOV = 256 mm, FA = 8°, 4-mm isotropic resolution, 48 slices) was acquired, and T1 maps were calculated using this and the multiple GRE scans in Medical Image Processing, Analysis and Visualization 8.0.2 (MIPAV, Version 8.0.2; https://mipav.cit.nih.gov).
Seven of the 9 participants received gadolinium as part of other National Institutes of Health MR imaging studies, and those scans were available for retrospective analysis. The gadolinium scan included here was from a T1-weighted GRE scan (TR = 8.1 ms, TE = 2 ms, FOV = 256 mm, FA = 18°, 1-mm isotropic resolution, 176 slices).
One participant (healthy volunteer 4) was excluded from analysis due to an incorrect sequence acquisition. Images were interpreted clinically by an experienced neuroradiologist (D.S.R.).
Blood Work
Laboratory testing consisted of complete blood count, comprehensive metabolic panel with liver function tests and studies of creatine kinase, prolactin, thyroid stimulating hormone, and urine pregnancy (when relevant). These tests were performed at screening, week 1, month 1, and subsequent scans.
Image Processing
Image analysis was conducted using the freely available image-analysis software MIPAV. For each participant, volumes of interest (VOIs) covering the anterior pituitary gland (entire gland) and choroid plexus (3 consecutive axial slices) were manually drawn on the baseline unenhanced T1-weighted GRE (FA = 18°) scan and transferred to registered postmangafodipir images (On-line Fig 1). Exocrine glands (lacrimal, ∼3 slices; submandibular, ∼14 slices; sublingual, ∼16 slices; parotid, ∼6 slices) were manually segmented in a similar manner at each postmangafodipir time point due to their variable configuration at each scan. The VOIs of basal ganglia structures (caudate, striatum, pallidum), thalamus, cerebral cortex, and whole brain were obtained through segmentation using the semiautomated segmentation pipeline FreeSurfer (Version 5.1.0; http://surfer.nmr.mhg.harvard.edu). The mean and SD of signal intensity from T1-weighted images and the median T1 relaxation time from T1 maps were calculated in each VOI. T1-weighted signal intensity was normalized to the signal intensity from the manually segmented corpus callosum (∼11 slices) at each time point, and the fold change was calculated by dividing the normalized postmangafodipir intensity values by the normalized baseline intensity at each time point. The corpus callosum was selected for normalization due to the following: 1) prior animal and human data indicating that it does not enhance with manganese; and 2) the ease of segmentation due to its discrete borders on midline and paramedian sagittal slices.13,15
T1 mapping was successful in 7 participants for quantification of the anterior pituitary gland, choroid plexus, exocrine glands, and corpus callosum; 5 participants had successful T1 mapping for quantification of basal ganglia substructures.
Statistical Analysis
Statistical analysis was conducted using SAS (Version 9.2; SAS Institute, Cary, North Carolina). For each structure variable (signal intensity and T1 times), the linear trapezoidal rule was used to calculate the area under the enhancement curve. The area under the curve used for analysis was the difference between the area under the enhancement curve and the area under the baseline (interval between baseline and screening scan) divided by the time length.
The enhancement was evaluated using both the Wilcoxon signed rank test and bootstrapping with 500 replicates. In addition, a piecewise linear mixed-effects model was applied to examine the pattern of manganese enhancement for each structure.
Results
Nine healthy volunteers (median age, 43 years; range, 27–55 years; 3 women) participated in this study. MR imaging time points after mangafodipir administration are listed in the Table. As described in further detail below, we noted time-varying enhancement (P < .05) of several intracranial and extracranial structures, particularly the choroid plexus, anterior pituitary gland, and exocrine glands of the head and neck (parotid, sublingual, submandibular, and lacrimal).
Choroid Plexus
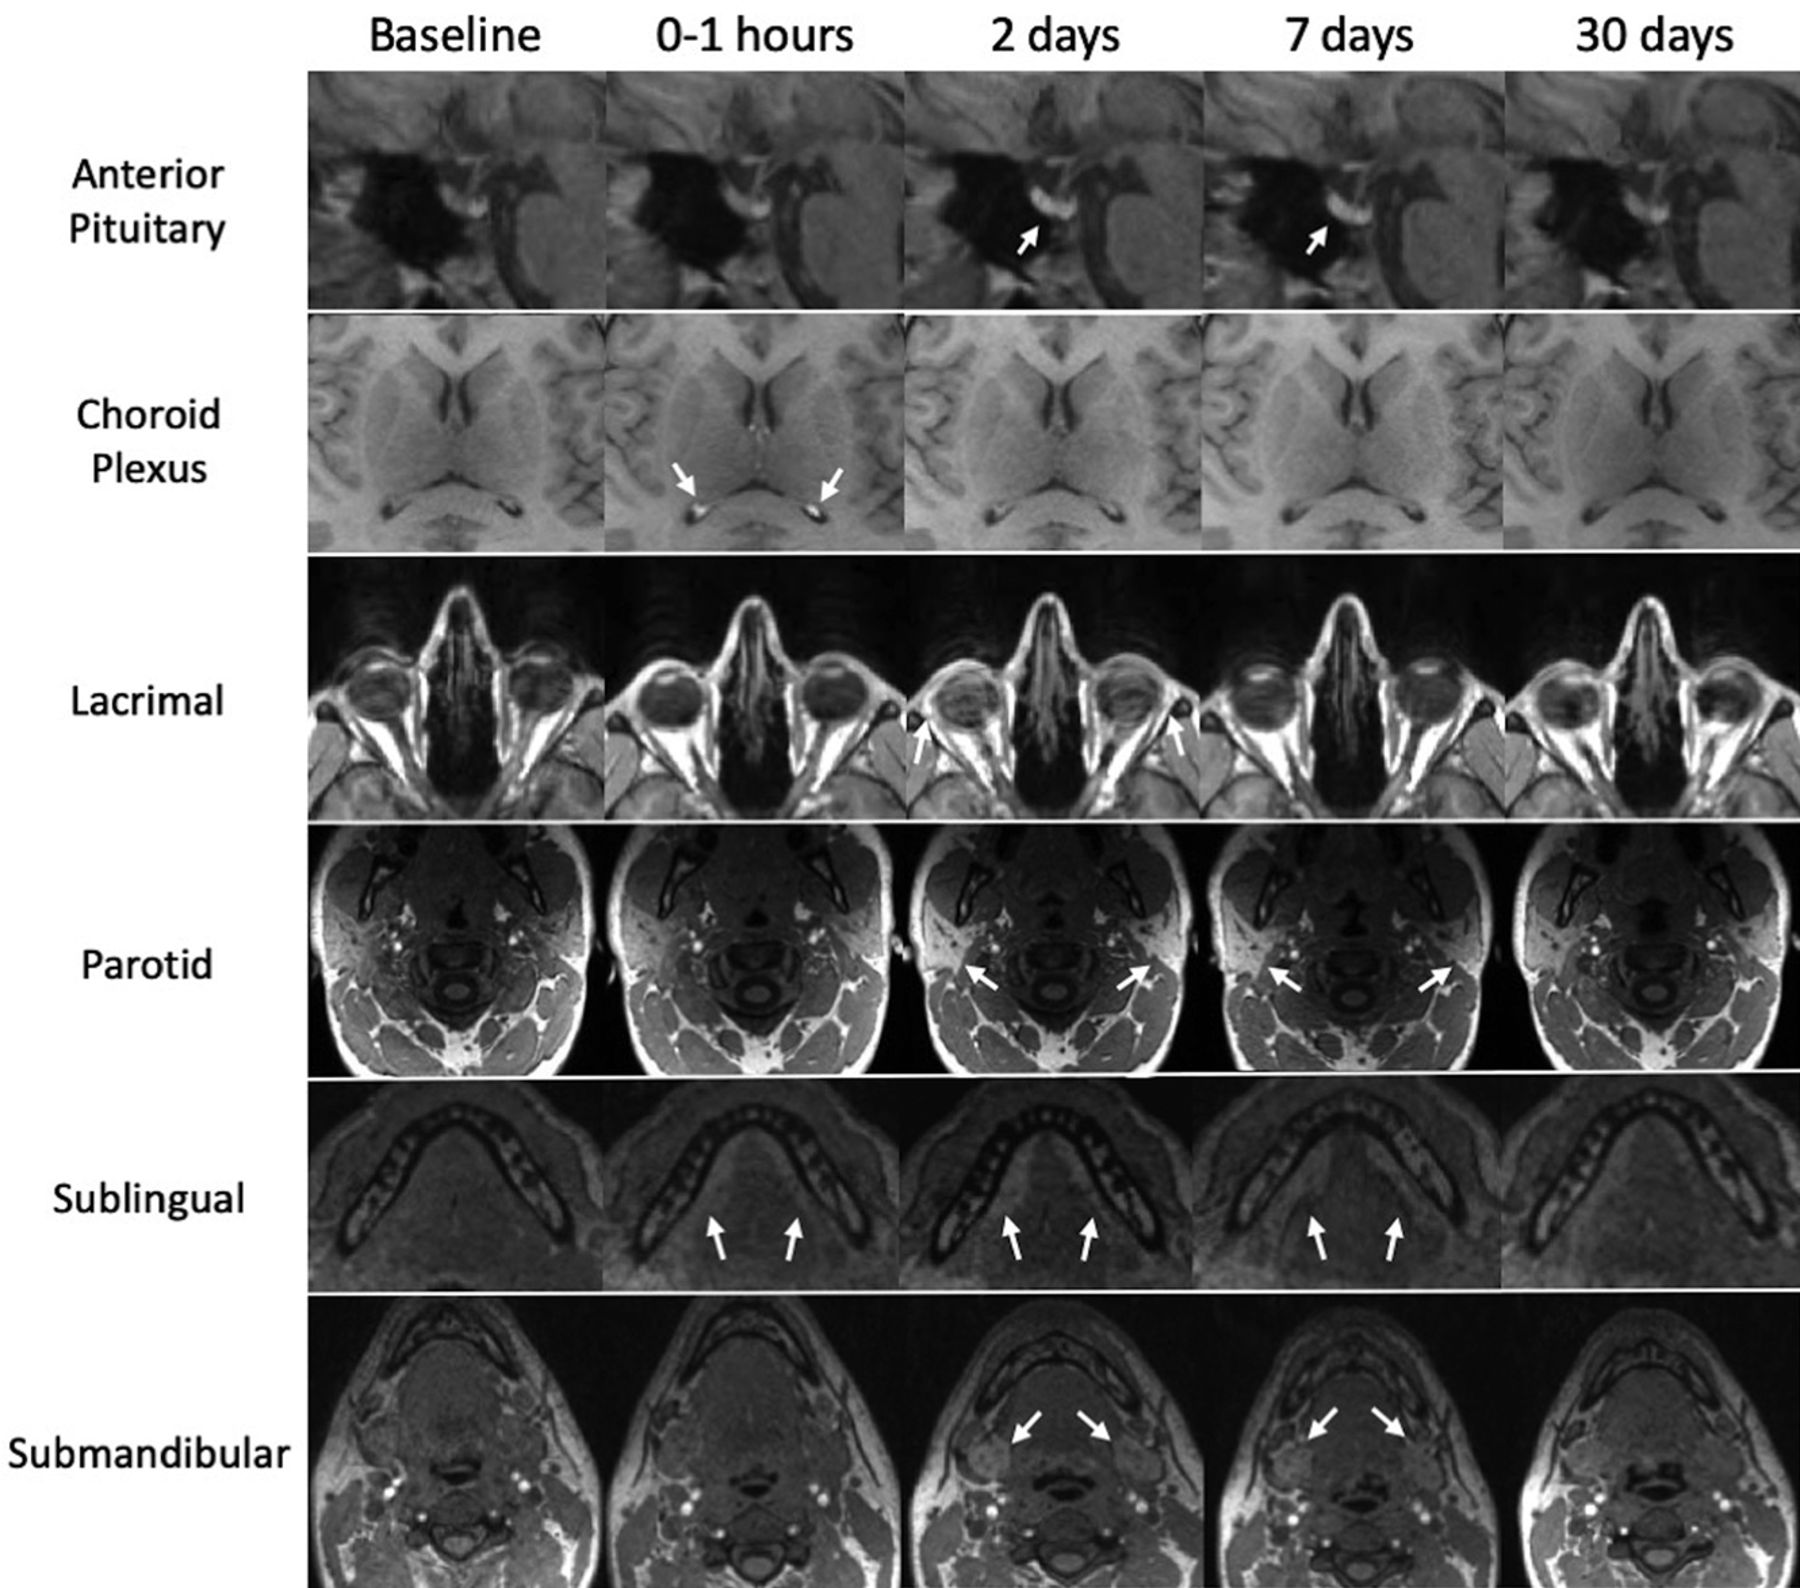
On administration of mangafodipir, T1-weighted signal intensity of the choroid plexus increased within the first hour (Figs 1 and 2). In the 2 healthy volunteers scanned within the first 2 hours, enhancement was noted both quantitatively and qualitatively within the first 5 minutes after infusion (Fig 2), reaching maximum intensity in the 11- to 40-minute range. During the next 24 hours, the signal intensity decreased, achieving pre-infusion levels around 5–7 days (Figs 1 and 2). No further enhancement was noted for the remainder of the study period. Analysis of T1 maps did not show clear shortening of the T1 time (On-line Fig 2).

Manganese uptake in intracranial and extracranial structures. Images from healthy volunteer 1 and healthy volunteer 2 show manganese enhancement on T1-weighted images. Time points for the anterior pituitary, lacrimal, parotid, and submandibular glands were at 5 minutes, 2 days, 7 days, and 30 days after mangafodipir administration; for the choroid plexus and sublingual gland, postmangafodipir time points were at 1 hour, 2 days, 7 days, and 30 days.

Kinetics of manganese enhancement in selected intracranial and extracranial structures. Quantification of T1-weighted signal intensity, normalized to the corpus callosum and measured as a fold change relative to baseline in healthy volunteers (n = 8). Each dot represents a scan at the specified time point; in some cases, a single individual had several scans within the same time window. The population mean and standard error are also shown. All structures enhanced at P < .05.
Anterior Pituitary Gland
In the 2 healthy volunteers scanned within the first 2 hours, enhancement was noted both quantitatively and qualitatively (Fig 2), but enhancement peaked in the 1- to 24-hour range (Figs 1 and 2). For most volunteers, this signal persisted for at least a week and resolved by the month 1 time point. In 2 volunteers, enhancement of the anterior pituitary gland resolved by the week 1 time point. No further enhancement of the anterior pituitary gland was observed for the remainder of the study period. Analysis of T1 values did not show a statistically significant decrease, in part because fewer data points were available for analysis (On-line Fig 2), but data suggest a possible nadir in the 1- to 24-hour range.
Exocrine Glands
The parotid, sublingual, submandibular, and lacrimal glands all demonstrated signal enhancement after mangafodipir infusion in the 1- to 24-hour range (Figs 1 and 2). The parotid and lacrimal glands had peak enhancement at approximately 5–7 days, whereas the sublingual and submandibular glands had peak enhancement in the 1- to 24-hour range (Fig 2). Probably due to their position at the edge of the head coil, T1-weighted signal in the exocrine glands was much more variable compared with enhancing intracranial structures. Whereas most volunteers had resolution of exocrine gland enhancement by month 1, two volunteers had resolution by month 2, and 1 volunteer had resolution by month 3. Quantitative T1 maps contained artifacts within several exocrine gland structures, which rendered analysis of T1 values highly variable (On-line Fig 2).
Brain
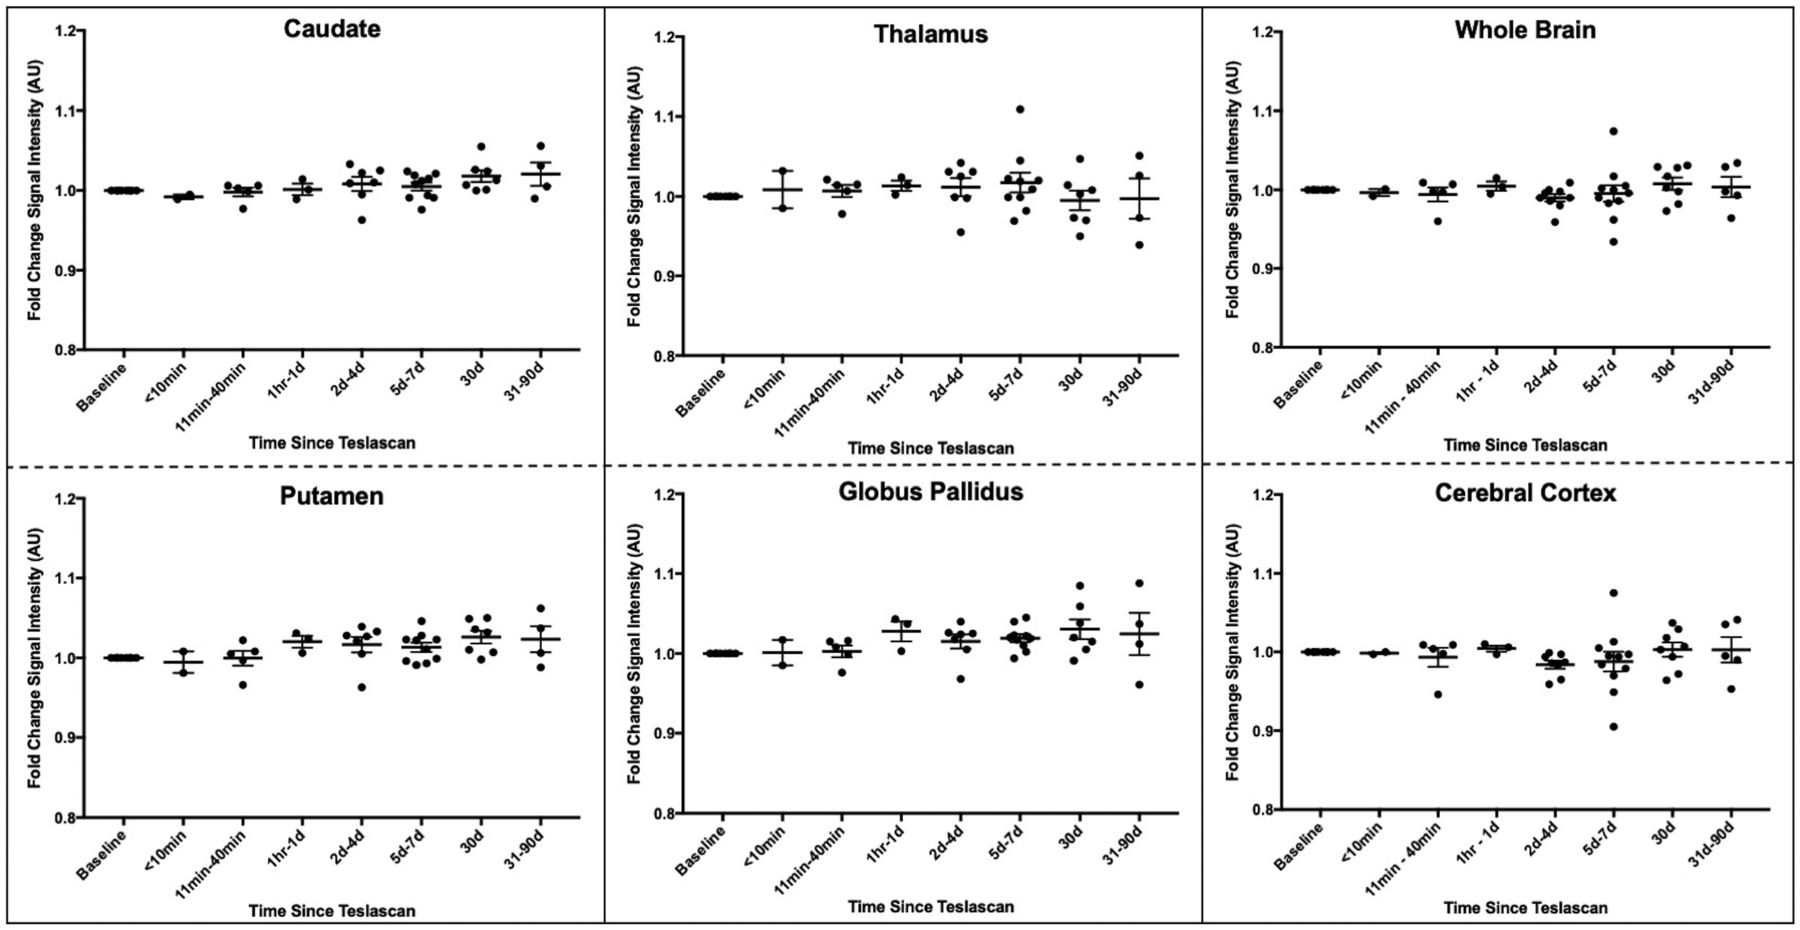
Relative to the corpus callosum, there was no evidence of manganese retention in the analyzed brain structures at various postmangafodipir time points and at month 1 (Fig 3). In particular, signal intensities in the caudate, putamen, globus pallidus, thalamus, cerebral cortex, and whole brain showed no clear change during the entire study period. Similarly, T1 maps, which are not normalized to the corpus callosum, showed no change in any of these structures or in the corpus callosum itself (On-line Fig 3).

T1-weighted signal does not change in the basal ganglia, cerebral cortex, or whole brain after mangafodipir administration. Quantification of T1-weighted signal intensity, normalized to the corpus callosum and measured as a fold change relative to baseline in healthy volunteers (n = 8), in selected brain structures. Each dot represents a scan at the specified time point, summarized as mean ± standard error.
Adverse Reactions
There were no serious adverse reactions with mangafodipir administration. One volunteer reported a transient sensation of flushing and warmth, which did not require intervention. No additional symptoms were noted by the participants for the study period. Laboratory values did not significantly change after mangafodipir administration during the study period, at either week 1 or month 1.
Time Course of Manganese Enhancement
The time courses of manganese-induced signal enhancement and washout in the structures with significant changes with time are described in On-line Fig 4. For all 6 structures, the slopes before and after the knot were nonzero for the bootstrapped data. Although rates of enhancement were similar across structures, rates of washout were slowest in the exocrine glands.
Discussion
Manganese has shown promise as a functional intracellular MR imaging contrast agent through its ability to evaluate cellular integrity, activity, and neural connectivity. Manganese ion has been used as an imaging biomarker for cellular viability and structural integrity, as a surrogate for the cellular calcium ion transport, and for neural tract visualization. In this study, manganese ions released from mangafodipir in healthy volunteers resulted in enhancement of several intracranial and extracranial structures: the choroid plexus, anterior pituitary gland, and exocrine glands of the head and neck. Structures covered with a blood-brain barrier did not exhibit visible manganese enhancement. Mangafodipir was well-tolerated, without serious adverse effects or changes in laboratory values.
Choroid Plexus
The choroid plexus is a collection of specialized ependymal cells that forms the blood-CSF barrier and is responsible for the accumulation and transport of several substrates and heavy metals, including manganese.16 In rats, manganese administration with a bolus dose of MnCl2 revealed a specific time-dependent pattern of enhancement of structures outside the blood-brain barrier: the choroid plexus within 10 minutes of administration, followed by CSF and periventricular brain structures.16 A similar distribution of manganese enhancement was observed in marmoset monkeys, with enhancement in the choroid plexus and later in the periventricular brain parenchyma, though no clear ventricular enhancement was seen.17 In a prior study in humans, bolus doses of mangafodipir provided enhancement of the choroid plexus, which peaked at 1.5 hours and resolved by 2 days.13 These findings correlate well with the enhancement dynamics of the choroid plexus that were noted in the current study. However, distinct from the findings in rats, no clear enhancement of the CSF or surrounding brain parenchyma has been demonstrated in human beings. This could potentially be explained by the much lower dose of manganese derived from mangafodipir compared with MnCl2 delivered to animals. Furthermore, in this study, quantitative analysis of the choroid plexus did not show significant T1 shortening, even though there was clear signal enhancement on T1-weighted MR imaging. This is likely due to insufficient data at early time points and noise in the T1 measurements and to the small size of the choroid plexus, which results in partial volume effects from the long-T1 CSF.
The choroid plexus plays a significant biologic role in manganese ion homeostasis and transport. Whereas the blood-brain barrier and choroid plexus both transport the manganese ion at physiologic concentrations, when blood levels rise, the manganese ion preferentially accumulates in and is transported through the choroid plexus.18 Indeed, recent studies have provided evidence for active, unidirectional, blood-to-CSF transport in the choroid plexus with slow manganese ion efflux rates.19 Several transporters with varying levels of manganese ion affinity have been identified (eg, divalent metal transporter 1, ZIP8/14, calcium ion [Ca2+] channels), but the specificity and presence of these channels in human choroidal tissue is yet to be determined.9 In our healthy volunteers, it is possible that manganese follows this established pathway with basolateral uptake, transcytoplasmic transfer, and release at the apical membrane into the CSF under the control of these transporters. While out of scope of this current study, characterization of manganese levels in the CSF could further provide evidence for this mechanism.
Anterior Pituitary Gland
The anterior pituitary gland lies outside the blood-brain barrier and has been known for several decades to be susceptible to manganese enhancement. Previous distribution studies in mice, rats, and monkeys identified liver, kidney, and endocrine glands as major sites of manganese accumulation after parenteral exposure.20⇓–22 Aoki et al16 demonstrated enhancement of the anterior pituitary gland within 2 hours of MnCl2 infusion. In a different study, continuous MnCl2 administration via mini-osmotic pumps led to a differential enhancement of manganese within the pituitary gland, with the anterior pituitary gland having a greater manganese-dependent increase in T1-weighted signal compared with the posterior pituitary gland.23 In marmosets given MnCl2, the greatest enhancement was in the anterior pituitary gland, with an approximate 3.5-fold increase in T1-weighted signal.15 Infusion of mangafodipir in healthy volunteers led to a dose-dependent stable enhancement of the anterior pituitary gland for >72 hours, with an approximately 1.5-fold increase from baseline signal.13 The same study noted a prolonged and slow recovery of manganese-associated enhancement, with 23% of initial signal still present at 4 weeks. Similarly, the findings from our own study show a peak signal intensity ∼1.5-fold greater than the baseline scan in the anterior pituitary gland. However, resolution of enhancement was achieved quicker in the current study.
Exocrine Glands
There are reports of exocrine gland enhancement with manganese ions in various species. In mice given continuous MnCl2 dosing, there was a several-fold increase in signal intensities of the submandibular and parotid glands.23 Biodistribution studies with manganese-52 (52Mn) PET imaging in mice demonstrated significant uptake and persistence in the salivary glands, with greater uptake noted through parenteral exposure as opposed to inhalation.20 Similar findings have been observed in manganese distribution studies in rats and monkeys.21,24 Given this affinity of manganese for the salivary glands, Seshadri and Hoy25 used MEMRI to evaluate manganese-dependent enhancement of salivary glands and head-and-neck tumors in nude mice. There was excellent visualization and delineation of both normal salivary glands and ectopic/orthotopic tumors with a strong T1-shortening effect.
Mechanisms of manganese ion entry and retention in exocrine glands have not been established, but 2 characteristics of the exocrine glands are likely to be at play: high mitochondrial density and extensive transport coupled to calcium signaling.26 Synthesis of digestive enzymes by the salivary glands requires many mitochondria, which have been reported to accumulate intracellular manganese.9 Vesicular release of digestive enzymes occurs through calcium-mediated signaling and mobilization of intracellular stores of calcium from the endoplasmic reticulum into the cytoplasm, leading to exocytosis.27 Also, it is thought that the calcium is stored in secretory vesicles, which occupy 30% and 55% of cytosolic space of the rat parotid and submandibular glands, respectively.28 Manganese ions have also been seen to accumulate in the endoplasmic reticulum, and accumulation in secretory vesicles probably explains the ability of the manganese ion to cross synapses.29 Therefore, it is not surprising that the salivary glands in our healthy volunteers had long-lasting enhancement due to manganese ions.
Quantification of exocrine gland enhancement showed high variability of enhancement patterns across participants in the current study. Whereas all glands shared similar enhancement dynamics, fold change and T1 relaxation times were heterogeneous across glands (Fig 2). Although a biologic reason for these differences is possible, they are more likely explained by signal drop-out and inhomogeneities as a consequence of technical factors, including the larger distance between the exocrine glands and the radiofrequency receive coil used in this study. In addition, quantitative T1 maps contained numerous bright artifacts that interfered with accurate analysis of T1 values. The artifacts were likely derived from the presence of fluid and fat within exocrine glands, which can affect measurement of T1 relaxation times.30 Further optimization of MR imaging for salivary gland enhancement with manganese will likely provide a more accurate quantification of its enhancement dynamics and potential utility for detecting and discriminating glandular pathology.
Comparison of Manganese and Gadolinium
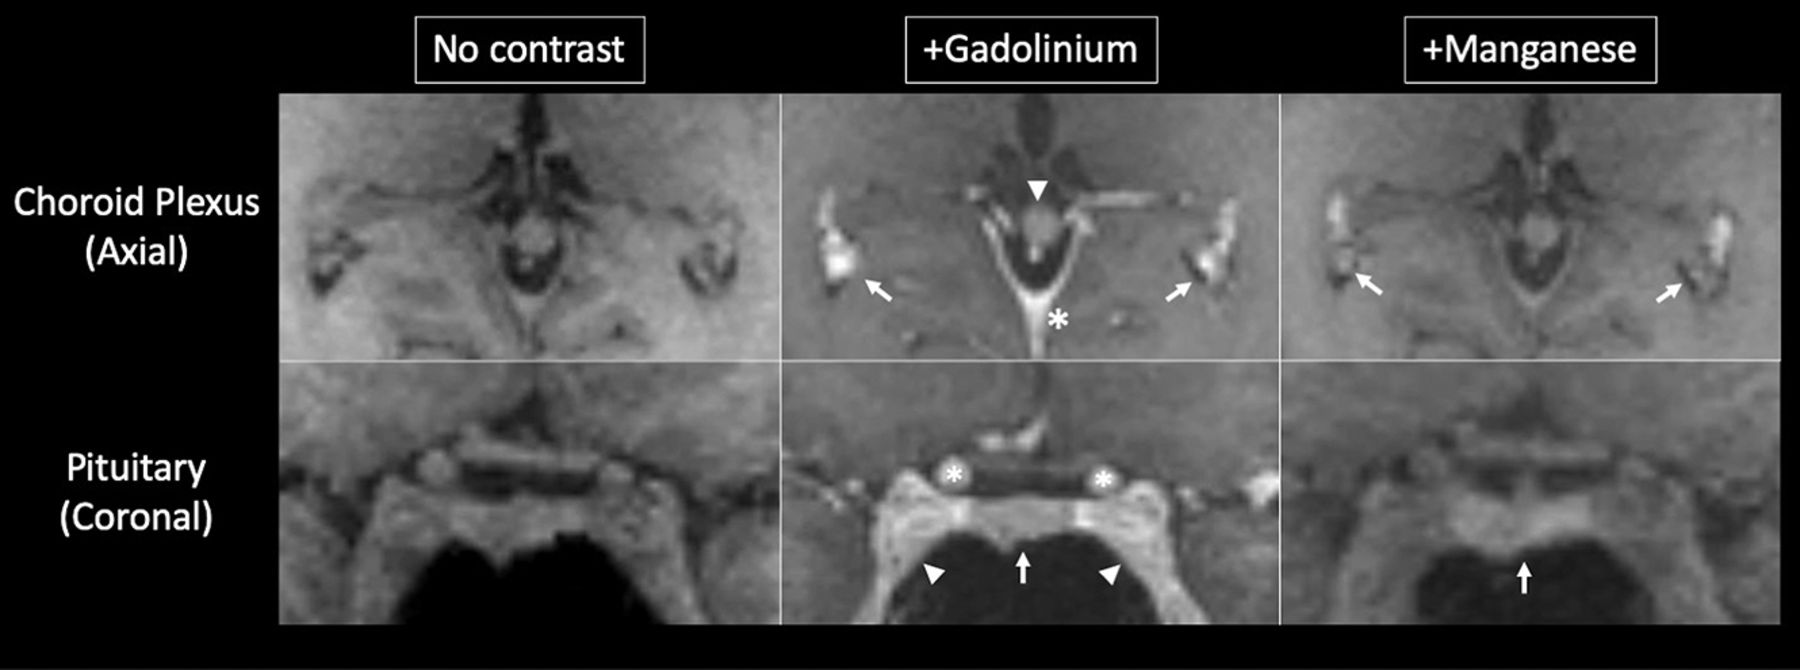
Retrospective comparison of contrast enhancement between manganese and gadolinium further highlights the distinct enhancement pattern of manganese (Fig 4). With manganese, there was selective enhancement of the anterior pituitary gland without appreciable signal change in neighboring structures. Gadolinium, on the other hand, induced broader enhancement in the region, increasing T1-weighted signal in the anterior pituitary gland, cavernous sinus, and intravascular spaces. Within the choroid plexus, the distribution of manganese-related enhancement was similar to that of gadolinium, with the exception of the choroid glomus regions. Additionally, enhancement of the posterior falx cerebri and pineal gland was demonstrated clearly with gadolinium, but not with manganese.

Manganese enhances brain structures in a different manner compared with gadolinium. Upper row, Gadolinium induces homogeneous enhancement of the choroid plexus (arrows), posterior falx cerebri (asterisk), and pineal gland (arrowhead). On the other hand, mangafodipir enhances the choroid glomus in a heterogeneous manner. Lower row, Gadolinium induces enhancement of the anterior pituitary gland (arrow), cavernous sinus (arrowheads), and internal carotid arteries (asterisks), whereas mangafodipir selectively enhances the pituitary gland. Note the enhancement of the vasculature with gadolinium but not with manganese. Images were obtained ∼20 minutes after gadolinium administration and ∼1 hour after mangafodipir administration. Gadolinium images were acquired before enrollment in this protocol as a part of other National Institutes of Health MR imaging studies.
It has been shown that intracellularly, compared with an in vitro environment, manganese binds to macromolecules, which greatly enhances proton relaxation.31 Thus, it is likely that manganese enhancement reflects more specifically the cellular components of tissue. Conversely, intravascular spaces do not seem to enhance with manganese (at concentrations derived from mangafodipir). Together, these properties may aid in delineating tissue borders, providing useful information for clinical surveillance and surgical planning. Overall, this comparison highlights the ability of manganese to yield specific intracellular enhancement in regions not covered by the blood-brain barrier.
Mangafodipir Safety
Historically, the application of MEMRI in humans has been limited by the toxic effects of high bolus doses of free manganese ions. Mangafodipir is the only FDA-approved manganese-based contrast agent for intravenous use in humans and has an excellent safety record.32 The most common adverse effects observed in Phase III studies were flushing and nausea.32 Our findings further strengthen the safety profile of mangafodipir. None of the healthy volunteers had serious adverse events during or after infusion. One healthy volunteer had mild transient flushing, likely due to vasodilatory effects of manganese, which self-resolved without further sequelae. We did not observe changes in prolactin, suggesting that the manganese ion did not impair anterior pituitary gland function. In addition, participants did not have changes in vital signs or clinical parameters postinfusion.32
It has been observed that abnormal T1-weighted signal in the basal ganglia precedes development of neurologic symptoms related to manganese toxicity.32 Thus, monitoring T1-weighted signal changes in the basal ganglia provides a way to assess the development of manganese-related toxicity. In our study, postmanganese T1-weighted signal intensities did not change in the basal ganglia, whole brain, or cerebral cortex during the study period (On-line Fig 3). None of the participants reported additional neurologic or clinical changes within the study period.
Study Limitations
Given the exploratory nature of this study, there are key limitations that are important to address. The main objective of this study was to evaluate enhancement dynamics using MEMRI with mangafodipir in healthy volunteers. Thus, while this study has provided evidence of manganese enhancement in various structures at various time points as well as the lack of manganese retention in the brain, it was not powered for assessing safety. While we do not expect manganese-related adverse effects past our study window, we did not pursue long-term follow-up scans. Furthermore, this study was not designed to establish within-subject variability in manganese enhancement characteristics because we were primarily interested in obtaining a general trend of manganese enhancement.
The delivered dose of the manganese ion from mangafodipir also poses a limitation and probably explains why parenchymal structures behind the blood-brain barrier failed to enhance despite clear evidence of choroid plexus enhancement. Due to the potential neurotoxicity of repeat/chronic manganese exposure, mangafodipir is only FDA-approved for 1-time dosing. The manganese ion is released from mangafodipir and then likely binds, to some extent, to serum proteins, lowering the concentration of circulating manganese ions available for intracellular enhancement.11 Reduced circulating free manganese ions could explain the differences seen in the enhancement patterns between human and animal studies, which use higher effective doses of manganese. Therefore, whether enhancement patterns seen in humans are due to differences in the manganese ion uptake in humans or to lower concentrations of the manganese ion is yet to be evaluated.
Conclusions
This study establishes MEMRI with mangafodipir as a viable neuroradiologic method in humans, especially for structures residing outside the blood-brain barrier (including the anterior pituitary gland, choroid plexus, and exocrine glands) and sets the stage for future exploration under normal and pathologic tissue states.
Acknowledgments
We thank the staff of the National Institute of Neurological Disorders and Stroke Neuroimmunology Clinic and Clinical Trials Unit (in particular, Rosalind Hayden, Rosemarie Cuento, and Sandra Martin), the National Institutes of Health Pharmaceutical Development Section (especially Gopal Potti and Judith Starling), and the National Institute of Mental Health Functional MR imaging Facility for their assistance at various stages of this study.
Footnotes
Disclosures: Blake Dewey—UNRELATED: Grants/Grants Pending: Biogen, Comments: partially supported by a grant.* Bruce A. Berkowitz—UNRELATED: Employment: Wayne State University. *Money paid to the institution.
This study was supported by the Intramural Research Program of National Institute of Neurological Disorders and Stroke (Z01NS003119), the National Institutes of Health Medical Research Scholars Program, and the National Institutes of Health (RO1 EY026584, RO1 AG058171 to B.A.B.).
Paper previously presented as an oral presentation at: Annual Meeting of American Society of Neuroradiology and the Foundation of the ASNR Symposium, June 2–7, 2018; Vancouver, British Columbia, Canada.
Indicates open access to non-subscribers at www.ajnr.org
REFERENCES
- Received January 18, 2019.
- Accepted after revision June 13, 2019.
- © 2019 by American Journal of Neuroradiology


Jump to section
Related Articles
Cited By...
- In vivo multi-parametric manganese-enhanced MRI for detecting senile plaques in rodent models of Alzheimers disease
- Manganese-Enhanced MRI in Patients with Multiple Sclerosis
- Manganese Uptake and Accumulation in the Human Brain
- High-resolution MEMRI characterizes laminar specific ascending and descending spinal cord pathways in rats